International Business Machines Corp 10-Q 2003-09-30
Sign in or join
Add a note by highlighting text or Replying to an existing note.
Add a note by highlighting text or Replying to an existing note.
SECURITIES AND EXCHANGE COMMISSION
WASHINGTON, D.C. 20549
FORM 10Q
QUARTERLY REPORT PURSUANT TO SECTION 13 or 15(d)
OF THE SECURITIES EXCHANGE ACT OF 1934
FOR THE QUARTER ENDED SEPTEMBER 30, 2003
1-2360
(Commission file number)
INTERNATIONAL BUSINESS MACHINES CORPORATION
(Exact name of registrant as specified in its charter)
|
New York (State of incorporation) |
13-0871985 (IRS employer identification number) |
|
|
Armonk, New York (Address of principal executive offices) |
10504 (Zip Code) |
|
|
914-499-1900 (Registrant's telephone number) |
||
Indicate by check mark whether the registrant (1) has filed all reports required to be filed by Section 13 or 15(d) of the Securities Exchange Act of 1934 during the preceding 12 months (or for such shorter period that the registrant was required to file such reports), and (2) has been subject to such filing requirements for the past 90 days. Yes ý No o
Indicate by check mark whether registrant is an accelerated filer (as defined in Exchange Act Rule 12b-2). Yes ý No o
The registrant has 1,720,423,202 shares of common stock outstanding at September 30, 2003.
|
|
Page |
|||
|---|---|---|---|---|
| Part IFinancial Information: | ||||
|
Item 1. Consolidated Financial Statements |
||||
Consolidated Statement of Earnings for the three and nine months ended September 30, 2003 and 2002 |
1 |
|||
Consolidated Statement of Financial Position at September 30, 2003 and December 31, 2002 |
3 |
|||
Consolidated Statement of Cash Flows for the nine months ended September 30, 2003 and 2002 |
5 |
|||
Notes to Consolidated Financial Statements |
6 |
|||
|
Item 2. Management's Discussion and Analysis of Results of Operations and Financial Condition |
18 |
|||
|
Item 4. Controls and Procedures |
40 |
|||
|
Part IIOther Information |
41 |
|||
ITEM 1. Consolidated Financial Statements
INTERNATIONAL BUSINESS MACHINES CORPORATION
AND SUBSIDIARY COMPANIES
CONSOLIDATED STATEMENT OF EARNINGS
(UNAUDITED)
|
|
Three Months Ended September 30, |
Nine Months Ended September 30, |
|||||||||||
|---|---|---|---|---|---|---|---|---|---|---|---|---|---|
|
|
2003 |
2002 |
2003 |
2002 |
|||||||||
|
(Dollars in millions except per share amounts) |
|
||||||||||||
| Revenue: | |||||||||||||
| Global Services | $ | 10,383 | $ | 8,895 | $ | 31,187 | $ | 25,785 | |||||
| Hardware | 6,697 | 6,764 | 19,118 | 19,320 | |||||||||
| Software | 3,461 | 3,110 | 10,061 | 9,273 | |||||||||
| Global Financing | 715 | 795 | 2,092 | 2,403 | |||||||||
| Enterprise Investments/Other | 266 | 257 | 760 | 721 | |||||||||
| Total revenue | 21,522 | 19,821 | 63,218 | 57,502 | |||||||||
|
Cost: |
|||||||||||||
| Global Services | 7,782 | 6,540 | 23,298 | 19,015 | |||||||||
| Hardware | 5,011 | 4,957 | 14,104 | 14,420 | |||||||||
| Software | 491 | 500 | 1,452 | 1,549 | |||||||||
| Global Financing | 302 | 348 | 897 | 1,044 | |||||||||
| Enterprise Investments/Other | 124 | 153 | 424 | 381 | |||||||||
| Total cost | 13,710 | 12,498 | 40,175 | 36,409 | |||||||||
| Gross profit | 7,812 | 7,323 | 23,043 | 21,093 | |||||||||
|
Expense: |
|||||||||||||
| Selling, general and administrative | 4,303 | 3,987 | 12,978 | 13,298 | |||||||||
| Research, development and engineering | 1,307 | 1,213 | 3,728 | 3,546 | |||||||||
| Intellectual property and custom development income | (406 | ) | (232 | ) | (887 | ) | (771 | ) | |||||
| Other (income) and expense | 26 | (83 | ) | 114 | 111 | ||||||||
| Interest expense | 33 | 34 | 114 | 97 | |||||||||
| Total expense and other income | 5,263 | 4,919 | 16,047 | 16,281 | |||||||||
|
Income from continuing operations before income taxes |
2,549 |
2,404 |
6,996 |
4,812 |
|||||||||
| Provision for income taxes | 764 | 710 | 2,099 | 1,389 | |||||||||
| Income from continuing operations | 1,785 | 1,694 | 4,897 | 3,423 | |||||||||
(The accompanying notes are an integral part of the financial statements.)
1
INTERNATIONAL BUSINESS MACHINES CORPORATION
AND SUBSIDIARY COMPANIES
CONSOLIDATED STATEMENT OF EARNINGS(CONTINUED)
(UNAUDITED)
|
|
Three Months Ended September 30, |
Nine Months Ended September 30, |
|||||||||||||
|---|---|---|---|---|---|---|---|---|---|---|---|---|---|---|---|
|
|
2003 |
2002 |
2003 |
2002 |
|||||||||||
|
(Dollars in millions except Per share amounts) |
|||||||||||||||
| Discontinued Operations | |||||||||||||||
| Loss from discontinued operations | | (381 | ) | (23 | ) | (862 | ) | ||||||||
| Net income | $ | 1,785 | $ | 1,313 | $ | 4,874 | $ | 2,561 | |||||||
|
Earnings per share of common stock: |
|||||||||||||||
| Assuming dilution | |||||||||||||||
| Continuing operations | $ | 1.02 | $ | 0.99 | $ | 2.78 | $ | 1.97 | |||||||
| Discontinued operations | | (0.22 | ) | (0.01 | ) | (0.50 | ) | ||||||||
| Total | $ | 1.02 | $ | 0.76 | * | $ | 2.77 | $ | 1.47 | ||||||
| Basic | |||||||||||||||
| Continuing operations | $ | 1.04 | $ | 1.00 | $ | 2.84 | $ | 2.01 | |||||||
| Discontinued operations | | (0.23 | ) | (0.01 | ) | (0.51 | ) | ||||||||
| Total | $ | 1.04 | $ | 0.78 | * | $ | 2.82 | * | $ | 1.50 | |||||
| Average number of common shares outstanding (millions): | |||||||||||||||
Assuming dilution |
1,756.4 |
1,711.7 |
1,759.5 |
1,731.7 |
|||||||||||
Basic |
1,722.6 |
1,690.5 |
1,725.9 |
1,704.6 |
|||||||||||
|
Cash dividends per common share |
$ |
0.16 |
$ |
0.15 |
$ |
0.47 |
$ |
0.44 |
|||||||
(The accompanying notes are an integral part of the financial statements.)
2
INTERNATIONAL BUSINESS MACHINES CORPORATION
AND SUBSIDIARY COMPANIES
CONSOLIDATED STATEMENT OF FINANCIAL POSITION
ASSETS
|
|
At September 30, 2003 (Unaudited) |
At December 31, 2002 |
||||||
|---|---|---|---|---|---|---|---|---|
|
(Dollars in millions) |
||||||||
| Assets | ||||||||
| Current assets: | ||||||||
| Cash and cash equivalents | $ | 5,451 | $ | 5,382 | ||||
| Marketable securitiesat fair value, which approximates market value | 720 | 593 | ||||||
| Notes and accounts receivabletrade, net of allowances | 9,480 | 9,915 | ||||||
| Short-term financing receivables | 15,232 | 15,996 | ||||||
| Other accounts receivable | 1,518 | 1,447 | ||||||
| Inventories, at lower of average cost or net realizable value | ||||||||
| Finished goods | 1,109 | 960 | ||||||
| Work in process and raw materials | 2,173 | 2,188 | ||||||
| Total inventories | 3,282 | 3,148 | ||||||
| Deferred taxes | 2,443 | 2,617 | ||||||
| Intangible assetsnet | 209 | 175 | ||||||
| Prepaid expenses and other current assets | 2,231 | 2,379 | ||||||
| Total current assets | 40,566 | 41,652 | ||||||
Plant, rental machines and other property |
36,721 |
36,083 |
||||||
| Less: Accumulated depreciation | 22,232 | 21,643 | ||||||
| Plant, rental machines and other propertynet | 14,489 | 14,440 | ||||||
| Long-term financing receivables | 9,698 | 11,440 | ||||||
| Prepaid pension assets | 17,555 | 16,003 | ||||||
| Intangible assetsnet | 728 | 562 | ||||||
| Goodwill | 6,597 | 4,115 | ||||||
| Investments and sundry assets | 7,557 | 8,272 | ||||||
| Total assets | $ | 97,190 | $ | 96,484 | ||||
(The accompanying notes are an integral part of the financial statements.)
3
INTERNATIONAL BUSINESS MACHINES CORPORATION
AND SUBSIDIARY COMPANIES
CONSOLIDATED STATEMENT OF FINANCIAL POSITION(CONTINUED)
LIABILITIES AND STOCKHOLDERS' EQUITY
|
|
At September 30, 2003 (Unaudited) |
At December 31, 2002 |
|||||||
|---|---|---|---|---|---|---|---|---|---|
|
(Dollars in millions except per share amounts) |
|
|
|||||||
| Liabilities and Stockholders' Eauity | |||||||||
| Current liabilities: | |||||||||
| Taxes | $ | 4,483 | $ | 5,476 | |||||
| Short-term debt | 5,935 | 6,031 | |||||||
| Accounts payable and accruals | 22,178 | 23,043 | |||||||
| Total current liabilities | 32,596 | 34,550 | |||||||
Long-term debt |
17,089 |
19,986 |
|||||||
| Retirement and nonpension postretirement benefit obligations | 13,685 | 13,215 | |||||||
| Other liabilities | 6,494 | 5,951 | |||||||
| Total liabilities | 69,864 | 73,702 | |||||||
|
Stockholders' equity: |
|||||||||
| Common stockpar value $.20 per share | 15,674 | 14,858 | |||||||
| Shares authorized: 4,687,500,000 | |||||||||
| Shares issued: 20031,930,393,750 20021,920,957,772 |
|||||||||
| Retained earnings | 35,197 | 31,555 | |||||||
| Treasury stockat cost | (21,068 | ) | (20,213 | ) | |||||
| Shares: 2003209,970,548 2002198,590,876 |
|||||||||
| Accumulated gains and losses not affecting retained earnings | (2,477 | ) | (3,418 | ) | |||||
| Total stockholders' equity | 27,326 | 22,782 | |||||||
| Total liabilities and stockholders' equity | $ | 97,190 | $ | 96,484 | |||||
(The accompanying notes are an integral part of the financial statements.)
4
INTERNATIONAL BUSINESS MACHINES CORPORATION
AND SUBSIDIARY COMPANIES
CONSOLIDATED STATEMENT OF CASH FLOWS
FOR THE NINE MONTHS ENDED SEPTEMBER 30, (UNAUDITED)
|
|
2003 |
2002 |
|||||||
|---|---|---|---|---|---|---|---|---|---|
|
(Dollars in millions) |
|
|
|||||||
| Cash flow from operating activities from continuing operations: | |||||||||
| Income from continuing operations | $ | 4,897 | $ | 3,423 | |||||
| Adjustments to reconcile income from continuing operations to cash provided from operating activities: | |||||||||
| Depreciation | 2,909 | 3,276 | |||||||
| Amortization of software | 560 | 506 | |||||||
| Gain on disposition of fixed and other assets | (124 | ) | (221 | ) | |||||
| Changes in operating assets and liabilities | 1,575 | 2,431 | |||||||
| Net cash provided from operating activities from continuing operations | 9,817 | 9,415 | |||||||
| Cash flow from investing activities from continuing operations: | |||||||||
| Payments for plant, rental machines and other property, net of proceeds | (2,443 | ) | (2,851 | ) | |||||
| Investment in software | (431 | ) | (420 | ) | |||||
| Acquisition of businesses | (1,773 | ) | (175 | ) | |||||
| Purchases of marketable securities and other investments | (5,618 | ) | (301 | ) | |||||
| Proceeds from marketable securities and other investments | 5,749 | 443 | |||||||
| Net cash used in investment activities from continuing operations | (4,516 | ) | (3,304 | ) | |||||
| Cash flow from financing activities from continuing operations: | |||||||||
| Proceeds from new debt | 1,298 | 3,969 | |||||||
| Payments to settle debt | (5,220 | ) | (3,983 | ) | |||||
| Short-term borrowings/(repayments) less than 90 daysnet | 83 | (2,639 | ) | ||||||
| Common stock transactionsnet | (620 | ) | (3,327 | ) | |||||
| Cash dividends paid | (811 | ) | (751 | ) | |||||
| Net cash used in financing activities from continuing operations | (5,270 | ) | (6,731 | ) | |||||
| Effect of exchange rate changes on cash and cash equivalents | 202 | 94 | |||||||
| Net cash flow used by discontinued operations | (164 | ) | (588 | ) | |||||
| Net change in cash and cash equivalents | 69 | (1,114 | ) | ||||||
| Cash and cash equivalents at January 1 | 5,382 | 6,330 | |||||||
| Cash and cash equivalents at September 30 | $ | 5,451 | $ | 5,216 | |||||
(The accompanying notes are an integral part of the financial statements.)
5
Notes to Consolidated Financial Statements
1. In the opinion of the management of International Business Machines Corporation (the company), all adjustments, which are of a normal recurring nature, necessary to a fair statement of the results for the unaudited three- and nine-month periods have been made.
2. The company applies Accounting Principles Board (APB) Opinion No. 25, "Accounting for Stock Issued to Employees," and related Interpretations in accounting for its stock-based compensation plans. Accordingly, the company records expense for employee stock compensation plans equal to the excess of the market price of the underlying IBM shares at the date of grant over the exercise price of the stock-related award, if any (known as the intrinsic value). Generally, all employee stock options are issued with the exercise price equal to the market price of the underlying shares at grant date and therefore, no compensation expense is recorded. In addition, no compensation expense is recorded for purchases under the Employee Stock Purchase Program (ESPP) in accordance with APB No. 25. The intrinsic value of restricted stock units and certain other stock-based compensation issued to employees as of the date of grant is amortized to compensation expense over the vesting period. To the extent there are performance criteria that could result in an employee receiving more or less (including zero) shares than the number of units granted, the unamortized liability is marked to market during the performance period based upon the intrinsic value at the end of each quarter.
The following table summarizes the pro forma operating results of the company had compensation cost for stock options granted and for employee stock purchases under the ESPP been determined in accordance with the fair value based method prescribed by Statement of Financial Accounting Standards (SFAS) No. 123, "Accounting for Stock-Based Compensation".
|
|
Three Months Ended September 30, |
Nine Months Ended September 30, |
|||||||||||
|---|---|---|---|---|---|---|---|---|---|---|---|---|---|
|
|
2003 |
2002 |
2003 |
2002 |
|||||||||
|
(Dollars in millions except per share amounts) |
|
|
|
|
|||||||||
| Net income | $ | 1,785 | $ | 1,313 | $ | 4,874 | $ | 2,561 | |||||
| Add: Stock-based compensation expense included in reported net income, net of related tax effects | 2 | 9 | 47 | 26 | |||||||||
| Deduct: Total stock-based employee compensation expense determined under fair value method for all awards, net of related tax effects | 292 | 292 | 803 | 838 | |||||||||
| Pro forma net income | $ | 1,495 | $ | 1,030 | $ | 4,118 | $ | 1,749 | |||||
| Earnings per share of common stock: | |||||||||||||
| Basicas reported | $ | 1.04 | $ | 0.78 | $ | 2.82 | $ | 1.50 | |||||
| Basicpro forma | $ | 0.87 | $ | 0.61 | $ | 2.39 | $ | 1.03 | |||||
| Assuming dilutionas reported | $ | 1.02 | $ | 0.76 | $ | 2.77 | $ | 1.47 | |||||
| Assuming dilutionpro forma | $ | 0.86 | $ | 0.61 | $ | 2.37 | $ | 1.02 | |||||
6
3. The following table summarizes Net income plus gains and losses not affecting retained earnings.
|
|
Three Months Ended September 30, |
Nine Months Ended September 30, |
||||||||||||
|---|---|---|---|---|---|---|---|---|---|---|---|---|---|---|
|
|
2003 |
2002 |
2003 |
2002 |
||||||||||
|
(Dollars in millions) |
|
|
|
|
||||||||||
| Net income | $ | 1,785 | $ | 1,313 | $ | 4,874 | $ | 2,561 | ||||||
| Gains and losses not affecting retained earnings (net of tax): | ||||||||||||||
| Foreign currency translation adjustments | 159 | (39 | ) | 1,001 | 411 | |||||||||
| Minimum pension liability adjustments | (2 | ) | 5 | (45 | ) | 23 | ||||||||
| Net unre alized gains/(losses) on marketable securities | 1 | (3 | ) | 5 | (16 | ) | ||||||||
| Net unrealized (losses)/gains on cash flow hedge derivatives | (36 | ) | 19 | (20 | ) | (567 | ) | |||||||
| Total gains /(losses) not affecting retained earnings | 122 | (18 | ) | 941 | (149 | ) | ||||||||
| Net income plus gains and losses not affecting retained earnings | $ | 1,907 | $ | 1,295 | $ | 5,815 | $ | 2,412 | ||||||
4. The Emerging Issues Task Force (EITF) recently reached a consensus on two issues relating to the accounting for multiple element arrangements: Issue No. 00-21, "Accounting for Revenue Arrangements with Multiple Deliverables", and Issue No. 03-05, "Applicability of AICPA SOP 97-2 to Non Software Deliverables in an Arrangement Containing More Than Incidental Software". The consensus opinion in EITF No. 03-05 clarifies the guidance in EITF 00-21 and was reached on July 31, 2003. The transition provisions allow either prospective application or a cumulative effect adjustment upon adoption. IBM adopted prospectively as of July 1, 2003. EITF Nos. 00-21 and 03-05 did not have a material impact on the Consolidated Financial Statements.
In April 2003, the Financial Accounting Standards Board (FASB) issued SFAS No. 149, "Amendment of Statement 133 on Derivative Instruments and Hedging Activities". SFAS No. 149 clarifies under what circumstances a contract with an initial net investment meets the characteristics of a derivative as discussed in Statement No. 133. It also specifies when a derivative contains a financing component that warrants special reporting in the Consolidated Statement of Cash Flows. SFAS No. 149 amends certain other existing pronouncements in order to improve consistency in reporting these types of transactions. The new guidance is effective for contracts entered into or modified after June 30, 2003, and for hedging relationships designated after June 30, 2003. SFAS No. 149 did not have a material effect on the Consolidated Financial Statements.
In May 2003, the FASB issued SFAS No. 150, "Accounting for Certain Financial Instruments with Characteristics of both Liabilities and Equity". It establishes classification and
7
measurement standards for three types of freestanding financial instruments that have characteristics of both liabilities and equity. Instruments within the scope of SFAS 150 must be classified as liabilities within the company's Consolidated Financial Statements and be reported at settlement date value. The provisions of SFAS 150 are effective for (1) instruments entered into or modified after May 31, 2003 and (2) pre-existing instruments as of July 1, 2003. On October 29, 2003, the FASB voted to indefinitely defer the effective date of SFAS 150 for mandatorily redeemable instruments as they relate to minority interests in consolidated finite-lived entities through the issuance of FASB Staff Position (FSP) 150-3. The adoption of SFAS 150, as modified by FSP 150-3, did not have a material effect on the Consolidated Financial Statements.
In January 2003, the FASB issued Interpretation No. 46 (FIN 46), "Consolidation of Variable Interest Entities," which addresses consolidation by business enterprises of variable interest entities that either: (1) do not have sufficient equity investment at risk to permit the entity to finance its activities without additional subordinated financial support, or (2) the equity investors lack an essential characteristic of a controlling financial interest. FIN 46 requires disclosure of Variable Interest Entities (VIEs) in financial statements issued after January 31, 2003, if it is reasonably possible that as of the transition date: (1) the company will be the primary beneficiary of an existing VIE that will require consolidation or, (2) the company will hold a significant variable interest in, or have significant involvement with, an existing VIE. Any VIEs created after January 31, 2003, are immediately subject to the consolidation guidance of FIN 46. Since the release of FIN 46, the FASB has issued numerous FSPs regarding FIN 46, three of which remain in proposed form. On October 9, 2003, the FASB released FSP 46-6, which deferred the effective date for the consolidation guidance of FIN 46 from July 1, 2003 to December 31, 2003, for VIEs existing prior to February 1, 2003.
Pursuant to the transition requirements of FSP 46-6, the company will adopt the consolidation guidance applicable to existing VIEs as of December 31, 2003. As a result of the emerging interpretations of and amendments to FIN 46, the company is continuing to evaluate the impact of FIN 46 and its related guidance. Their adoption, however, is not expected to have a material impact on the Consolidated Financial Statements.
In July 2002, the FASB issued SFAS No. 146, "Accounting for Costs Associated with Exit or Disposal Activities." SFAS No. 146 supersedes Emerging Issues Task Force (EITF) No. 94-3, "Liability Recognition for Certain Employee Termination Benefits and Other Costs to Exit An Activity (Including Certain Costs Incurred in a Restructuring)," and requires that a liability for a cost associated with an exit or disposal activity be recognized when the liability is incurred. Such liabilities should be recorded at fair value and updated for any changes in the fair value each period. The company adopted this statement effective January 1, 2003, and its adoption did not have a material effect on the Consolidated Financial Statements. Going forward, the impact of SFAS No. 146 on the company's Consolidated Financial Statements will depend upon the timing of and facts underlying any future exit or disposal activity.
In June 2001, the FASB issued SFAS No. 143, "Accounting for Asset Retirement Obligations." SFAS No. 143 provides accounting and reporting guidance for obligations associated with the retirement of long-lived assets that result from the acquisition, construction or normal operations of a long-lived asset. The standard was effective January 1, 2003 and its adoption did not have a material effect on the Consolidated Financial Statements.
8
5. The changes in the carrying amount of goodwill, by external reporting segment, for the period ended September 30, 2003, are as follows:
|
Segment |
Balance 1/1/03 |
Goodwill Additions |
Purchase Price Adjustments |
Divestitures |
Foreign Currency Translation Adjustments |
Balance 9/30/03 |
||||||||||||
|---|---|---|---|---|---|---|---|---|---|---|---|---|---|---|---|---|---|---|
|
(Dollars in millions) |
|
|
|
|
|
|
||||||||||||
| Global Services | $ | 2,926 | $ | 197* | $ | 717 | $ | (6 | ) | $ | 175 | $ | 4,009 | |||||
| Systems Group | 137 | | | | | 137 | ||||||||||||
| Personal Systems Group | 13 | | | | | 13 | ||||||||||||
| Technology Group | 24 | | | | | 24 | ||||||||||||
| Software | 1,015 | 1,424 | (26 | ) | | 1 | 2,414 | |||||||||||
| Global Financing | | | | | | | ||||||||||||
| Enterprise Investments | | | | | | | ||||||||||||
| Total | $ | 4,115 | $ | 1,621 | $ | 691 | $ | (6 | ) | $ | 176 | $ | 6,597 | |||||
There were no goodwill impairment losses recorded during the first nine months of 2003.
The following schedule details the company's intangible asset balances by major asset class:
|
Intangible asset class |
Gross Carrying Amount |
Accumulated Amortization |
Net Carrying Amount at 9/30/03 |
||||||
|---|---|---|---|---|---|---|---|---|---|
|
(Dollars in millions) |
|
|
|
||||||
| Customer-related | $ | 703 | $ | (220 | ) | $ | 483 | ||
| Completed technology | 434 | (181 | ) | 253 | |||||
| Strategic alliances | 118 | (32 | ) | 86 | |||||
| Patents/Trademarks | 98 | (61 | ) | 37 | |||||
| Other(a) | 113 | (35 | ) | 78 | |||||
| Total | $ | 1,466 | $ | (529 | ) | $ | 937 | ||
The net carrying amount of intangible assets increased $200 million during the first nine months of 2003, primarily due to the acquisition of Rational Software Corp. (Rational) partially offset by amortization of existing intangible asset balances.
The aggregate intangible amortization expense was $104 million and $256 million for the third quarter and first nine months of 2003, respectively, versus $38 million and $118 million for the third quarter and first nine months of 2002.
9
Future amortization expense relating to intangible assets currently recorded in the Consolidated Statement of Financial Position is estimated to be the following at September 30, 2003:
| 2003 (fourth quarter) | $ | 91 million | |
| 2004 | $ | 322 million | |
| 2005 | $ | 246 million | |
| 2006 | $ | 126 million | |
| 2007 | $ | 73 million |
6. As described in the company's 2002 Annual Report and in connection with the acquisition of PricewaterhouseCoopers' (PwC) consulting business, the original recorded amount of net tangible assets transferred to IBM from PwC was approximately $454 million greater than the estimated amount originally paid by the company in 2002. The amount of net tangible assets transferred was subject to a review process between both parties under terms of the agreem ent. As a result of the review process and other adjustments, the company paid an additional amount to PwC of $397 million in July 2003. Substantially all of the payment was accounted for as incremental goodwill due to the fact that the net tangible assets recorded by IBM as of October 1, 2002 included the incremental amount.
The table below presents the updated allocation of the purchase price related to the company's 2002 acquisition of PwC's consulting business.
|
|
Amortization Life (yrs.) |
Original Amount Disclosed in 2002 Annual Report |
Purchase Adjustments* |
Total Allocation |
|||||||||
|---|---|---|---|---|---|---|---|---|---|---|---|---|---|
|
(Dollars in millions) |
|
|
|
|
|||||||||
| Current assets | $ | 1,197 | $ | (239 | ) | $ | 958 | ||||||
| Fixed assets/non-current | 199 | (37 | ) | 162 | |||||||||
| Intangible assets: | |||||||||||||
| Goodwill | N/A | 2,461 | 711 | 3,172 | |||||||||
| Strategic alliances | 5 | 103 | | 103 | |||||||||
| Non-contractual customer relationships | 4 to 7 | 131 | | 131 | |||||||||
| Customer contracts/backlog | 3 to 5 | 82 | | 82 | |||||||||
| Other identifiable intangible assets | 3 to 5 | 95 | | 95 | |||||||||
| Total assets acquired | 4,268 | 435 | 4,703 | ||||||||||
| Current liabilities | (560 | ) | (36 | ) | (596 | ) | |||||||
Non-current liabilities |
(234 |
) |
15 |
(219 |
) |
||||||||
| Total liabilities assumed | (794 | ) | (21 | ) | (815 | ) | |||||||
| Total purchase price | $ | 3,474 | $ | 414 | $ | 3,888 | |||||||
10
7. On February 21, 2003, the company purchased the outstanding stock of Rational for $2,095 million in cash. Rational provides open, industry standard tools, best practices and services for developing business applications and building software products and systems. The Rational acquisition provides the company with the ability to offer a complete development environment for customers. The transaction was completed on February 21, 2003, from which time the results of this acquisition were included in the company's Consolidated Financial Statements. The company merged Rational's business operations and employees into the IBM Software Group as a new division and brand.
The table below presents the updated allocation of the purchase price related to the company's 2003 acquisition of Rational.
|
|
Amortization Life (yrs.) |
Original Amount Disclosed in First Quarter 2003 Form 10-Q |
Purchase Adjustments* |
Total Allocation |
|||||||||
|---|---|---|---|---|---|---|---|---|---|---|---|---|---|
|
(Dollars in millions) |
|
|
|
|
|||||||||
| Current assets | $ | 1,179 | $ | 52 | $ | 1,231 | |||||||
| Fixed assets/non-current | 83 | 28 | 111 | ||||||||||
| Intangible assets: | |||||||||||||
| Completed technology | 3 | 229 | | 229 | |||||||||
| Customer relationships | 7 | 180 | | 180 | |||||||||
| Other identifiable intangible assets | 2-5 | 32 | | 32 | |||||||||
| Goodwill | N/A | 1,365 | (30 | ) | 1,335 | ||||||||
| In-process research & development | 9 | | 9 | ||||||||||
| Total assets acquired | 3,077 | 50 | 3,127 | ||||||||||
Current liabilities |
(347 |
) |
(80 |
) |
(427 |
) |
|||||||
| Non-current liabilities | (638 | ) | 33 | (605 | ) | ||||||||
| Total liabilities assumed | (985 | ) | (47 | ) | (1,032 | ) | |||||||
| Total purchase price | $ | 2,092 | $ | 3 | $ | 2,095 | |||||||
The acquisition was accounted for as a purchase transaction, and accordingly, the assets and liabilities of the acquired entity were recorded at their estimated fair values at the date of the acquisition. The primary items that generated the goodwill are the value of the synergies between Rational and IBM and the acquired assembled workforce, neither of which qualify as an amortizable intangible asset. None of the goodwill is deductible for tax purposes. The overall weighted-average life of the identified
11
intangible assets acquired in the purchase of Rational that are subject to amortization is 4.7 years. With the exception of goodwill, these identified intangible assets will be amortized on a straight-line basis over their useful lives. Goodwill of $1,335 million has been assigned to the Software segment. The company recorded a pretax charge of $9 million for in-process research and development. This amount, which reflects the relative value and contribution of the acquired research and development to the company's existing research or product lines, was charged to research, development, and engineering expense on the company's Consolidated Statement of Earnings.
As outlined above, the gross purchase price was $2,095 million. However, as part of the transaction, IBM assumed cash and cash equivalents held in Rational of $1,053 million, resulting in a net cash payment of $1,042 million. In addition, the company assumed $500 million in outstanding convertible debt. The convertible debt was subsequently called on March 26, 2003.
8. During the second quarter of 2002, the company executed several actions in its Microelectronics Division. The Microelectronics Division is within the company's Technology segment. These actions are the result of the company's announced intentions to refocus and direct its microelectronics business to the high-end foundry, Application Specific Integrated Circuit (ASICs) and standard products, while creating its new Engineering and Technology Services Division. A major part of the actions relate to a significant reduction in the company's manufacturing capacity for aluminum technology.
In addition, the company rebalanced both its workforce and leased space resources primarily in response to the recent decline in corporate spending on technology-related services.
12
The following table summarizes the significant components of these actions:
|
|
Liability recorded in Second Quarter 2002 |
Liability as of 12/31/02 |
Payments |
Other Adjustments+ |
Liability as of 9/30/03 |
||||||||||||
|---|---|---|---|---|---|---|---|---|---|---|---|---|---|---|---|---|---|
|
(Dollars in millions) |
|
|
|
|
|
||||||||||||
| Microelectronics: | |||||||||||||||||
| Machinery/ equipment: | |||||||||||||||||
| Current | $ | 67 | (A)* | $ | 42 | $ | 32 | $ | 10 | $ | 20 | ||||||
| Non-current | 33 | (A)** | 17 | | (12 | ) | 5 | ||||||||||
| Non cancelable purchase commitments: | |||||||||||||||||
| Current | 35 | (B)* | 24 | 20 | 14 | 18 | |||||||||||
| Non-current | 25 | (B)** | 13 | | (13 | ) | | ||||||||||
| Employee terminations: | |||||||||||||||||
| Current | 44 | (C)* | 1 | 1 | | | |||||||||||
| Non-current | 1 | (C)** | 1 | | | 1 | |||||||||||
Vacant Space: |
|||||||||||||||||
| Current | 5 | (D)* | 5 | 4 | 2 | 3 | |||||||||||
| Non-current | 6 | (D)** | 5 | | (1 | ) | 4 | ||||||||||
Sale of Endicott facility |
2 |
(E)* |
10 |
6 |
(2 |
) |
2 |
||||||||||
| Sale of certain operations | 10 | (F)* | 1 | 1 | | | |||||||||||
|
Global services and other: |
|||||||||||||||||
| Employee terminations: | |||||||||||||||||
| Current | 671 | (G)* | 143 | 108 | (9 | ) | 26 | ||||||||||
| Non-current | 51 | (G)** | 78 | | (11 | ) | 67 | ||||||||||
| Vacant space: | |||||||||||||||||
| Current | 57 | (H)* | 44 | 61 | 57 | 40 | |||||||||||
| Non-current | 94 | (H)** | 86 | | (46 | ) | 40 | ||||||||||
| $ | 1,101 | $ | 470 | $ | 233 | $ | (11 | ) | $ | 226 | |||||||
(A) This amount is comprised of costs incurred to remove abandoned capital assets and the remaining lease payments for leased equipment that was abandoned in the second quarter of 2002. The liability at September 30, 2003 relates to the remaining lease payments, which will continue through 2005.
(B) The company is subject to certain noncancelable purchase commitments. As a result of the decision to significantly reduce aluminum capacity, the company no longer has a need for certain materials subject to these agreements. The required future payments for materials no longer needed under these contracts are expected to be paid through June 30, 2004.
13
(C) The workforce reductions represent 1,400 people, all of whom left the company as of June 30, 2003. The remaining liability relates to terminated employees who were granted annual payments to supplement their income in certain countries. Depending on individual country legal requirements, these required payments will continue until the former employee begins receiving pension benefits or dies.
(D) The space accruals are for ongoing obligations to pay rent for vacant space that could not be sublet or space that was sublet at rates lower than the committed lease arrangements. The length of these obligations varies by lease with the longest extending through 2006.
(E) As part of the company's strategic realignment of its Microelectronics business to exit the manufacture and sale of certain products and component technologies, the company signed an agreement in the second quarter of 2002 to sell its interconnect products operations in Endicott to Endicott Interconnect Technologies, Inc. (EIT). As a result of this transaction, the company incurred a $223 million loss on sale, primarily relating to the land, buildings, machinery and equipment. The transaction closed in the fourth quarter of 2002. The company entered into a limited supply agreement with EIT for future products, and it will also lease back, at fair market value rental rates, approximately one third of the Endicott campus' square footage for operations outside the interconnect OEM business.
(F) As part of the strategic realignment of the company's Microelectronics business, the company agreed to sell certain assets and liabilities comprising its Mylex business to LSI Logic Corporation and the company sold part of its wireless phone chipset operations to TriQuint Semiconductor, Inc. in June 2002. The Mylex transaction was completed in August 2002. There was a loss of $74 million for the Mylex transaction and a realized gain of $11 million for the chipset sale.
(G) The majority of the workforce reductions relate to the company's Global Services business. The workforce reductions represent 14,213 people, all of whom left the company as of June 30, 2003. See C above for information on the remaining liability.
(H) The space accruals are for ongoing obligations to pay rent for vacant space that could not be sublet or space that was sublet at rates lower than the committed lease arrangements. This space relates primarily to workforce dynamics in the Global Services business and the downturn in corporate technology spending on services. The length of these obligations varies by lease with the longest extending through 2016.
14
During the fourth quarter of 2002, the company executed several actions related to the company's acquisition of the PwC consulting business. Specifically, the company rebalanced both its workforce and its leased space resources. The following table summarizes the significant components of these actions:
|
|
Liability recorded in the Fourth Quarter 2002 |
Liability as of 12/31/02 |
Payments |
Other Adjustments+ |
Liability as of 9/30/03 |
|||||||||||
|---|---|---|---|---|---|---|---|---|---|---|---|---|---|---|---|---|
|
(Dollars in millions) |
|
|
|
|
|
|||||||||||
| Workforce: | ||||||||||||||||
| Current | $ | 296(A | )* | $ | 278 | $ | 225 | $ | (10 | ) | $ | 43 | ||||
| Non-current | 57(A | )** | 57 | | 9 | 66 | ||||||||||
| Vacant space: | ||||||||||||||||
| Current | 68(B | )* | 67 | 30 | 7 | 44 | ||||||||||
| Non-current | 180(B | )** | 180 | | (16 | ) | 164 | |||||||||
| $ | 601 | $ | 582 | $ | 255 | $ | (10 | ) | $ | 317 | ||||||
15
The following table provides the liability balances for the second -quarter and fourth-quarter 2002 actions discussed above, the 2002 actions associated with the hard disk drive (HDD) business for reductions in workforce, manufacturing capacity and space, actions in 1999, and actions that took place through 1993.
|
|
Liability as of 12/31/2002 |
Payments |
Other Adj.(d) |
Liability as of 9/30/2003 |
||||||||||
|---|---|---|---|---|---|---|---|---|---|---|---|---|---|---|
|
(Dollars in millions) |
|
|
|
|
||||||||||
| Current: | ||||||||||||||
| Workforce (a) | $ | 647 | $ | 496 | $ | 62 | $ | 213 | ||||||
| Space (b) | 181 | 177 | 122 | 126 | ||||||||||
| Other (c) | 115 | 76 | 8 | 47 | ||||||||||
| Total | $ | 943 | $ | 749 | $ | 192 | $ | 386* | ||||||
| Non-current: | ||||||||||||||
| Workforce (a) | $ | 574 | $ | | $ | 11 | $ | 585 | ||||||
| Space (b) | 419 | | (97 | ) | 322 | |||||||||
| Other (c) | 31 | | (26 | ) | 5 | |||||||||
| Total | $ | 1,024 | | $ | (112 | ) | $ | 912 | ** | |||||
9. The tables on pages 49 through 52 of this Form 10-Q reflect the results of the company's segments consistent with its management system used by the company's chief operating decision maker. These results are not necessarily a depiction that is in conformity with generally accepted accounting principles (GAAP). For example, employee retirement plan costs are developed using actuarial assumptions on a country-by-country basis and allocated to the segments on headcount. A different result could occur for any segment if actuarial assumptions unique to
16
each segment were used. Performance measurements are based on income before income taxes (pre-tax income). These results are used, in part, by management, both in evaluating the performance of and in allocating resources to each of the segments.
10. The company's extended lines of credit include unused amounts of $3,019 million and $3,482 million at September 30, 2003 and December 31, 2002, respectively. A portion of these amounts was available to the company's business partners to support their working capital needs. In addition, the company committed to provide future financing to its customers in connection with customer purchase agreements for approximately $313 million and $288 million at September 30, 2003 and December 31, 2002, respectively.
See note O on page 88 of the company's 2002 Annual Report and the Retirement-Related Benefits section of this Form 10-Q on page 29 for discussion of claims and suits that arise from time to time in the ordinary course of the company's business.
The company has applied the disclosure provisions of FIN 45 to its agreements that contain guarantee or indemnification clauses. These disclosure provisions expand those required by FASB Statement No. 5, "Accounting for Contingencies", by requiring a guarantor to disclose certain types of guarantees, even if the likelihood of requiring the guarantor's performance is remote. The following is a description of arrangements in which the company is the guarantor.
The company is a party to a variety of agreements pursuant to which it may be obligated to indemnify the other party with respect to certain matters. Typically, these obligations arise in the context of contracts entered into by the company, under which the company customarily agrees to hold the other party harmless against losses arising from a breach of representations and covenants related to such matters as title to the assets sold, certain intellectual property rights, specified environmental matters, and certain income taxes. In each of these circumstances, payment by the company is conditioned on the other party making an adverse claim pursuant to the procedures specified in the particular contract, which procedures typically allow the company to challenge the other party's claims. Further, the company's obligations under these agreements may be limited in terms of time and/or amount, and in some instances, the company may have recourse against third parties for certain payments made by the company.
It is not possible to predict the maximum potential amount of future payments under these or similar agreements, due to the conditional nature of the company's obligations and the unique facts and circumstances involved in each particular agreement. Historically, payments made by the company under these agreements did not have a material effect on the company's business, financial condition or results of operations. The company believes that if it were to incur a loss in any of these matters, such loss should not have a material effect on the company's business, financial condition or results of operations.
In addition, the company guarantees certain loans and financial commitments. The maximum potential future payment under these financial guarantees was $84 million and $126 million at September 30, 2003 and December 31, 2002, respectively. These amounts include a limited guarantee of $45 million and $69 million associated with the company's loans receivable securitization program at September 30, 2003 and December 31, 2002, respectively.
17
Changes in the company's warranty liability balance are illustrated in the following table:
|
|
2003 |
2002 |
|||||
|---|---|---|---|---|---|---|---|
|
(Dollars in millions) |
|
|
|||||
| Balance at January 1 | $ | 614 | $ | 520 | |||
| Current period accruals | 640 | 556 | |||||
| Accrual adjustments to reflect actual experience | 58 | 112 | |||||
| Charges incurred | (637 | ) | (660 | ) | |||
| Balance at September 30 | $ | 675 | $ | 528 | |||
ITEM 2.
MANAGEMENT'S DISCUSSION AND ANALYSIS
OF RESULTS OF OPERATIONS AND FINANCIAL CONDITION
FOR THE THREE AND NINE MONTHS ENDED SEPTEMBER 30, 2003
Third quarter revenue increased 8.6 percent (4 percent at constant currency) from the prior year third quarter. The company earned $1.8 billion of income from continuing operations or $1.02 per diluted common share. Current IT demand is good, but not robust, and these results reflect the breadth of the company's offerings and its annuity-like core businesses, which represent about 50 percent of the company's profit. Large enterprise customers remain cautious with capital spending, yet the company continues to gain a competitive advantage from its ebusiness on demand strategy.
For total operations, net income for the third quarter and first nine months of 2003, including discontinued operations, was $1,785 million and $4,874 million, respectively, (including a loss of $23 million in the first nine months of 2003 for discontinued operations) or $1.02 and $2.77, respectively, in earnings per diluted common share. This compares to total operations net income for the third quarter and first nine months of 2002, including discontinued operations, of $1,313 million and $2,561 million, respectively, (including a loss of $381 million and $862 million, respectively, for discontinued operations) or $0.76 and $1.47, respectively, in earnings per diluted common shares.
18
Results of Continuing Operations
|
|
Three Months Ended September 30, |
Nine Months Ended September 30, |
||||||||||||
|---|---|---|---|---|---|---|---|---|---|---|---|---|---|---|
|
|
2003 |
2002 |
2003 |
2002 |
||||||||||
|
(Dollars in millions) |
|
|
|
|
||||||||||
| Revenue | $ | 21,522 | $ | 19,821 | $ | 63,218 | $ | 57,502 | ||||||
| Cost | 13,710 | 12,498 | 40,175 | 36,409 | ||||||||||
| Gross profit | $ | 7,812 | $ | 7,323 | $ | 23,043 | $ | 21,093 | ||||||
| Gross profit margin | 36.3 | % | 36.9 | % | 36. 4 | % | 36.7 | % | ||||||
| Income from continuing Operations | $ | 1,785 | $ | 1,694 | $ | 4,897 | $ | 3,423 | ||||||
| Earnings per share of common stock from continuing operations: | ||||||||||||||
| Assuming dilution | $ | 1.02 | $ | 0.99 | $ | 2.78 | $ | 1.97 | ||||||
| Basic | $ | 1.04 | $ | 1.00 | $ | 2.84 | $ | 2.01 | ||||||
The amount of shares actually outstanding at September 30, 2003 was 1,720.4 million shares.
The weighted average number of common shares outstanding assuming dilution was higher by 44.7 million than the third quarter of 2002 and by 27.8 million than the first nine months of 2002, primarily as a result of the company's use of common shares to fund a portion of its fourth quarter 2002 contribution to the (U.S.) IBM Personal Pension Plan (PPP), slightly offset by the company's common share repurchase program. The weighted average number of shares assuming dilution was 1,756.4 million and 1,711.7 million in the third quarter of 2003 and 2002, respectively, and 1,759.5 million and 1,731.7 million for the first nine months of 2003 and 2002, respectively.
Throughout this report, t he reference to constant currency is made so that a segment can be viewed without the impacts of changing foreign currency exchange rates and therefore facilitates a comparative view of business growth. In the third quarter of 2003 and the first nine months of 2003, the U.S. dollar generally weakened against other currencies, so growth at constant currency exchange rates was lower than growth at actual currency exchange rates.
Revenue for the three months ended September 30, 2003 increased 8.6 percent (4 percent at constant currency) from the same period last year. The growth in revenue was primarily due to improved performance in Systems Group server and storage products as well as increased revenue as a result of recent acquisitions. These increases were partially offset by lower revenue from Technology Group products.
In the Americas, third-quarter revenue was $9.4 billion, an increase of 4.3 percent (3 percent at constant currency) from the same period last year. Revenue from Europe/Middle East/Africa was $6.8 billion, up 18.8 percent (7 percent at constant currency). Asia-Pacific revenue increased 10.9 percent (7 percent at constant currency) to $4.8 billion. OEM revenue across all geographies was $643 million, a 25.9 percent decrease (26 percent at constant currency) compared with the third quarter of 2002.
The company's total gross profit margin was 36.3 percent in the third quarter of 2003, a decline of 0.6 points from the same period of 2002.
19
In the third quarter of 2003, total expense and other income was $5.3 billion, an increase of 7.0 percent from the third quarter of 2002. Selling, general and administrative expense (SG&A) was $4.3 billion, an increase of 7.9 percent year over year, due primarily to higher expenses associated with recent acquisitions. Research, development and engineering expense (RD&E) increased 7.7 percent to $1.3 billion compared to the same period of 2002, primarily driven by the software segment acquisitions this year. Intellectual property and custom development income increased, and Other (income) and expense had a negative impact versus the same period last year primarily due to foreign currency transaction losses.
The company's effective tax rate on continuing operations in the third quarter of 2003 was 30.0 percent versus 29.5 percent in the third quarter of 2002.
Global Services
|
|
Three Months Ended September 30, |
Nine Months Ended September 30, |
|||||||||||
|---|---|---|---|---|---|---|---|---|---|---|---|---|---|
|
|
2003 |
2002 |
2003 |
2002 |
|||||||||
|
(Dollars in millions) |
|
||||||||||||
| Total revenue | $ | 10,383 | $ | 8,895 | $ | 31,187 | $ | 25,785 | |||||
| Total cost | 7,782 | 6,540 | 23,298 | 19,015 | |||||||||
| Gross profit | $ | 2,601 | $ | 2,355 | $ | 7,889 | $ | 6, 770 | |||||
| Gross profit margin | 25.1 | % | 26.5 | % | 25.3 | % | 26.3 | % | |||||
Global Services revenue, including maintenance, increased 16.7 percent (11 percent at constant currency) and 21.0 percent (13 percent at constant currency), respectively, in the third quarter and first nine months of 2003, when compared to the same periods of 2002. Global Services revenue, excluding maintenance, increased 18.5 percent (13 percent at constant currency) and 23.3 percent (16 percent at constant currency), respectively, for the third quarter and first nine months of 2003 versus comparable periods of last year. Maintenance revenue increased 6.6 percent to $1,371 million (1 percent at constant currency) and 7.3 percent to $4,031 million (1 percent at constant currency), respectively, when compared to the same periods in 2002.
Strategic Outsourcing Services (SO) revenue increased 13.0 percent to $4,288 million (8 percent at constant currency) in the third quarter of 2003 versus last year. SO revenue increased 12.7 percent to $12,480 million (6 percent at constant currency) for the first nine months of 2003 versus the same period last year. Increases in SO revenue reflect the impact of new signings. E-business hosting, an SO offering that provides Web hosting infrastructure and application management as an Internet service, continued its strong pattern of revenue growth. Business Consulting Services (BCS) revenue increased 52.7 percent to $3,102 million (45 percent at constant currency) in the third quarter of 2003 versus the same period in 2002. BCS revenue increased 60.6 percent to $9,521 million (50 percent at constant currency) for the first nine months of 2003 versus the same period in 2002. These increases were primarily the result of the acquisition of PwC's consulting business in the fourth quarter of 2002. Integrated Technology Services (ITS) revenue, excluding maintenance, decreased 9.0 percent to $1,622 million (declined 14 percent at constant currency) in the third quarter of 2003 versus the third quarter of 2002. During the third quarter of 2003, the company changed its reporting for certain OEM hardware sales to IBM customers
20
from gross to net revenue treatment, based upon a review of the terms of these sales. The company determined that the agent-like characteristics of these transactions were more appropriately recorded on a net revenue basis. As a result, revenue and cost were reduced by $206 million in the quarter, of which $135 million related to January through June 2003 activity. This change had no impact on the company's gross profit, net income or cash flows. The corresponding amounts in the prior year periods were roughly the same. Due to the size of the amounts involved, the prior year amounts were not adjusted. ITS revenue, excluding maintenance, increased 2.7 percent to $5,155 million (declined 4 percent at constant currency) for the first nine months of 2003 versus the first nine months of 2002. ITS revenue for the first nine months of 2003 includes the $206 million adjustment discussed above.
The company signed $15.4 billion in services contracts in the third quarter of 2003. The signings included 14 contracts each in excess of $100 million, of which, 3 contracts are over $1 billion. The estimated services backlog including Strategic Outsourcing, BCS, ITS and Maintenance was $115 billion at September 30, 2003. Backlog estimates are subject to change and are affected by several factors, including changes in scope of contracts (mainly long-term contracts), periodic revalidations, and currency assumptions used to approximate constant currency.
Global Services gross profit dollars increased 10.5 percent and 16.5 percent, respectively, for the third quarter and first nine months of 2003 versus the same periods last year. These increases were primarily a result of the increased revenue as described above. The gross profit margins declined 1.4 percentage points and 1.0 percentage points for the third quarter and first nine months, respectively, of 2003 when compared to the prior year periods. These declines in gross profit margin were attributable to the changing revenue mix toward the lower margin BCS business and lower SO margins due to early stages of new contracts and other contractual changes.
Looking forward, the pipeline of opportunity at the end of the third quarter is greater than at the end of the second quarter, particularly in the company's Business Transformation Outsourcing business.
Hardware
|
|
Three Months Ended September 30, |
Nine Months Ended September 30, |
|||||||||||
|---|---|---|---|---|---|---|---|---|---|---|---|---|---|
|
|
2003 |
2002 |
2003 |
2002 |
|||||||||
|
(Dollars in millions) |
|
||||||||||||
| Total revenue | $ | 6,697 | $ | 6,764 | $ | 19,118 | $ | 19,320 | |||||
| Total cost | 5,011 | 4,957 | 14,104 | 14,420 | |||||||||
| Gross profit | $ | 1,686 | $ | 1,807 | $ | 5,014 | $ | 4,900 | |||||
| Gross profit margin | 25.2 | % | 26.7 | % | 26.2 | % | 25.4 | % | |||||
Revenue from hardware decreased 1.0 percent (5 percent at constant currency) and decreased 1.0 percent (6 percent at constant currency), respectively, for the third quarter and first nine months of 2003, versus the same periods in 2002.
21
Systems Group revenue increased 5.6 percent to $3,199 million (flat at constant currency) in the third quarter of 2003 versus the same period last year. Systems Group revenue increased 7.3 percent to $9,066 million (1 percent at constant currency) for the first nine months of 2003 versus the same period last year. Revenue and share growth continued in the pSeries UNIX servers in both periods resulting from strength in both high-end and entry servers, although the company did experience supply constraints in some entry models in the third quarter. The xSeries server revenue increased in the third quarter and first nine months of 2003, versus the same periods of 2002, due to growth in sales of high-volume servers supported by strong growth in blades. Revenue from iSeries servers increased in the third quarter and first nine months of 2003 versus prior year periods as customers are utilizing the iSeries ability to provide on demand computing and integration. Revenue from zSeries mainframes increased in the third quarter of 2003 and declined for the first nine months of 2003 versus the same periods of last year. The total deliveries of zSeries computing power as measured in MIPS (millions of instructions per second) increased over 30 percent in the third quarter of 2003 compared to the third quarter of 2002.
Storage Systems revenue increased in the third quarter and the first nine months of 2003 versus the same periods of last year. Enterprise disk storage (Shark) revenue declined in the third quarter of 2003 as compared to the third quarter of 2002, which benefited from the successful launch of the Model 800. Midrange disk storage revenue increased in the third quarter of 2003 versus the same period of 2002 as a result of strong growth of FAStT product revenue. In addition, tape products revenue improved and grew in the third quarter of 2003 versus the same period in 2002 as midrange tape products continued to show growth. The revenue increase for the first nine months of 2003 versus the first nine months of 2002 was driven by increased revenue for enterprise disk storage (Shark), FAStT and midrange tape products partially offset by lower high-end tape products revenue.
Personal Systems Group revenue increased 2.2 percent to $2,796 million (declined 2 percent at constant currency) in the third quarter of 2003 versus the same period in 2002. Personal Systems Group revenue declined 1.7 percent to $7,909 million (7 percent at constant currency) for the first nine months of 2003 versus the same period in 2002. The revenue increase in the third quarter of 2003 was driven by higher ThinkPad revenue partially offset by lower average selling prices of Desktop personal computers. Retail store solutions and printing systems products revenue declined in the third quarter of 2003 versus the third quarter of 2002. The decline in Personal Systems Group revenue for the first nine months of 2003 was driven by lower personal computer, retail store solutions and printing systems products revenue. The decrease in personal computer revenue primarily reflects a reduction in prices due to decreasing commodity costs, which more than offset the positive impact from increased volumes.
Technology Group revenue declined 33.1 percent to $695 million (33 percent at constant currency) in the third quarter of 2003 versus the comparable period in 2002. Technology Group revenue declined 29.5 percent to $2,096 million (30 percent at constant currency) for the first nine months of 2003 versus the comparable period of 2002. These declines were driven by actions taken in 2002 to refocus and direct its microelectronics business to the high-end foundry, ASICs and standard products, while creating a new technology services business. These actions included the divestiture of multiple non-core businesses. The impact of the 2002 exit of the card assembly and test business contributed to approximately half of the Technology Group decline in
22
revenue. Third quarter 2003 sales were also sluggish due to demand weakness from certain OEM customers. The company continues to monitor projected customer demand and will bring new tools on-line for the new 300 millimeter facility as needed. Engineering & Technology Services revenue increased over 30 percent in the third quarter of 2003 versus the second quarter of 2003 and achieved its largest quarter of signings.
Hardware gross profit dollars for the third quarter of 2003 decreased 6.7 percent and gross profit dollars for the first nine months of 2003 increased 2.3 percent from comparable periods in 2002. The hardware gross profit margin decreased 1.5 percentage points for the third quarter of 2003 and increased 0.8 percentage points for the first nine months of 2003 versus the prior year periods.
The decrease in gross profit dollars and gross profit margin in the third quarter of 2003 versus the third quarter of 2002 was primarily a result of the low gross margins in the Technology Group and lower margins for all the Systems Group products except xSeries servers. In addition, personal computer margins were lower primarily due to increased warranty costs associated with Desktop products. Pricing pressures continued to impact the Hardware gross profit margin across most hardware products, especially in the Asia Pacific region during the third quarter of 2003.
The increase in Hardware gross profit dollars and gross profit margin in the first nine months of 2003 versus the first nine months of 2002 was primarily driven by Systems Group and personal computers. Systems Group gross profit margins increased due to improvements across most Systems Group products, as a result of lower impacts for warranty and inventory losses. Personal computer gross profit margin increased as a result of reduced costs relating to recent supply chain initiatives and a shift in revenue from desktop to mobile products, which have a higher gross profit. Although hardware gross profit dollars and margin improved for the nine months of 2003, the growth rate increased at a slower pace due to the lower year-to-year third quarter results.
Looking forward, the zSeries demand should benefit from a full quarter of new technology availability on the z990 products including secure-key cryptography, as well as additional processors, channels, and memory (up to 32 processors, 512 channels, and 256 gigabytes of memory: all doubling the amounts currently available).
Software
|
|
Three Months Ended September 30, |
Nine Months Ended September 30, |
|||||||||||
|---|---|---|---|---|---|---|---|---|---|---|---|---|---|
|
|
2003 |
2002 |
2003 |
2002 |
|||||||||
|
(Dollars in millions) |
|
||||||||||||
| Total revenue | $ | 3,461 | $ | 3,110 | $ | 10,061 | $ | 9,273 | |||||
| Total cost | 491 | 500 | 1,452 | 1,549 | |||||||||
| Gross profit | $ | 2,970 | $ | 2,610 | $ | 8,609 | $ | 7,724 | |||||
| Gross profit margin | 85.8 | % | 83.9 | % | 85.6 | % | 83.3 | % | |||||
23
Revenue from software increased 11.3 percent (5 percent at constant currency) and 8.5 percent (2 percent at constant currency), respectively, versus the third quarter and first nine months of 2002. The company's middleware brands, which include DB2 database software, WebSphere (facilitates customers' ability to manage a wide variety of business processes through the Web), Tivoli (enables customers to centrally manage and efficiently utilize their network and storage), Lotus (increases customers' ability to communicate, collaborate and learn in an effective manner), and Rational (comprehensive software development tools), increased revenue 14 percent to $2,709 million (8 percent at constant currency) in the third quarter of 2003 compared to the same period in 2002. Middleware revenue increased 10 percent to $7,837 million (3 percent at constant currency) for the first nine months of 2003 compared to the same period in 2002. Data management software revenue increased in both periods primarily as a result of growth in DB2 sales. Revenue from the WebSphere family of products increased in both periods driven by growth in application development tools and Portals sales. Tivoli revenue increased in both periods as a result of growth in Systems Management, Security and Storage software. Lotus revenue increased in the third quarter and was flat for the first nine months of 2003. The quarterly increase was driven by growth in Messaging software. Rational Software (acquired during the first quarter of 2003) revenue accounted for approximately 37 percent of the third quarter 2003 middleware revenue increase.
Operating-systems software revenue increased 6 percent to $610 million (flat at constant currency) in the third quarter of 2003 and increased 6 percent to $1,767 million (flat at constant currency) for the first nine months of 2003, when compared with prior year periods. The revenue increase in the third quarter and first nine months of 2003 was a result of the positive impact of currency translation.
Software gross profit dollars increased 13.8 percent and 11.5 percent, respectively, for the third quarter and first nine months of 2003 versus the same periods in 2002. The gross profit margin improved 1.9 percentage points and 2.3 percentage points, respectively, for the third quarter and first nine months of 2003 compared to the same periods in 2002. The improvements in gross profit dollars and gross profit margins were primarily driven by the growth in software revenue.
Looking forward, the company will strive to continue the momentum with independent software application vendors and in the small and medium business market.
Enterprise Investments/Other
|
|
Three Months Ended September 30, |
Nine Months Ended September 30, |
|||||||||||
|---|---|---|---|---|---|---|---|---|---|---|---|---|---|
|
|
2003 |
2002 |
2003 |
2002 |
|||||||||
|
(Dollars in millions) |
|
||||||||||||
| Total revenue | $ | 266 | $ | 257 | $ | 760 | $ | 721 | |||||
| Total cost | 124 | 153 | 424 | 381 | |||||||||
| Gross profit | $ | 142 | $ | 104 | $ | 336 | $ | 340 | |||||
| Gross profit margin | 53.4 | % | 40.2 | % | 44.1 | % | 47.2 | % | |||||
Revenue from Enterprise Investments/Other increased 3.0 percent (declined 3 percent at constant currency) and 5.3 percent (declined 2 percent at constant currency), respectively, for the
24
third quarter and first nine months of 2003, versus comparable periods in 2002. These increases were primarily driven by higher revenue from product life-cycle management software.
Enterprise Investments/Other gross profit dollars increased 36.7 percent and decreased 1.5 percent, respectively, in the third quarter and first nine months of 2003 versus the prior year periods. The gross profit margins increased 13.2 percentage points and declined 3.1 percentage points, respectively, for the third quarter and first nine months of 2003 versus the same periods in 2002. The increase in the gross profit dollars and gross profit margin in the third quarter of 2003 versus 2002 was primarily a result of lower overhead costs charged to Other. The decline in the gross profit dollars and gross profit margin for the first nine months of 2003 versus the first nine months of 2002 was primarily the result of foreign currency hedging losses partially offset by lower overhead costs charged to Other.
Expense and other income
|
|
Three Months Ended September 30, |
Nine Months Ended September 30, |
|||||||||||
|---|---|---|---|---|---|---|---|---|---|---|---|---|---|
|
|
2003 |
2002 |
2003 |
2002 |
|||||||||
|
(Dollars in millions) |
|
||||||||||||
| Selling, general and administrative | $ | 4,303 | $ | 3,987 | $ | 12,978 | $ | 13,298 | |||||
| Percentage of revenue | 20.0 | % | 20.1 | % | 20.5 | % | 23.1 | % | |||||
Research, development and engineering |
$ |
1,307 |
$ |
1,213 |
$ |
3,728 |
$ |
3,546 |
|||||
| Percentage of revenue | 6.1 | % | 6.1 | % | 5.9 | % | 6.2 | % | |||||
Intellectual property and custom development (income) |
$ |
(406 |
) |
$ |
(232 |
) |
$ |
(887 |
) |
$ |
(771 |
) |
|
Other (income) and expense |
$ |
26 |
$ |
(83 |
) |
$ |
114 |
$ |
111 |
||||
Interest expense |
$ |
33 |
$ |
34 |
$ |
114 |
$ |
97 |
|||||
| Total expense and other income | $ | 5,263 | $ | 4,919 | $ | 16,047 | $ | 16,281 | |||||
| Percentage of revenue | 24.5 | % | 24.8 | % | 25.4 | % | 28.3 | % | |||||
SG&A expense increased 7.9 percent (4 percent at constant currency) and declined 2.4 percent (6 percent at constant currency), respectively, in the third quarter and first nine months of 2003 versus the same periods in 2002.
The increase in the third quarter of 2003 was primarily a result of the recent acquisitions of PwC's consulting business and Rational, including higher amortization expense from acquired intangible assets. In addition, workforce reductions, which are ongoing reductions and rebalancing that occur each quarter were $86 million for the third quarter of 2003 versus $23 million for the third quarter of 2002. Advertising and promotional expense was $344 million in the third quarter of 2003 versus $334 million in the third quarter of 2002. These increases were partially offset by a lower provision for doubtful accounts of $23 million for the third quarter of 2003 versus $181 million for the third quarter of 2002. This decrease is reflective of the increased provisions the company was recording in prior periods to reflect the general economic
25
environment as well as specific sector items, particularly in the Communications sector. These issues have stabilized and contributed to the lower year-to-year charges.
The decrease in SG&A expense for the first nine months of 2003 versus 2002 was primarily due to the Microelectronics and productivity actions taken in the second quarter of 2002 amounting to $1,250 million. In addition, the provision for doubtful accounts was $159 million for the first nine months of 2003 and $483 million for the same period in 2002. The reasons for this decrease are the same as described above for the third quarter of 2003. These decreases were partially offset by higher expenses associated with recent acquisitions of PwC's consulting business and Rational, including higher amortization expense from acquired intangible assets. Advertising and promotional expense was $1,023 million for the first nine months of 2003 versus $1,014 million for the comparable period of 2002.
Research, development and engineering (RD&E) expense increased 7.7 percent and 5.1 percent, respectively, for the third quarter and first nine months of 2003, when compared with the same periods of 2002. These increases in RD&E expense were driven primarily by the Software Group acquisitions.
Intellectual property and custom development income increased 74.9 percent and 15.0 percent, respectively, for the third quarter and first nine months of 2003 versus the same periods of 2002.
|
|
Three Months Ended September 30, |
Nine Months Ended September 30, |
||||||||||
|---|---|---|---|---|---|---|---|---|---|---|---|---|
|
|
2003 |
2002 |
2003 |
2002 |
||||||||
|
(Dollars in millions) |
|
|
|
|
||||||||
| Sales and other transfers of intellectual property | $ | 243 | $ | 77 | $ | 457 | $ | 334 | ||||
| Licensing/royalty-based fees | 89 | 99 | 227 | 262 | ||||||||
| Custom development income | 74 | 56 | 203 | 175 | ||||||||
| Total | $ | 406 | $ | 232 | $ | 887 | $ | 771 | ||||
Sales and other transfers of intellectual property transactions in the third quarter of 2003 included a number of transactions, none of which exceeded $100 million. The timing and amount of Sales and other transfers of intellectual property may vary significantly from period to period depending upon the timing of new patents and know-how development, timing of divestitures, economic conditions and industry consolidations. The amount of Intellectual property and custom development income has been declining in recent periods and overall, this trend may continue.
Third quarter 2003 Other (income) and expense was $26 million of expense versus $(83) million of income for the third quarter of 2002 and was $114 million of expense for the first nine months of 2003 versus $111 million of expense in the first nine months of 2002.
The increase in Other (income) and expense in the third quarter of 2003 versus the third quarter of 2002 was primarily due to foreign currency transaction losses and lower net gains from certain real estate activities. Currency transaction losses were $85 million in the third
26
quarter of 2003 versus a gain of $15 million in the third quarter of 2002. There were losses of $1 million from certain real estate activities in the third quarter of 2003 versus gains of $53 million in the third quarter of 2002.
The increase in Other (income) and expense for the first nine months of 2003 was primarily due to foreign currency transaction losses of $242 million in 2003 versus gains of $141 million in 2002. In addition, during the first quarter of 2002, the company recorded a gain of $91 million associated with the first quarter 2002 sale of the U.S. and European desktop personal computer manufacturing operations to Sanmina-SCI. This compares with a gain of $15 million in the first quarter of 2003 associated with the first quarter of 2003 sale of certain xSeries server manufacturing and certain mobile personal computer processes to Sanmina-SCI. There were losses of $14 million from certain real estate activities in the first nine months of 2003 versus gains of $55 million in 2002. These items are partially offset by lower capacity and space actions in 2003 of $5 million versus $477 million for the Microelectronics and productivity actions taken in the second quarter of 2002.
Interest expense decreased 3.1 percent for the third quarter and increased 17.5 percent for the first nine months of 2003 when compared to the same periods in 2002. The decline in the third quarter of 2003 was primarily a result of lower levels of average non-Global Financing debt in the third quarter of 2003 versus 2002. Although debt balances have declined from December 31, 2002 to September 30, 2003, year to year interest expense increased for the first nine months of 2003 primarily driven by higher levels of average non-Global Financing debt in the first nine months of 2003 versus the same period in 2002. Cost of financing also includes interest expense as it relates to the Global Financing business. Such interest expense is not included above. See pages 34 through 40 for additional information on Global Financing.
Interest on total borrowings of the company and its subsidiaries, which includes interest expense and Global Financing interest classified as Cost of Global Financing in the Consolidated Statement of Earnings, was $160 million and $512 million for the third quarter and first nine months of 2003, respectively. Of these amounts, the company capitalized $2 million for the third quarter and $11 million for the first nine months of 2003, respectively.
The following table provides the total pre-tax cost/(income) for retirement-related plans for the third quarter of 2003 and 2002 and the first nine months of 2003 and 2002. Cost/(income) amounts are included as an addition to/reduction from, respectively, the company's cost and expense amounts on the Consolidated Statement of Earnings.
27
Retirement-Related Benefits
|
|
Three Months Ended September 30, |
Nine Months Ended September 30, |
||||||||||||
|---|---|---|---|---|---|---|---|---|---|---|---|---|---|---|
|
|
2003 |
2002 |
2003 |
2002 |
||||||||||
|
(Dollars in millions) |
|
|
|
|
||||||||||
| Total retirement-related planscost/(income) | $ | 69 | $ | (73 | ) | $ | 255 | $ | (186 | ) | ||||
| Comprise: | ||||||||||||||
| Defined benefit and contribution pension plans | $ | (10 | ) | $ | (166 | ) | $ | 14 | $ | (463 | ) | |||
| Nonpension postretirement retirement benefits | 79 | 93 | 241 | 277 | ||||||||||
Included in the amounts above, the company realized income of approximately $150 million and $281 million relating to its defined benefit pension plans for the quarter ended September 30, 2003 and 2002, respectively. The comparable amounts for the first nine months of 2003 and 2002 were approximately $430 million and $849 million, respectively.
On January 1, 2003, the company reduced its expected long-term return assumption on the U.S. IBM Personal Pension Plan's ("PPP") assets from 9.5 percent to 8 percent. Actual return on PPP plan assets for the nine months ended September 30, 2003 was $4.3 billion or 12.3 percent. As discussed on page 95 of the 2002 IBM Annual Report, any differences between the actual returns and the expected returns on the pension plan are recognized in the calculation of the pension (income)/cost over five years as provided by the accounting rules. On December 31, 2002, the company lowered its discount rate assumption from 7 percent to 6.75 percent, and lowered its rate of compensation increase from 6 percent to 4 percent. Reductions in these rates also occurred in certain non-US countries. The company voluntarily fully funded the tax-qualified portion of the PPP, as measured by its accumulated benefit obligation, through a contribution of cash and IBM stock totaling $3,963 million in the fourth quarter of 2002. These assumption changes and funding action had the collective net effect of causing the reduction in income from defined benefit pension plans referred to above. These actions are expected to impact pension-related cost trends in a similar pattern for the remaining 2003 period.
Through September 30, 2003, interest rates, as evidenced by long-term high-grade investment instruments, continued to decline. Any corresponding impact to the year-end discount rate will affect the accumulated benefit obligation (ABO) calculation. For each quarter point change in rate, there is a corresponding $1 billion movement in the ABO. Any increased obligation combined with several other factors such as investment performance and normal payments to retirees may result in an unfunded position at year-end on an ABO basis.
If the PPP is in an unfunded position at year-end whereby the ABO exceeds the fair value of the plan assets, the company may make a voluntary contribution to the plan up to the unfunded position as it did in December 2002 or may be required to record a non-cash charge to the stockholders' equity section of the Consolidated Statement of Financial Position.
28
On October 15, 2003, the plaintiffs in Cooper et al. vs. The IBM Personal Pension Plan and IBM Corporation, filed a claim for remedial relief. IBM will respond during the fourth quarter. For further information on this matter, see page 27 of the company's 2003 second quarter Form 10-Q.
Provision for Income Taxes
The company's effective tax rate on continuing operations for the third quarter of 2003 was 30.0 percent versus 29.5 percent for the same period in 2002. The effective tax rate on continuing operations for the first nine months of 2003 was 30.0 percent versus 28.9 percent for the comparable period in 2002. The increase in the rate for the first nine months of 2003 was primarily due to the absence of the tax benefit associated with the second quarter Microelectronics actions taken in 2002. The company's effective tax rate will change period to period based on nonrecurring events as well as recurring factors including the geographical mix of income before taxes, the timing and amount of foreign dividends, state and local taxes, and the interaction of various global tax strategies. In the normal course of business, the company expects that its effective tax rate will approximate 30 percent.
Results of Discontinued Operations
There was no income or loss from discontinued operations in the third quarter of 2003 and a $23 million loss for the first nine months of 2003, versus losses of $381 million and $862 million in the third quarter and first nine months of 2002, respectively. The company's discontinued operations, which comprises the HDD business, was sold to Hitachi, Ltd. on December 31, 2002.
Financial Condition
Dynamics
The assets and debt associated with the company's Global Financing business are a significant part of IBM's financial position. Accordingly, although the financial position amounts appearing below and on pages 30 through 33 are the company's consolidated amounts including Global Financing, to the extent the Global Financing business is a major driver of the Consolidated Financial Position, reference in the narrative section will be made to a separate Global Financing section in this Management Discussion on pages 34 through 40. The amounts appearing in the separate Global Financing section are supplementary data presented to facilitate an understanding of the company's Global Financing business.
Overall
During the first nine months of 2003, the company acquired Rational and continued to invest in RD&E and in fixed assets. The company ended the third quarter with $6,171 million in Cash and cash equivalents and current Marketable securities. Non-Global Financing debt was $299 million at September 30, 2003, a decrease of $1,890 million from December 31, 2002. The non-Global Financing debt-to-capital ratio was 1.2 percent.
29
The company's cash flow from operating, investing and financing activities, as reflected in the Consolidated Statement of Cash Flows on page 5, is summarized in the table below. These amounts include the cash flows associated with the company's Global Financing business.
Cash Flow
|
|
Nine Months Ended September 30, |
|||||||
|---|---|---|---|---|---|---|---|---|
|
|
2003 |
2002 |
||||||
|
(Dollars in millions) |
|
|
||||||
| Net cash provided by (used in) continuing operations: | ||||||||
| Operating activities | $ | 9,817 | $ | 9,415 | ||||
| Investing activities | (4,516 | ) | (3,304 | ) | ||||
| Financing activities | (5,270 | ) | (6,731 | ) | ||||
| Effect of exchange rate changes on cash and cash equivalents | 202 | 94 | ||||||
| Net cash used in discontinued operations | (164 | ) | (588 | ) | ||||
| Net change in cash and cash equivalents | $ | 69 | $ | (1,114 | ) | |||
Net cash provided by operating activities for the first nine months of 2003 was $402 million higher than the first nine months of 2002. This increase was primarily driven by greater income from continuing operations. In addition, Global financing receivableswhich the company manages more as an investment than as part of working capitalcontributed approximately $4,178 million of cash flow during the first nine months of 2003, a decrease of $239 million from the same period in 2002. These contributions to cash flows from operating activities, however, were partially offset by the following items: the decline in Other accounts receivable, such as trade, during the first nine months of 2003 was lower than such decline in the first nine months of 2002 due to better revenue performance in the first nine months of 2003. Inventory grew during the first nine months of 2003 versus a decline in the first nine months of 2002. Increased payments of approximately $411 million for restructuring payments and non-US pension contributions also caused the decrease in cash flows from operating activities.
The increase in cash flows used in investing activities from the first nine months of 2002 to the first nine months of 2003 was primarily attributable to the purchase of Rational. The decrease in the cash used in financing activities from the first nine months of 2002 to the same period of 2003 was primarily the result of lower stock repurchases partially offset by a reduction of debt due to the company's strategy to reduce stock repurchases and instead pay down debt during the first nine months of 2003.
Working Capital
|
|
At September 30, 2003 |
At December 31, 2002 |
||||
|---|---|---|---|---|---|---|
|
(Dollars in millions) |
|
|
||||
| Current assets | $ | 40,566 | $ | 41,652 | ||
| Current liabilities | 32,596 | 34,550 | ||||
| Working capital | $ | 7,970 | $ | 7,102 | ||
Current ratio |
1.24:1 |
1.21:1 |
||||
30
The $1,086 decrease in Current assets was primarily due to declines of $764 million in Short-term financing receivables (see pages 35 through 38) and $435 million in Notes and accounts receivable-trade mainly due to lower revenue volumes in the 2003 third quarter as compared to fourth quarter 2002 volumes.
Current liabilities decreased $1,954 million primarily due to declines of $993 million in Taxes payable and $865 million in Accounts payable and accruals resulting from declines in these balances from typically higher year-end levels.
Investments
The company acquired Rational for $2,095 million. In addition, the company invested $3,728 million in RD&E and capitalized external software costs of $208 million and internal-use software costs of $223 million. The company also invested $3,230 million for Plant, rental machines and other property, a decrease of $220 million from the comparable 2002 period. This decrease was primarily due to lower Microelectronics capital spending as the company drives towards completion of the 300 millimeter facility.
In the first nine months of 2003, the company paid $1,333 million for the repurchase of the company's common shares. At September 30, 2003, the company has remaining authorization to purchase $2,531 million of IBM common shares in the open market from time to time, based on market conditions.
The company funded these investments primarily with cash from operations.
Debt and Equity
The company's funding requirements are continually monitored and strategies are executed to manage the company's overall asset and liability profile. Additionally, the company maintains sufficient flexibility to access global funding sources as needed.
The major rating agencies' ratings of the company's debt securities at September 30, 2003, appear in the table below and remain unchanged from December 31, 2002:
|
|
Standard And Poor's |
Moody's Investors Service |
Fitch Ratings |
|||
|---|---|---|---|---|---|---|
| Senior long-term debt | A+ | A1 | AA- | |||
| Commercial paper | A-1 | Prime-1 | F-1+ |
31
|
|
At September 30, 2003 |
At December 31, 2002 |
|||||
|---|---|---|---|---|---|---|---|
|
(Dollars in millions) |
|
|
|||||
| Total company debt | $ | 23,024 | $ | 26,017 | |||
| Non-global financing debt* | $ | 299 | $ | 2,189 | |||
| Non-global financing debt/capitalization | 1.2 | % | 10.2 | % | |||
The company's non-global financing businesses generate significant cash from ongoing operations and therefore generally do not require a significant amount of debt. Cash flows from operations are these businesses' primary source of funds for future investments.
In September 2003, the company repurchased $380.8 million in outstanding principal amount of its 6.5 percent bonds including accrued and unpaid interest. These bonds were scheduled to mature in January 2028. The net gain recognized in this transaction was not material to the Consolidated Financial Statements.
A review of the company's debt and equity should also consider other contractual obligations and commitments, which are disclosed on page 17. These amounts are summarized in the table below to facilitate a reader's review.
Stockholders' equity increased $4,544 million from December 31, 2002, primarily due to an increase in the company's retained earnings.
Contractual Obligations
|
|
|
Payments Due In |
|||||||||||||
|---|---|---|---|---|---|---|---|---|---|---|---|---|---|---|---|
|
|
Balance as of 9/30/03 |
||||||||||||||
|
|
2003 |
2004-05 |
2006-07 |
After 2007 |
|||||||||||
|
(Dollars in millions) |
|
|
|
|
|
||||||||||
| Long-term debt | $ | 18,936 | $ | 543 | $ | 4,797 | $ | 3,518 | $ | 10,078 | |||||
| Lease commitments | 5,304 | 375 | 2,112 | 1,388 | 1,429 | ||||||||||
Commitments
|
|
|
Amounts Expiring In |
|||||||||||||
|---|---|---|---|---|---|---|---|---|---|---|---|---|---|---|---|
|
|
Balance as of 9/30/03 |
2003 |
2004-05 |
2006-07 |
After 2007 |
||||||||||
|
(Dollars in millions) |
|
|
|
|
|
||||||||||
| Unused lines of credit | $ | 3,019 | $ | 2,580 | $ | 323 | $ | 108 | $ | 8 | |||||
| Other commitments | 313 | 117 | 181 | 15 | | ||||||||||
| Financial guarantees | 84 | 5 | 65 | 8 | 6 | ||||||||||
Unused lines of credit represent amounts available to the company's distributors to support their working capital needs and available lines of credit relating to the company's syndicated loan activities. Other commitments primarily include the company's commitments to provide financing for future purchases of the company's products. Financial guarantees represent guarantees for certain loans and financial commitments that the company had made as of September 30, 2003.
32
Liquidity
The company maintains two global credit facilities totaling $10.0 billion in committed credit lines at September 30, 2003, including an $8.0 billion five-year facility (which expires on May 31, 2006) and a $2.0 billion 364-day facility (which expires on May 27, 2004), as part of its ongoing efforts to ensure appropriate levels of liquidity. As of September 30, 2003, amounts unused and available under these facilities were approximately $9.8 billion. At September 30, 2003, the company also had other mostly uncommitted lines of credit of approximately $7.8 billion, of which approximately $5.5 billion was unused as of September 30, 2003.
As discussed on page 28, the company may make contributions to its pension plans. Any such contributions could be funded from various sources including cash from operations and cash from financing activities.
Any increases in the common share repurchase program in the fourth quarter of 2003 will be funded from operations. The amount of repurchases will be based upon market conditions and the company's liquidity requirements.
The company may from time to time seek to retire certain outstanding indebtedness either through open market repurchases, privately negotiated transactions, tender offers, or otherwise. Such repurchases, if any, will depend on prevailing market conditions, the company's liquidity requirements, and other factors.
Currency Rate Fluctuations
Changes in the relative values of non-U.S. currencies to the U.S. dollar affect the company's results. At September 30, 2003, currency changes resulted in assets and liabilities denominated in local currencies being translated into more dollars than at year-end 2002. The currency rate changes had a favorable effect on revenue growth of approximately 5 percentage points in the third quarter of 2003 and a favorable effect of approximately 2 percentage points in the third quarter of 2002. The currency rate changes had a favorable effect on revenue growth of approximately 6 percentage points for the first nine months of 2003 and had no effect for the first nine months of 2002.
For non-U.S. subsidiaries and branches that operate in U.S. dollars or whose economic environment is highly inflationary, translation adjustments are reflected in results of operations, as required by SFAS No. 52, "Foreign Currency Translation." Generally, the company manages currency risk in these entities by linking prices and contracts to U.S. dollars and entering into foreign currency hedge contracts.
The company uses a variety of financial hedging instruments to limit specific currency risks related to financing transactions and other foreign currency-based transactions. The impact of the company's hedging activities are recorded in Cost, SG&A, and Other (income) and expense in the Consolidated Statement of Earnings. Further discussion of currency and hedging appears in note L, "Derivatives and Hedging Transactions," on pages 84 to 86 of the 2002 IBM Annual Report.
33
Global Financing
Global Financing is a business segment within IBM, but is managed (on an arm's-length basis) and measured as if it were a standalone entity. Accordingly, the information presented in this section is consistent with this separate company view.
Results of Operations
|
|
Three Months Ended September 30, |
Nine Months Ended September 30, |
|||||||||||
|---|---|---|---|---|---|---|---|---|---|---|---|---|---|
|
|
2003 |
2002 |
2003 |
2002 |
|||||||||
|
(Dollars in millions) |
|
|
|
|
|||||||||
| External revenue | $ | 713 | $ | 789 | $ | 2,095 | $ | 2,375 | |||||
| Internal revenue | 266 | 238 | 868 | 617 | |||||||||
| Total revenue | 979 | 1,027 | $ | 2,963 | $ | 2,992 | |||||||
| Total cost | 420 | 449 | 1,293 | 1,289 | |||||||||
| Gross profit | $ | 559 | $ | 578 | $ | 1,670 | $ | 1,703 | |||||
| Gross profit margin | 57.1 | % | 56.3 | % | 56.4 | % | 56.9 | % | |||||
| Pre-tax income | $ | 292 | $ | 218 | $ | 861 | $ | 677 | |||||
| After-tax income | $ | 191 | $ | 143 | $ | 565 | $ | 445 | |||||
| Return on equity* | 22.2 | % | 15.8 | % | 21.8 | % | 16.1 | % | |||||
Global Financing revenue decreased 4.7 percent for the third quarter of 2003, when compared to the same period last year. The decrease in external revenue for the third quarter was driven by lower financing income due to a lower average asset base, partially offset by an increase in external used equipment sales. The lower average asset base resulted from decreases in opportunities to finance IT equipment caused by the economic environment. The decline in external revenue was offset by an increase in internal revenue due to an increase in internal used equipment sales, primarily zSeries. Global Financing remarkets used equipment, primarily resulting from returns off lease, both externally and internally. Externally remarketed equipment represents sales to customers and resellers, while internally remarketed equipment represents used equipment, which is sold internally and then remarketed externally through the Hardware segment.
Global Financing revenue decreased 1.0 percent for the first nine months of 2003, when compared to the same period last year. The decrease in external revenue for the first nine months of 2003 was driven by lower financing income due to a lower asset base discussed above and a decrease in external used equipment sales. The decline in external revenue was offset by an increase in internal revenue due to an increase in used equipment sales discussed above.
Global Financing gross profit dollars decreased 3.3 percent while gross profit margin increased 0.8 percentage points, for the third quarter of 2003, when compared to the same period last year. The decrease in gross profit dollars was primarily driven by a lower asset base discussed above partially offset by improved financing margins. The increase in gross profit margin was driven by lower borrowing costs and improved margins in used equipment sales due to a change in mix towards higher margin products.
34
Global Financing gross profit dollars decreased 2.0 percent while gross profit margin decreased 0.5 percentage points, for the first nine months of 2003, when compared to the same period last year. The decrease in gross profit dollars was primarily driven by a lower asset base as discussed above partially offset by improved financing margins. The decrease in gross profit margin was driven by a change in mix towards lower margin remarketing sales and away from financing income.
Global Financing Pre-tax income increased 33.9 percent and 27.2 percent, respectively, for the third quarter and first nine months of 2003, when compared to the same periods last year. The increases were primarily driven by a decrease in bad debts expense from prior years, due to reduced exposure to certain specific customer issues including the Communications sector and lower general requirements due to a declining asset base. These issues have stabilized and contributed to the lower year-to-year charge. (Also see pages 37 and 38 for an additional discussion of Global Financing Allowance for Doubtful Accounts.)
The increase in return on equity from the third quarter and first nine months of 2003 when compared to the same periods last year was due to higher net income primarily associated with a decreased provision for bad debts expense.
Financial Condition
Balance Sheet
|
|
At September 30, 2003 |
At December 31, 2002 |
|||||
|---|---|---|---|---|---|---|---|
|
(Dollars in millions) |
|
|
|||||
| Cash | $ | 658 | $ | 1,157 | |||
| Net investment in sales-type leases | 11,349 | 12,314 | |||||
| Equipment under operating leases: | |||||||
| External customers | 1,720 | 1,922 | |||||
| Internal customers* | 1,706 | 1,701 | |||||
| Customer loans | 9,130 | 9,621 | |||||
| Total customer financing assets | 23,905 | 25,558 | |||||
| Commercial financing receivables | 4,399 | 5,525 | |||||
| Intercompany financing receivables* | 1,650 | 1,616 | |||||
| Other receivables | 265 | 445 | |||||
| Other assets | 1,093 | 941 | |||||
| Total financing assets | $ | 31,970 | $ | 35,242 | |||
| Intercompany payables* | $ | 3,609 | $ | 5,383 | |||
| Debt** | 22,725 | 23,828 | |||||
| Other liabilities | 2,243 | 2,556 | |||||
| Total financing liabilities | 28,577 | 31,767 | |||||
| Total financing equity | 3,393 | 3,475 | |||||
| Total financing liabilities and equity | $ | 31,970 | $ | 35,242 | |||
35
Sources and Uses of Funds
The primary use of funds in Global Financing is to originate customer and commercial financing assets. Customer financing assets for end users consist primarily of IBM hardware, software and services, but also include non-IBM equipment, software and services to meet IBM customers' total solutions requirements. Customer financing assets are primarily sales-type, direct financing and operating leases for equipment as well as loans for software and services with terms generally two to five years. Customer financing also includes internal activity as described on pages 39 and 40.
Commercial financing originations arise primarily from inventory and accounts receivable financing for dealers and remarketers of IBM and non-IBM products. Payment terms for inventory financing generally range from 30 to 75 days. Payment terms for accounts receivable financing generally range from 30 to 90 days. Also included in commercial financing assets are syndicated loans.
Originations
|
|
Three Months Ended September 30, |
Nine Months Ended September 30, |
|||||||||||
|---|---|---|---|---|---|---|---|---|---|---|---|---|---|
|
|
2003 |
2002 |
2003 |
2002 |
|||||||||
|
(Dollars in millions) |
|
|
|
|
|||||||||
| Customer finance: | |||||||||||||
| External | $ | 3,110 | $ | 2,747 | $ | 8,452 | $ | 8,534 | |||||
| Internal | 228 | 228 | 828 | 787 | |||||||||
| Commercial finance | 5,766 | 5,214 | 16,786 | 15,581 | |||||||||
| Total | $ | 9,104 | $ | 8,189 | $ | 26,066 | $ | 24,902 | |||||
Cash collections of customer and commercial financing assets exceeded new financing originations in both the third quarter and first nine months of 2003, which resulted in a net decline in financing assets from December 31, 2002. Funds were also generated through the sale and lease of used equipment sourced primarily from prior year's lease originations.
Cash generated by Global Financing was deployed to pay dividends and debt to IBM.
36
The following are the percentage of external financing assets by industry sector.
|
|
At September 30, 2003 |
At December 31, 2002 |
|||
|---|---|---|---|---|---|
| Financial Services | 30 | % | 31 | % | |
| Industrial | 20 | 18 | |||
| Business Partners* | 14 | 14 | |||
| Communications | 11 | 12 | |||
| Distribution | 10 | 11 | |||
| Public | 9 | 10 | |||
| Other | 6 | 4 | |||
| Total | 100 | % | 100 | % | |
Financing Receivables and Allowances
The following table presents financing receivables, excluding residual values, and the allowance for doubtful accounts.
|
|
At September 30, 2003 |
At December 31, 2002 |
|||||
|---|---|---|---|---|---|---|---|
|
(Dollars in millions) |
|
|
|||||
| Financing receivables | $ | 25,149 | $ | 28,007 | |||
| Specific allowance for doubtful accounts | 708 | 787 | |||||
| Unallocated allowance for doubtful accounts | 167 | 184 | |||||
| Total allowance for doubtful accounts | 875 | 971 | |||||
| Net financing receivables | $ | 24,274 | $ | 27,036 | |||
| Allowance for doubtful account coverage | 3.5 | % | 3.5 | % | |||
Roll-Forward of Financing Receivables Allowance for Doubtful Accounts
|
Dec. 31, 2002 |
Reserve Used* |
Additions Bad Debts Expense |
Other** |
September 30, 2003 |
|||||||||
|---|---|---|---|---|---|---|---|---|---|---|---|---|---|
|
(Dollars in millions) |
|
|
|
|
|||||||||
| $ | 971 | $ | (320 | ) | $ | 164 | $ | 60 | $ | 875 | |||
37
The percentage of financing receivables reserved is 3.5 percent at September 30, 2003, unchanged from December 31, 2002. Unallocated reserves decreased 9.2 percent from $184 million at December 31, 2002 to $167 million at September 30, 2003. The unallocated reserve coverage, however, increased slightly during the same period. The overall credit quality of the portfolio continues to remain stable and the unallocated reserve primarily reflects loss history and the current economic environment. Specific reserves decreased 10.0 percent from $787 million at December 31, 2002 to $708 million at September 30, 2003. The decrease in specific reserves was due to the write-off of reserved receivables during the period combined with lower requirements for additional specific reserves.
Global Financing's bad debts expense declined to $164 million for the nine months ended September 30, 2003, compared with $428 million for the nine months ended September 30, 2002. The decline was primarily attributed to higher reserve additions required in the first nine months of 2002 associated with the Communications sector, as compared to the first nine months of 2003. This issue has stabilized and contributed to the lower year-to-year charges.
Residual Value
Residual value is a risk unique to the financing business and management of this risk is dependent upon the ability to accurately project future equipment values. Global Financing has insight into product plans and cycles for the IBM products under lease. Based upon this product information, Global Financing continually monitors projections of future equipment values and compares them to the residual values reflected in the portfolio.
Sales of equipment, which are primarily sourced from equipment returned at end of lease, represents 40.8 percent and 36.9 percent of Global Financing's revenue in the third quarter and first nine months, respectively, of 2003 and 32.3 percent and 29.0 percent in the third quarter and first nine months, respectively, of 2002. The gross margins on these sales were 35.0 percent and 28.3 percent in the third quarter of 2003 and 2002, respectively. The gross margins were 29.4 percent and 20.7 percent for the first nine months of 2003 and 2002, respectively. In addition to selling assets sourced off of lease, Global Financing also leases used equipment to new customers or extends leasing arrangements with current customers. These are other ways that Global Financing profitably recovers the residual values. The table on page 39 presents the recorded amount of unguaranteed residual value for sales-type and operating leases at December 31, 2002 and September 30, 2003. In addition, the table presents the residual value as a percentage of the original amount financed, and a run out of the unguaranteed residual value over the remaining lives of these leases as of September 30, 2003.
38
Residual Value
|
|
|
|
Run out of Sept. 30, 2003 balance |
|||||||||||||||
|---|---|---|---|---|---|---|---|---|---|---|---|---|---|---|---|---|---|---|
|
|
Dec. 31, 2002 |
Sept. 30, 2003 |
2003 |
2004 |
2005 |
2006 and beyond |
||||||||||||
|
(Dollars in millions) |
|
|
|
|
|
|
||||||||||||
| Sales-type leases | $ | 821 | $ | 816 | $ | 96 | $ | 253 | $ | 280 | $ | 187 | ||||||
| Operating leases | 242 | 180 | 44 | 68 | 45 | 23 | ||||||||||||
| Total unguaranteed residual value | $ | 1,063 | $ | 996 | $ | 140 | $ | 321 | $ | 325 | $ | 210 | ||||||
| Related original amount financed | $ | 27,534* | $ | 27,295 | ||||||||||||||
| Percentage | 3.9 | % | 3.7 | % | ||||||||||||||
The decrease in the percentage of residual value to original amount financed was primarily due to a mix change towards more bargain purchase option leases.
Debt
|
|
At September 30, 2003 |
At December 31, 2002 |
|||
|---|---|---|---|---|---|
| Debt to equity ratio | 6.7 | x | 6.9 | x |
Global Financing funds its operations primarily through borrowings using a debt-to-equity ratio of approximately 7 to 1. The following table illustrates the correlation between Global Financing assets and Global Financing debt. Both assets and debt are presented in the Global Financing balance sheet on page 35.
|
|
|
Assets |
Debt |
|||
|---|---|---|---|---|---|---|
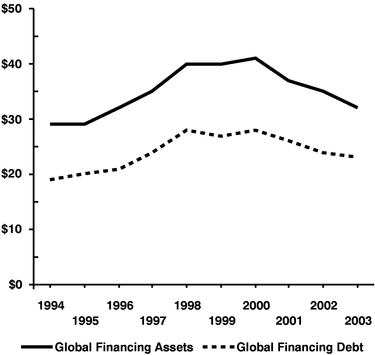
|
1994 1995 1996 1997 1998 1999 2000 2001 2002 2003 |
29 29 32 35 40 40 41 37 35 32 |
19 20 21 24 28 27 28 26 24 23 |
As of September 30, 2003.
The company's Global Financing business provides funding predominantly for the company's external customers but also provides intercompany financing for the company (internal). See page 36 for further information. IBM manages and measures Global Financing as if
39
it were a standalone entity and accordingly, interest expense relating to debt supporting Global Financing's external customer and internal business is included in the "Global Financing Results of Operations" on page 34 and in Segment Information on pages 49 through 52.
In the company's Consolidated Statement of Earnings on page one, however, the interest expense supporting Global Financing's internal financing to the company is reclassified from Cost of financing to Interest expense.
Liquidity
Global Financing is a segment of IBM and as such is supported by IBM's liquidity position and access to capital markets.
Forward Looking and Cautionary Statements
Except for the historical information and discussions contained herein, statements contained in this Form 10-Q may constitute "forward looking statements" within the meaning of the Private Securities Litigation Reform Act of 1995. These statements involve a number of risks, uncertainties and other factors that could cause actual results to differ materially, including the company's failure to continue to develop and market new and innovative products and services and to keep pace with technological change; competitive pressures; failure to obtain or protect intellectual property rights; quarterly fluctuations in revenues and volatility of stock prices; the company's ability to attract and retain key personnel; currency and customer financing risks; dependence on certain suppliers; changes in the financial or business condition of the company's distributors or resellers; the company's ability to successfully manage acquisitions and alliances; legal, political and economic changes and other risks, uncertainties and factors discussed elsewhere in this Form 10-Q, in the company's other filings with the Securities and Exchange Commission or in materials incorporated therein by reference.
ITEM 4. Controls and Procedures
The company's management evaluated, with the participation of the Chief Executive Officer and Chief Financial Officer, the effectiveness of the company's disclosure controls and procedures as of the end of the period covered by this report. Based on that evaluation, the Chief Executive Officer and Chief Financial Officer have concluded that the company's disclosure controls and procedures were effective as of the end of the period covered by this report. There has been no change in the company's internal control over financial reporting that occurred during the quarter covered by this report that has materially affected, or is reasonably likely to materially affect, the company's internal control over financial reporting.
40
ITEM 6 (a). Exhibits
Exhibit Number
| 11 | Statement re: computation of per share earnings. | |
12 |
Statement re: computation of ratios. |
|
31.1 |
Certification by CEO pursuant to Rule 13a-14(a) or 15d-14(a) of the Securities Exchange Act of 1934, as adopted pursuant to Section 302 of the Sarbanes-Oxley Act of 2002. |
|
31.2 |
Certification by CFO pursuant to Rule 13a-14(a) or 15d-14(a) of the Securities Exchange Act of 1934, as adopted pursuant to Section 302 of the Sarbanes-Oxley Act of 2002. |
|
32.1 |
Certification by CEO pursuant to 18 U.S.C. Section 1350, as adopted pursuant to Section 906 of the Sarbanes-Oxley Act of 2002. |
|
32.2 |
Certification by CFO pursuant to 18 U.S.C. Section 1350, as adopted pursuant to Section 906 of the Sarbanes-Oxley Act of 2002. |
ITEM 6 (b). Reports on Form 8-K
The company filed a Form 8-K on July 16, 2003, with respect to the company's financial results for the period ended June 30, 2003, and included the unaudited Consolidated Statement of Earnings, Consolidated Statement of Financial Position and Segment Data for the period ended June 30, 2003. In addition, IBM's Chief Financial Officer, John R. Joyce's second-quarter earnings presentation to security analysts on Wednesday, July 16, 2003, was filed as Attachment II and Attachment III of the Form 8-K.
The company filed a Form 8-K on August 1, 2003, containing its press release announcing that it will appeal the decision issued on July 31, 2003 in Cooper et al v. IBM Personal Pension Plan and IBM Corporation.
The company filed a Form 8-K on August 21, 2003, to incorporate by reference into Registra tion Statement No. 333-102603 on Form S-3, effective February 4, 2003, the documents included as Exhibits 1 and 2, relating to the issuance by IBM of up to $20,000,000,000 aggregate principal amount of Medium-Term Notes. Exhibit 1 is the Agency Agreement dated August 21, 2003, between IBM and ABN AMRO Incorporated, Banc of America Securities LLC, Banc One Capital Markets, Inc., BNP Paribas Securities Corp., BNY Capital Markets, Inc., Citigroup Global Markets Inc., Credit Suisse First Boston LLC, Deutsche Bank Securities Inc., Goldman, Sachs & Co., HSBC Securities (USA) Inc., J.P. Morgan Securities Inc., Lehman Brothers Inc., Merrill Lynch, Pierce, Fenner & Smith Incorporated, Morgan Stanley & Co. Incorporated and UBS Securities LLC. Exhibit 2 is the Form of Master Note.
41
Pursuant to the requirements of the Securities Exchange Act of 1934, the registrant has duly caused this report to be signed on its behalf by the undersigned thereunto duly authorized.
| International Business Machines Corporation (Registrant) |
|||
Date: November 10, 2003 |
By: |
/s/ ROBERT F. WOODS Robert F. Woods Vice President and Controller |
|
42
