Exhibit
Exhibit 99.1
October 16, 2018
Fellow shareholders,
Our broad slate of original programming helped drive a solid quarter of growth with streaming revenue increasing 36% year over year and global membership surpassing 130 million paid and 137 million total. We’re thrilled to be growing internet entertainment across the globe.
|
|
|
|
|
|
|
|
|
|
|
|
|
|
|
|
|
|
|
|
(in millions except per share data and Streaming Content Obligations) |
Q3'17 |
Q4'17 |
Q1'18 |
Q2'18 |
Q3'18 |
Q4'18 Forecast |
Total (Including DVD): |
|
|
|
|
|
|
Revenue |
$ |
2,985 |
|
$ |
3,286 |
|
$ |
3,701 |
|
$ |
3,907 |
|
$ |
3,999 |
|
$ |
4,199 |
|
Y/Y % Growth |
30.3 |
% |
32.6 |
% |
40.4 |
% |
40.3 |
% |
34.0 |
% |
27.8 |
% |
Operating Income |
$ |
209 |
|
$ |
245 |
|
$ |
447 |
|
$ |
462 |
|
$ |
481 |
|
$ |
205 |
|
Operating Margin |
7.0 |
% |
7.5 |
% |
12.1 |
% |
11.8 |
% |
12.0 |
% |
4.9 |
% |
Net Income |
$ |
130 |
|
$ |
186 |
|
$ |
290 |
|
$ |
384 |
|
$ |
403 |
|
$ |
105 |
|
Diluted EPS |
$ |
0.29 |
|
$ |
0.41 |
|
$ |
0.64 |
|
$ |
0.85 |
|
$ |
0.89 |
|
$ |
0.23 |
|
|
|
|
|
|
|
|
Total Streaming: |
|
|
|
|
|
|
Revenue |
$ |
2,875 |
|
$ |
3,181 |
|
$ |
3,602 |
|
$ |
3,814 |
|
$ |
3,911 |
|
$ |
4,114 |
|
Y/Y % Growth |
33.2 |
% |
35.3 |
% |
43.2 |
% |
42.8 |
% |
36.0 |
% |
29.3 |
% |
Paid Memberships |
104.02 |
|
110.64 |
|
118.90 |
|
124.35 |
|
130.42 |
|
138.02 |
|
Paid Net Additions |
4.99 |
|
6.62 |
|
8.26 |
|
5.45 |
|
6.07 |
|
7.60 |
|
Total Memberships |
109.25 |
|
117.58 |
|
125.00 |
|
130.14 |
|
137.10 |
|
146.50 |
|
Net Additions |
5.30 |
|
8.33 |
|
7.41 |
|
5.15 |
|
6.96 |
|
9.40 |
|
|
|
|
|
|
|
|
US Streaming: |
|
|
|
|
|
|
Revenue |
$ |
1,547 |
|
$ |
1,630 |
|
$ |
1,820 |
|
$ |
1,893 |
|
$ |
1,937 |
|
$ |
1,995 |
|
Contribution Profit |
$ |
554 |
|
$ |
561 |
|
$ |
697 |
|
$ |
740 |
|
$ |
762 |
|
$ |
663 |
|
Contribution Margin |
35.8 |
% |
34.4 |
% |
38.3 |
% |
39.1 |
% |
39.3 |
% |
33.2 |
% |
Paid Memberships |
51.35 |
|
52.81 |
|
55.09 |
|
55.96 |
|
56.96 |
|
58.46 |
|
Paid Net Additions |
1.02 |
|
1.47 |
|
2.28 |
|
0.87 |
|
1.00 |
|
1.50 |
|
Total Memberships |
52.77 |
|
54.75 |
|
56.71 |
|
57.38 |
|
58.46 |
|
60.26 |
|
Net Additions |
0.85 |
|
1.98 |
|
1.96 |
|
0.67 |
|
1.09 |
|
1.80 |
|
|
|
|
|
|
|
|
International Streaming: |
|
|
|
|
|
|
Revenue |
$ |
1,327 |
|
$ |
1,550 |
|
$ |
1,782 |
|
$ |
1,921 |
|
$ |
1,973 |
|
$ |
2,119 |
|
Contribution Profit (Loss) |
$ |
62 |
|
$ |
135 |
|
$ |
272 |
|
$ |
298 |
|
$ |
338 |
|
$ |
211 |
|
Contribution Margin |
4.7 |
% |
8.7 |
% |
15.3 |
% |
15.5 |
% |
17.1 |
% |
10.0 |
% |
Paid Memberships |
52.68 |
|
57.83 |
|
63.82 |
|
68.39 |
|
73.46 |
|
79.56 |
|
Paid Net Additions |
3.97 |
|
5.16 |
|
5.98 |
|
4.58 |
|
5.07 |
|
6.10 |
|
Total Memberships |
56.48 |
|
62.83 |
|
68.29 |
|
72.76 |
|
78.64 |
|
86.24 |
|
Net Additions |
4.45 |
|
6.36 |
|
5.46 |
|
4.47 |
|
5.87 |
|
7.60 |
|
|
|
|
|
|
|
|
Consolidated: |
|
|
|
|
|
|
Net cash (used in) operating activities |
$ |
(420 |
) |
$ |
(488 |
) |
$ |
(237 |
) |
$ |
(518 |
) |
$ |
(690 |
) |
|
Free Cash Flow |
$ |
(465 |
) |
$ |
(524 |
) |
$ |
(287 |
) |
$ |
(559 |
) |
$ |
(859 |
) |
|
EBITDA |
$ |
273 |
|
$ |
313 |
|
$ |
534 |
|
$ |
563 |
|
$ |
584 |
|
|
Shares (FD) |
447.4 |
|
448.1 |
|
450.4 |
|
451.6 |
|
451.9 |
|
|
Streaming Content Obligations* ($B) |
17.0 |
|
17.7 |
|
17.9 |
|
18.4 |
|
18.6 |
|
|
*Corresponds to our total known streaming content obligations as defined in our financial statements and related notes in our most recently filed SEC Form 10-K |
Q3 Results and Q4 Forecast
Streaming revenue grew 36% year over year in Q3, as average paid membership increased 25% and ASP rose 8%. International revenue included a -$90 million year over year impact from currency. Excluding the impact of F/X, international ASP rose 11% year over year and 2% sequentially.
Operating margin expanded 500 bps year over year to 12%. This exceeded our forecast of 10.5% due to the timing of content and marketing spend, a portion of which moved into Q4. EPS of $0.89 vs. $0.29 last year included an $8 million non-cash unrealized gain from F/X remeasurement on our Eurobond and a $38 million tax benefit related to adjustments to the transition tax on the repatriation of foreign earnings and the remeasurement of certain deferred tax assets (both related to true-ups from the 2017 US tax reform).
As a reminder, the quarterly guidance we provide is our internal forecast at the time we report and we strive for accuracy in our forecast. This means in some quarters we will be high and other quarters low relative to our guidance. This quarter, we under-forecasted memberships. Total net additions of 7.0m (up 31% vs. 5.3m last year) was higher than our forecast of 5.0m, and represented a new Q3 record. The variance relative to forecast was due to greater-than-expected acquisition globally, with strong growth broadly across all our markets including Asia.
For Q4, we forecast paid net additions of 7.6m, and total net additions of 9.4m, up 15% and 13% compared with 6.6m and 8.3m in Q4 last year. We’re still targeting operating margin to be at the lower end of the 10%-11% range for the full year 2018. This means that in Q4 we expect operating margin will dip to 5% from 7.5% in the year ago quarter. As we have written in previous letters, this sequential decline in operating margin in the second half of 2018 is due to the timing of content spend and a higher mix of original films in Q4’18 (film amortization is more accelerated than series amortization due to more front-loaded viewing). We would have preferred our operating margin to have been a little steadier over the course of the year, and we will target a little less quarterly variance next year in our progress to our full year target of 13% (assuming no major FX moves).
Next quarter, we expect to reclassify certain personnel costs from G&A to Content and Marketing, and from Technology & Development to Other Cost of Revenues. This change would reflect the ongoing evolution of our business to include self-production of content. A growing number of employees are becoming involved in developing content as we migrate to self-produce more of our content vs. only licensing original and non-original content. We expect to make the same change with marketing and other tech employee costs to maintain consistency in approach. The change would result in a comprehensive view of our total spending on content and marketing. This reclassification would have no impact on total operating expenses, operating profit or operating margin. If enacted, we will provide quarterly pro-formas so investors will see the change cleanly.
Evolving to Paid Membership Focus
The chart below illustrates our weekly paid net additions (on the right) and total net additions (on the left, which includes paid + free) over the last several years. Paid net adds are more steady, as total net additions can be skewed by free trials of varying quality. This skew adds noise to our membership forecasts in a way that isn’t material to revenue or the business. In comparison, paid net adds are a more reliable indicator of revenue growth.
Because growth in paid memberships is more steady, our forecast for paid net adds has been historically more accurate than our total net adds forecast. For example in Q2’18, our paid net adds forecast was off by 11% compared to a 17% variance for total net adds forecast. In addition, we are learning that no free trial may result in greater revenue in some markets, so free trial count at the end of a quarter will likely be a less insightful predictor of future growth than in the past.
As a result, starting with our earnings report in January 2019, we’ll only guide to paid memberships; a year after that, in 2020, we’ll cease reporting on end-of-quarter free trial count. We will show the weekly paid net adds graph, as above on the right, in each earnings letter going forward. We expect this additional disclosure will be helpful to your understanding of our business, in particular, how steady our paid membership growth is in the near term.
Content
We have three major categories of content: licensed non-first-window content such as Shameless, licensed original first-window content such as Orange is the New Black (owned and developed by Lionsgate), and now owned original first-window content from the Netflix studio, such as Stranger Things. Within those categories there are lots of subdivisions and per-territory treatments, but those are the big three buckets.
It was just two years ago when we began building the third category: a film and TV studio within Netflix. Some of our notable owned-titles in addition to Stranger Things include: Big Mouth, The Ranch, Bright, Godless, The Kissing Booth, 3%, Dark, Sacred Games and Nailed It. In addition to reducing our reliance on outside studios, this initiative provides us with greater control over the content we create (e.g., long term global rights), the ability to strengthen title-brand-love and franchise value (like consumer products) and potentially lower costs (as we can avoid the markup 3rd party studios charge us). To do this, we’ve had to develop new capabilities to manage the entire production process from creative support, production planning, crew and vendor management to visual effects, to name a few.
Today, we employ hundreds of people in physical production, working on a wide variety of owned titles spread across scripted and unscripted series, kids, international content, standup, docs and feature films from all over the world. To support our efforts, we’ll need more production capacity; we recently announced the selection of Albuquerque, New Mexico1 as the site of a new US production hub, where we anticipate bringing $1 billion dollars in production over the next 10 years and creating up to 1,000 production jobs per year. Our internal studio is already the single largest supplier of content to Netflix (on a cash basis).
___________________________________
1 https://ktla.com/2018/10/08/netflix-finalizing-new-production-hub-in-new-mexico/
We strive to offer a wide breadth of programming because we want to maximize the size of our membership base and people have very diverse tastes that we seek to satisfy. This also reduces our dependence on any individual title. Even our largest titles, which are viewed by tens of millions of our members, only account for a low single digit percentage of total streaming hours. Therefore, the vast majority of our growth in any given quarter is not attributable to any one piece of content, as you can see by the steadiness in our paid net additions.
This past quarter, in original series, we launched new seasons of Orange is the New Black, Ozark, Marvel’s Luke Cage and debuted Insatiable. Late in the quarter, we released Maniac, a limited series starring Emma Stone and Jonah Hill. We have also been ramping up our animated adult comedy offering. In Q3, we successfully premiered Disenchantment, from Matt Groening who created The Simpsons and Futurama, and Paradise PD, from the makers of Brickleberry, to complement Big Mouth, Bojack Horseman and F is for Family.
We also continue to expand our international originals, with projects spanning India, Mexico, Spain, Italy, Germany, Brazil, France, Turkey and throughout the Middle East to just name a few. In India, our hit series Sacred Games was followed up by Ghoul in late August. La Casa de las Flores, our latest Mexican original, has become a big hit.
As part of our Summer of Love2 and building on the success of Set It Up and The Kissing Booth, we released original films Like Father (starring Kristen Bell and Kelsey Grammer in a daughter-father dramedy), Sierra Burgess Is a Loser (starring Stranger Things’ Barb, Shannon Purser) and To All the Boys I’ve Loved Before, which is one of our most viewed original films ever with strong repeat viewing. More than 80 million accounts have watched one or more of the Summer of Love films globally and we are already in production for the next set of original rom-coms for our members.
This December, we'll be launching ROMA,3 from Oscar-winning director Alfonso Cuarón. We support simultaneous release in cinema and on Netflix, and the film will debut on Netflix and on over 100 screens worldwide, just as we are doing currently with 22 July,4 from Oscar-nominated director Paul Greengrass. We believe in our member-centric simultaneous release model for our original films and welcome additional theatre chains that are open to carrying our films to provide the shared-viewing, big-screen experience to their customers who enjoy that option.
We’ve come a long way in the five years since launching original content on Netflix. In addition to our commercial success, we’re ecstatic when the creators we work with are recognized for their inspiring work. This year, Netflix originals led with 112 Emmy nominations spanning 40 of our shows, docs and specials across nearly every category and we’re humbled to have tied HBO with the most number of Emmy wins with 23.
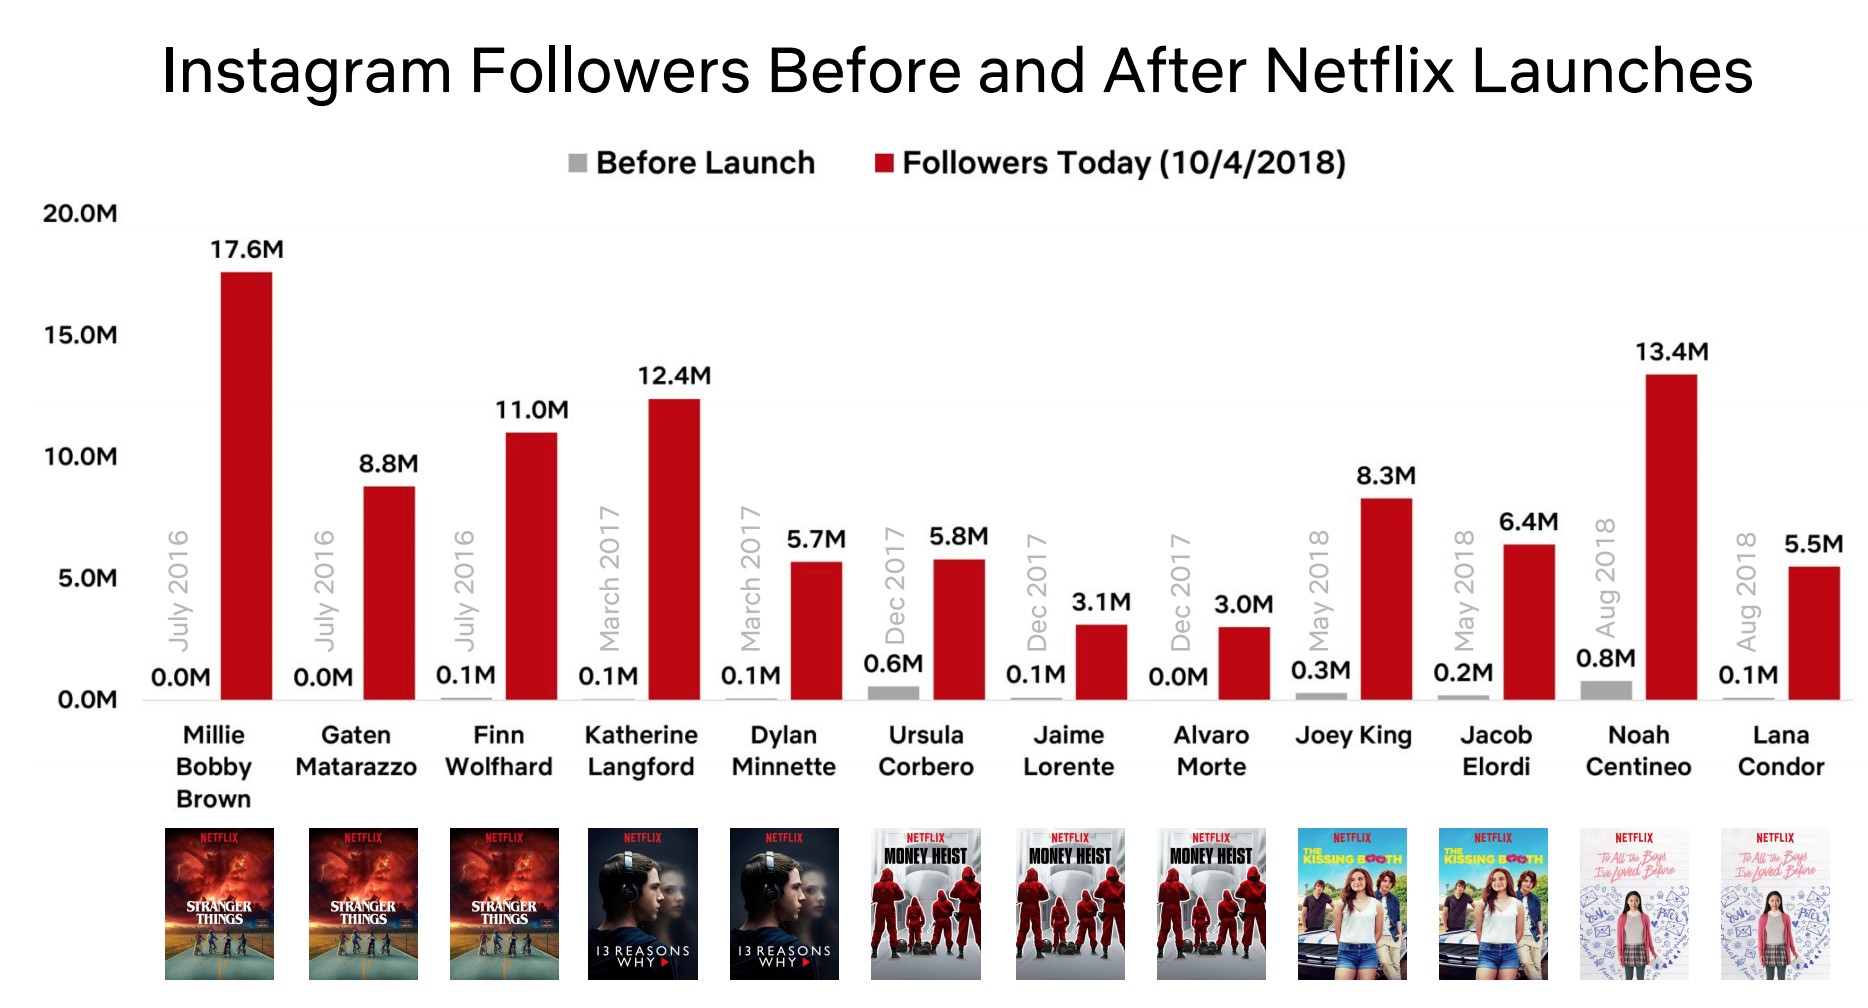
We’re also thrilled that Netflix has been a launching pad for a new generation of global stars like Millie Bobby Brown, Jacob Elordi, Noah Centineo and Gaten Matarazzo. When our service helps our talent develop huge fan bases (from small followings to over 10 million Instagram followers), we can attract the best talent in the world. This explosive growth in popularity is a good indicator that our shows and stars are breaking out around the planet.
___________________________________
2 https://www.forbes.com/sites/danafeldman/2018/06/20/its-the-summer-of-love-netflix-releases-6-new-original-romcoms/
3 https://variety.com/2018/film/in-contention/roma-netflix-best-picture-oscar-contender-1202922009/
4 https://www.slashfilm.com/22-july-theatrical-release/
More EU content
The European Union is currently rewriting its audio visual rules, which will eventually require subscription streaming services to devote a minimum of 30% of their catalog to European works. In addition, some member states are looking to require services like ours to invest some portion of local revenues into European works. We anticipate being able to meet these requirements by evolving our content offering.
We are heavily investing around the world to share stories broadly and to strengthen local production capacity and opportunity. We'd prefer to focus on making our service great for our members, which would include producing local content, rather than on satisfying quotas, but we anticipate that a regional content quota which approximates the region's share of our global membership will only marginally reduce member satisfaction. Nonetheless, quotas, regardless of market size, can negatively impact both the customer experience and creativity. We believe a more effective way for a country to support strong local content is to directly incentivize local content creators, independent of distribution channel.
Product and Partnerships
We continue to expand our partnerships with pay TV providers, ISPs and mobile operators across the globe. In Q3, we rolled out the first mobile bundle in Japan with KDDI and expanded our partnership with Verizon to pre-install the Netflix app on Android phones. In Q4, we plan to roll out our previously announced partnership with Sky UK.
Competition
We compete for entertainment time with linear TV, YouTube, video gaming, web browsing, social media, DVD and PPV, and more. In that competition for screen hours, we lose most of the time, but we win enough to keep growing.
As internet entertainment grows, more companies see the large opportunity. Content companies such as WarnerMedia and Disney/Fox are moving to self-distribute their own content; tech firms like Apple, Amazon and others are investing in premium content to enhance their distribution platforms. Amid these massive competitors on both sides, plus traditional media firms, our job is to make Netflix stand out so that when consumers have free time, they choose to spend it with our service.
Within linear TV, New Fox appears to have a great strategy, which is to focus on large simultaneous-viewing sports and news. These content areas are not transformed by on-demand viewing and personalization in the way that TV series and movies are, so they are more resistant to the rise of the internet. Other linear networks are likely to follow this model over time.
Free Cash Flow and Capital Structure
Free cash flow in Q3 was -$859 million vs. -$465 million in the year ago quarter. As a reminder, our growing mix of self-produced content, which requires us to fund content during the production phase prior to its release on Netflix, is the primary driver of our working capital needs that creates the gap between our positive net income and our free cash flow deficit.
We anticipate that FCF will be closer to -$3 billion than to -$4 billion for the full year 2018. We expect our quarterly FCF deficit will increase sequentially from Q3 to Q4 as our year to date FCF is -$1.7 billion. We currently see next year’s negative FCF as roughly flat with this year.
We recognize we are making huge cash investments in content, and we want to assure our investors that we have the same high confidence in the underlying economics as our cash investments in the past. These investments we see as very likely to help us to keep our revenue and operating profits growing for a very long time ahead.
Reference
For quick reference, our eight most recent investor letters are: July 2018,5 April 2018,6 January 2018,7 October 2017,8 July 2017,9 April 2017,10 January 2017,11 October 2016.12
October 16, 2018 Earnings Interview, 3pm PST
Our video interview with Eric Sheridan of UBS will be on youtube/netflixir at 3pm PST today. Questions that investors would like to see asked should be sent to eric.sheridan@ubs.com. Reed Hastings, CEO, David Wells, CFO, Ted Sarandos, Chief Content Officer, Greg Peters, Chief Product Officer and Spencer Wang, VP of IR/Corporate Development will all be on the video to answer Eric’s questions.
|
|
|
IR Contact:
|
PR Contact:
|
Spencer Wang |
Richard Siklos |
VP, Finance/IR & Corporate Development |
VP, Corporate Communications |
408 809-5360 |
408 540-2629 |
___________________________________
5 https://s22.q4cdn.com/959853165/files/doc_financials/quarterly_reports/2018/q2/FINAL-Q2-18-Shareholder-Letter.pdf
6 https://s22.q4cdn.com/959853165/files/doc_financials/quarterly_reports/2018/q1/FINAL-Q1-18-Shareholder-Letter.pdf
7 https://s22.q4cdn.com/959853165/files/doc_financials/quarterly_reports/2017/q4/COMBINED-Q4-17-Shareholder-Letter-FINAL.pdf
8 https://s22.q4cdn.com/959853165/files/doc_financials/quarterly_reports/2017/q3/Q3_17_Shareholder_Letter_COMBINED.pdf
9 https://s22.q4cdn.com/959853165/files/doc_financials/quarterly_reports/2017/q2/Q2_17_Shareholder_Letter.pdf
10 https://s22.q4cdn.com/959853165/files/doc_financials/quarterly_reports/2017/q1/Q117ShareholderLetterV2FINAL.pdf
11 https://s22.q4cdn.com/959853165/files/doc_financials/quarterly_reports/2016/q4/Q416ShareholderLetter.pdf
12 https://s22.q4cdn.com/959853165/files/doc_financials/quarterly_reports/2016/q3/FINAL_Q3_Letter.pdf
Use of Non-GAAP Measures
This shareholder letter and its attachments include reference to the non-GAAP financial measure of free cash flow and EBITDA. Management believes that free cash flow and EBITDA are important liquidity metrics because they measure, during a given period, the amount of cash generated that is available to repay debt obligations, make investments and for certain other activities or the amount of cash used in operations, including investments in global streaming content. However, these non-GAAP measures should be considered in addition to, not as a substitute for or superior to, net income, operating income, diluted earnings per share and net cash provided by operating activities, or other financial measures prepared in accordance with GAAP. Reconciliation to the GAAP equivalent of these non-GAAP measures are contained in tabular form on the attached unaudited financial statements.
Forward-Looking Statements
This shareholder letter contains certain forward-looking statements within the meaning of the federal securities laws, including statements regarding reclassification of personnel costs and its impact on financials; revenue impact of no free trials; impact of our Albuquerque, NM production hub; internal studio as supplier of content; expansion of international originals; content launches, including simultaneous release in theatre and on Netflix; our ability to adapt to changing content laws in Europe; partnerships; competition; content spend and strategy, including outside the US and impact on future growth; resistance to internet competition for certain linear TV strategies; domestic and international net, total and paid membership; revenue; contribution profit (loss) and contribution margin for both domestic international operations, as well as consolidated operating income, operating margins; net income, earnings per share and free cash flow. The forward-looking statements in this letter are subject to risks and uncertainties that could cause actual results and events to differ, including, without limitation: our ability to attract new members and retain existing members; our ability to compete effectively; maintenance and expansion of device platforms for streaming; fluctuations in consumer usage of our service; service disruptions; production risks; actions of Internet Service Providers; and, competition, including consumer adoption of different modes of viewing in-home filmed entertainment. A detailed discussion of these and other risks and uncertainties that could cause actual results and events to differ materially from such forward-looking statements is included in our filings with the Securities and Exchange Commission, including our Annual Report on Form 10-K, as amended by Form 10-K/A, filed with the Securities and Exchange Commission on February 5, 2018. The Company provides internal forecast numbers. Investors should anticipate that actual performance will vary from these forecast numbers based on risks and uncertainties discussed above and in our Annual Report on Form 10-K, as amended by Form 10-K/A. We undertake no obligation to update forward-looking statements to reflect events or circumstances occurring after the date of this shareholder letter.
Netflix, Inc.
Consolidated Statements of Operations
(unaudited)
(in thousands, except per share data)
|
|
|
|
|
|
|
|
|
|
|
|
|
|
|
|
|
|
|
|
|
|
Three Months Ended |
|
Nine Months Ended |
|
September 30,
2018 |
|
June 30,
2018 |
|
September 30,
2017 |
|
September 30,
2018 |
|
September 30,
2017 |
Revenues |
$ |
3,999,374 |
|
|
$ |
3,907,270 |
|
|
$ |
2,984,859 |
|
|
$ |
11,607,500 |
|
|
$ |
8,406,958 |
|
Cost of revenues |
2,412,346 |
|
|
2,289,867 |
|
|
1,992,980 |
|
|
6,898,288 |
|
|
5,552,312 |
|
Marketing |
435,269 |
|
|
526,780 |
|
|
312,490 |
|
|
1,441,271 |
|
|
858,083 |
|
Technology and development |
327,026 |
|
|
317,213 |
|
|
255,236 |
|
|
944,969 |
|
|
779,427 |
|
General and administrative |
344,065 |
|
|
311,197 |
|
|
215,526 |
|
|
933,513 |
|
|
623,760 |
|
Operating income |
480,668 |
|
|
462,213 |
|
|
208,627 |
|
|
1,389,459 |
|
|
593,376 |
|
Other income (expense): |
|
|
|
|
|
|
|
|
|
Interest expense |
(108,862 |
) |
|
(101,605 |
) |
|
(60,688 |
) |
|
(291,686 |
) |
|
(162,912 |
) |
Interest and other income (expense) |
7,004 |
|
|
68,028 |
|
|
(31,702 |
) |
|
9,289 |
|
|
(76,473 |
) |
Income before income taxes |
378,810 |
|
|
428,636 |
|
|
116,237 |
|
|
1,107,062 |
|
|
353,991 |
|
Provision for (benefit from) income taxes |
(24,025 |
) |
|
44,287 |
|
|
(13,353 |
) |
|
29,754 |
|
|
(19,421 |
) |
Net income |
$ |
402,835 |
|
|
$ |
384,349 |
|
|
$ |
129,590 |
|
|
$ |
1,077,308 |
|
|
$ |
373,412 |
|
Earnings per share: |
|
|
|
|
|
|
|
|
|
Basic |
$ |
0.92 |
|
|
$ |
0.88 |
|
|
$ |
0.30 |
|
|
$ |
2.48 |
|
|
$ |
0.87 |
|
Diluted |
$ |
0.89 |
|
|
$ |
0.85 |
|
|
$ |
0.29 |
|
|
$ |
2.39 |
|
|
$ |
0.84 |
|
Weighted-average common shares outstanding: |
|
|
|
|
|
|
|
|
|
Basic |
435,809 |
|
|
435,097 |
|
|
432,404 |
|
|
435,033 |
|
|
431,473 |
|
Diluted |
451,919 |
|
|
451,552 |
|
|
447,362 |
|
|
451,283 |
|
|
446,367 |
|
Netflix, Inc.
Consolidated Balance Sheets
(unaudited)
(in thousands)
|
|
|
|
|
|
|
|
|
|
As of |
|
September 30,
2018 |
|
December 31,
2017 |
Assets |
|
|
|
Current assets: |
|
|
|
Cash and cash equivalents |
$ |
3,067,534 |
|
|
$ |
2,822,795 |
|
Current content assets, net |
4,987,916 |
|
|
4,310,934 |
|
Other current assets |
674,531 |
|
|
536,245 |
|
Total current assets |
8,729,981 |
|
|
7,669,974 |
|
Non-current content assets, net |
13,408,443 |
|
|
10,371,055 |
|
Property and equipment, net |
371,152 |
|
|
319,404 |
|
Other non-current assets |
856,653 |
|
|
652,309 |
|
Total assets |
$ |
23,366,229 |
|
|
$ |
19,012,742 |
|
Liabilities and Stockholders' Equity |
|
|
|
Current liabilities: |
|
|
|
Current content liabilities |
$ |
4,613,011 |
|
|
$ |
4,173,041 |
|
Accounts payable |
441,427 |
|
|
359,555 |
|
Accrued expenses |
527,079 |
|
|
315,094 |
|
Deferred revenue |
716,723 |
|
|
618,622 |
|
Total current liabilities |
6,298,240 |
|
|
5,466,312 |
|
Non-current content liabilities |
3,593,823 |
|
|
3,329,796 |
|
Long-term debt |
8,336,586 |
|
|
6,499,432 |
|
Other non-current liabilities |
127,927 |
|
|
135,246 |
|
Total liabilities |
18,356,576 |
|
|
15,430,786 |
|
Stockholders' equity: |
|
|
|
Common stock |
2,215,736 |
|
|
1,871,396 |
|
Accumulated other comprehensive loss |
(14,508 |
) |
|
(20,557 |
) |
Retained earnings |
2,808,425 |
|
|
1,731,117 |
|
Total stockholders' equity |
5,009,653 |
|
|
3,581,956 |
|
Total liabilities and stockholders' equity |
$ |
23,366,229 |
|
|
$ |
19,012,742 |
|
Netflix, Inc.
Consolidated Statements of Cash Flows
(unaudited)
(in thousands)
|
|
|
|
|
|
|
|
|
|
|
|
|
|
|
|
|
|
|
|
|
|
Three Months Ended |
|
Nine Months Ended |
|
September 30,
2018 |
|
June 30,
2018 |
|
September 30,
2017 |
|
September 30,
2018 |
|
September 30,
2017 |
Cash flows from operating activities: |
|
|
|
|
|
|
|
|
|
Net income |
$ |
402,835 |
|
|
$ |
384,349 |
|
|
$ |
129,590 |
|
|
$ |
1,077,308 |
|
|
$ |
373,412 |
|
Adjustments to reconcile net income to net cash used in operating activities: |
|
|
|
|
|
|
|
|
|
Additions to streaming content assets |
(3,238,717 |
) |
|
(3,033,721 |
) |
|
(2,315,017 |
) |
|
(9,259,185 |
) |
|
(7,328,104 |
) |
Change in streaming content liabilities |
65,868 |
|
|
288,474 |
|
|
(34,587 |
) |
|
733,227 |
|
|
846,560 |
|
Amortization of streaming content assets |
1,911,767 |
|
|
1,817,817 |
|
|
1,627,477 |
|
|
5,478,428 |
|
|
4,483,954 |
|
Amortization of DVD content assets |
9,959 |
|
|
11,154 |
|
|
13,259 |
|
|
32,247 |
|
|
48,368 |
|
Depreciation and amortization of property, equipment and intangibles |
21,161 |
|
|
19,736 |
|
|
19,238 |
|
|
59,938 |
|
|
52,838 |
|
Stock-based compensation expense |
82,316 |
|
|
81,232 |
|
|
44,763 |
|
|
231,943 |
|
|
133,679 |
|
Other non-cash items |
8,962 |
|
|
13,921 |
|
|
9,896 |
|
|
31,092 |
|
|
43,081 |
|
Foreign currency remeasurement loss (gain) on long-term debt |
(7,670 |
) |
|
(85,410 |
) |
|
50,830 |
|
|
(52,000 |
) |
|
115,050 |
|
Deferred taxes |
(39,453 |
) |
|
(9,539 |
) |
|
(57,090 |
) |
|
(71,041 |
) |
|
(104,556 |
) |
Changes in operating assets and liabilities: |
|
|
|
|
|
|
|
|
|
Other current assets |
(30,364 |
) |
|
(25,564 |
) |
|
(41,399 |
) |
|
(111,833 |
) |
|
(147,000 |
) |
Accounts payable |
(4,449 |
) |
|
7,733 |
|
|
34,029 |
|
|
77,367 |
|
|
10,590 |
|
Accrued expenses |
134,000 |
|
|
(52,851 |
) |
|
74,006 |
|
|
200,198 |
|
|
119,506 |
|
Deferred revenue |
18,983 |
|
|
23,848 |
|
|
32,947 |
|
|
98,101 |
|
|
94,777 |
|
Other non-current assets and liabilities |
(25,609 |
) |
|
40,582 |
|
|
(7,549 |
) |
|
28,803 |
|
|
(40,146 |
) |
Net cash used in operating activities |
(690,411 |
) |
|
(518,239 |
) |
|
(419,607 |
) |
|
(1,445,407 |
) |
|
(1,297,991 |
) |
Cash flows from investing activities: |
|
|
|
|
|
|
|
|
|
Acquisition of DVD content assets |
(7,731 |
) |
|
(12,552 |
) |
|
(10,217 |
) |
|
(31,079 |
) |
|
(43,213 |
) |
Purchases of property and equipment |
(39,333 |
) |
|
(27,323 |
) |
|
(33,963 |
) |
|
(103,826 |
) |
|
(151,717 |
) |
Change in other assets |
(121,630 |
) |
|
(441 |
) |
|
(1,107 |
) |
|
(123,857 |
) |
|
(2,940 |
) |
Purchases of short-term investments |
— |
|
|
— |
|
|
(2,799 |
) |
|
— |
|
|
(74,819 |
) |
Proceeds from sale of short-term investments |
— |
|
|
— |
|
|
250,278 |
|
|
— |
|
|
320,154 |
|
Proceeds from maturities of short-term investments |
— |
|
|
— |
|
|
— |
|
|
— |
|
|
22,705 |
|
Net cash provided by (used in) investing activities |
(168,694 |
) |
|
(40,316 |
) |
|
202,192 |
|
|
(258,762 |
) |
|
70,170 |
|
Cash flows from financing activities: |
|
|
|
|
|
|
|
|
|
Proceeds from issuance of debt |
— |
|
|
1,900,000 |
|
|
— |
|
|
1,900,000 |
|
|
1,420,510 |
|
Debt issuance costs |
— |
|
|
(16,992 |
) |
|
(312 |
) |
|
(16,992 |
) |
|
(15,325 |
) |
Proceeds from issuance of common stock |
29,781 |
|
|
26,936 |
|
|
34,669 |
|
|
113,052 |
|
|
73,673 |
|
Other financing activities |
(544 |
) |
|
(532 |
) |
|
65 |
|
|
(1,397 |
) |
|
189 |
|
Net cash provided by financing activities |
29,237 |
|
|
1,909,412 |
|
|
34,422 |
|
|
1,994,663 |
|
|
1,479,047 |
|
Effect of exchange rate changes on cash, cash equivalents, and restricted cash |
(5,562 |
) |
|
(36,340 |
) |
|
10,685 |
|
|
(34,725 |
) |
|
27,667 |
|
Net increase (decrease) in cash, cash equivalents, and restricted cash |
(835,430 |
) |
|
1,314,517 |
|
|
(172,308 |
) |
|
255,769 |
|
|
278,893 |
|
Cash, cash equivalents, and restricted cash at beginning of period |
3,913,994 |
|
|
2,599,477 |
|
|
1,918,777 |
|
|
2,822,795 |
|
|
1,467,576 |
|
Cash, cash equivalents, and restricted cash at end of period |
$ |
3,078,564 |
|
|
$ |
3,913,994 |
|
|
$ |
1,746,469 |
|
|
$ |
3,078,564 |
|
|
$ |
1,746,469 |
|
|
|
|
|
|
|
|
|
|
|
|
Three Months Ended |
|
Nine Months Ended |
|
September 30,
2018 |
|
June 30,
2018 |
|
September 30,
2017 |
|
September 30,
2018 |
|
September 30,
2017 |
Non-GAAP free cash flow reconciliation: |
|
|
|
|
|
|
|
|
|
Net cash used in operating activities |
$ |
(690,411 |
) |
|
$ |
(518,239 |
) |
|
$ |
(419,607 |
) |
|
$ |
(1,445,407 |
) |
|
$ |
(1,297,991 |
) |
Acquisition of DVD content assets |
(7,731 |
) |
|
(12,552 |
) |
|
(10,217 |
) |
|
(31,079 |
) |
|
(43,213 |
) |
Purchases of property and equipment |
(39,333 |
) |
|
(27,323 |
) |
|
(33,963 |
) |
|
(103,826 |
) |
|
(151,717 |
) |
Change in other assets |
(121,630 |
) |
|
(441 |
) |
|
(1,107 |
) |
|
(123,857 |
) |
|
(2,940 |
) |
Non-GAAP free cash flow |
$ |
(859,105 |
) |
|
$ |
(558,555 |
) |
|
$ |
(464,894 |
) |
|
$ |
(1,704,169 |
) |
|
$ |
(1,495,861 |
) |
Netflix, Inc.
Segment Information
(unaudited)
(in thousands)
|
|
|
|
|
|
|
|
|
|
|
|
|
|
|
|
|
|
|
|
|
|
As of / Three Months Ended |
|
As of/ Nine Months Ended |
|
September 30,
2018 |
|
June 30,
2018 |
|
September 30,
2017 |
|
September 30,
2018 |
|
September 30,
2017 |
Domestic Streaming |
|
|
|
|
|
|
|
|
|
Paid net membership additions |
998 |
|
|
872 |
|
|
1,022 |
|
|
4,147 |
|
|
3,440 |
|
Paid memberships at end of period |
56,957 |
|
|
55,959 |
|
|
51,345 |
|
|
56,957 |
|
|
51,345 |
|
Total memberships at end of period |
58,464 |
|
|
57,379 |
|
|
52,772 |
|
|
58,464 |
|
|
52,772 |
|
|
|
|
|
|
|
|
|
|
|
Revenues |
$ |
1,937,314 |
|
|
$ |
1,893,222 |
|
|
$ |
1,547,210 |
|
|
$ |
5,650,555 |
|
|
$ |
4,522,751 |
|
Cost of revenues |
991,823 |
|
|
925,703 |
|
|
864,408 |
|
|
2,812,399 |
|
|
2,445,858 |
|
Marketing |
183,521 |
|
|
227,961 |
|
|
128,901 |
|
|
639,504 |
|
|
357,547 |
|
Contribution profit |
761,970 |
|
|
739,558 |
|
|
553,901 |
|
|
2,198,652 |
|
|
1,719,346 |
|
|
|
|
|
|
|
|
|
|
|
International Streaming |
|
|
|
|
|
|
|
|
|
Paid net membership additions |
5,070 |
|
|
4,580 |
|
|
3,965 |
|
|
15,631 |
|
|
11,493 |
|
Paid memberships at end of period |
73,465 |
|
|
68,395 |
|
|
52,678 |
|
|
73,465 |
|
|
52,678 |
|
Total memberships at end of period |
78,635 |
|
|
72,762 |
|
|
56,476 |
|
|
78,635 |
|
|
56,476 |
|
|
|
|
|
|
|
|
|
|
|
Revenues |
$ |
1,973,283 |
|
|
$ |
1,921,144 |
|
|
$ |
1,327,435 |
|
|
$ |
5,676,513 |
|
|
$ |
3,538,862 |
|
Cost of revenues |
1,383,422 |
|
|
1,324,240 |
|
|
1,081,485 |
|
|
3,966,471 |
|
|
2,946,414 |
|
Marketing |
251,748 |
|
|
298,819 |
|
|
183,589 |
|
|
801,767 |
|
|
500,536 |
|
Contribution profit |
338,113 |
|
|
298,085 |
|
|
62,361 |
|
|
908,275 |
|
|
91,912 |
|
|
|
|
|
|
|
|
|
|
|
Domestic DVD |
|
|
|
|
|
|
|
|
|
Paid memberships at end of period |
2,828 |
|
|
2,971 |
|
|
3,520 |
|
|
2,828 |
|
|
3,520 |
|
Total memberships at end of period |
2,852 |
|
|
2,999 |
|
|
3,569 |
|
|
2,852 |
|
|
3,569 |
|
|
|
|
|
|
|
|
|
|
|
Revenues |
$ |
88,777 |
|
|
$ |
92,904 |
|
|
$ |
110,214 |
|
|
$ |
280,432 |
|
|
$ |
345,345 |
|
Cost of revenues |
37,101 |
|
|
39,924 |
|
|
47,087 |
|
|
119,418 |
|
|
160,040 |
|
Contribution profit |
51,676 |
|
|
52,980 |
|
|
63,127 |
|
|
161,014 |
|
|
185,305 |
|
|
|
|
|
|
|
|
|
|
|
Consolidated |
|
|
|
|
|
|
|
|
|
|
|
|
|
|
|
|
|
|
|
Revenues |
$ |
3,999,374 |
|
|
$ |
3,907,270 |
|
|
$ |
2,984,859 |
|
|
$ |
11,607,500 |
|
|
$ |
8,406,958 |
|
Cost of revenues |
2,412,346 |
|
|
2,289,867 |
|
|
1,992,980 |
|
|
6,898,288 |
|
|
5,552,312 |
|
Marketing |
435,269 |
|
|
526,780 |
|
|
312,490 |
|
|
1,441,271 |
|
|
858,083 |
|
Contribution profit |
1,151,759 |
|
|
1,090,623 |
|
|
679,389 |
|
|
3,267,941 |
|
|
1,996,563 |
|
Other operating expenses |
671,091 |
|
|
628,410 |
|
|
470,762 |
|
|
1,878,482 |
|
|
1,403,187 |
|
Operating income |
480,668 |
|
|
462,213 |
|
|
208,627 |
|
|
1,389,459 |
|
|
593,376 |
|
Other expense |
(101,858 |
) |
|
(33,577 |
) |
|
(92,390 |
) |
|
(282,397 |
) |
|
(239,385 |
) |
Provision for (benefit from) income taxes |
(24,025 |
) |
|
44,287 |
|
|
(13,353 |
) |
|
29,754 |
|
|
(19,421 |
) |
Net income |
$ |
402,835 |
|
|
$ |
384,349 |
|
|
$ |
129,590 |
|
|
$ |
1,077,308 |
|
|
$ |
373,412 |
|
Netflix, Inc.
Non-GAAP Information
(unaudited)
(in thousands)
|
|
|
|
|
|
|
|
|
|
|
|
|
|
|
|
|
|
|
|
|
|
|
|
September 30,
2017 |
|
December 31,
2017 |
|
March 31,
2018 |
|
June 30,
2018 |
|
September 30,
2018 |
Non-GAAP Adjusted EBITDA reconciliation: |
|
|
|
|
|
|
|
|
|
GAAP net income |
$ |
129,590 |
|
|
$ |
185,517 |
|
|
$ |
290,124 |
|
|
$ |
384,349 |
|
|
$ |
402,835 |
|
Add: |
|
|
|
|
|
|
|
|
|
Other expense |
92,390 |
|
|
113,973 |
|
|
146,962 |
|
|
33,577 |
|
|
101,858 |
|
Provision for (benefit from) income taxes |
(13,353 |
) |
|
(54,187 |
) |
|
9,492 |
|
|
44,287 |
|
|
(24,025 |
) |
Depreciation and amortization of property, equipment and intangibles |
19,238 |
|
|
19,073 |
|
|
19,041 |
|
|
19,736 |
|
|
21,161 |
|
Stock-based compensation expense |
44,763 |
|
|
48,530 |
|
|
68,395 |
|
|
81,232 |
|
|
82,316 |
|
Adjusted EBITDA |
$ |
272,628 |
|
|
$ |
312,906 |
|
|
$ |
534,014 |
|
|
$ |
563,181 |
|
|
$ |
584,145 |
|