Tesla Motors Inc 8-K 2012-07-25
Sign in or join
Add a note by highlighting text or Replying to an existing note.
Add a note by highlighting text or Replying to an existing note.
Exhibit 99.1

|
Tesla Motors, Inc. Second Quarter 2012 Shareholder Letter
First Model S deliveries to customers, ahead of announced schedule
Model S receives excellent reviews
Model S reservations exceeded 11,500 at quarter end accelerating since May
Production on plan for 2012 goal of 5,000 deliveries
Store and service center openings accelerating into summer
Daimler Mercedes-Benz EV program on schedule |
July 25, 2012
Dear Fellow Shareholders,
It has been an incredibly busy quarter at Tesla. We started Model S deliveries ahead of schedule and launched our Get Amped Tour of Model S across the United States. This tour is designed to give 5,000 test drives in 45 days. We also ramped powertrain deliveries for the Toyota RAV4 EV and began to recognize revenue on the Mercedes-Benz EV program. Also, our Roadsters continued to sell well despite economic headwinds in Europe.
It is clear that Model S has been well received with overwhelmingly positive response from reservation holders, investors, auto journalists and the media. Our key objective for the rest of the year is to ramp production with a focus on quality and to rollout the Model S experience to a broader audience through customer deliveries, test drives and store openings.
Model S Receives Excellent Reviews
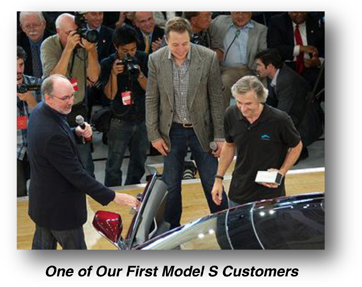
We officially commenced Model S customer deliveries on June 22nd with an event at our Tesla Factory in Fremont, California. That weekend, over 550 reservation holders had a chance to drive Model S on a test drive course that included freeway driving, tight turns, smooth and rough roads, and general city driving. What did our guests think of Model S? In their words
| Ø | Model S is amazing! I drive a very nice car until now. I say until now because this blows me away. |
| Ø | Model S wants to go fast, but it also wants to let you know that everythings okay. Its under control, everythings gonna be fine. |
| Ø | I went on the rough part of the road and I felt like I was sailing and I put my foot on the accelerator and the thing took off like a rocket. |
| The positive media response has really captured the excitement of Model S. Chris Woodyard from USA Today wrote:
Ø Teslas Model S electric is spectacular.
Ø The car is a flat-out joy to drive. And youll want to run it flat-out.
Ø It wasnt just the cars performance that amazed us, although that alone probably would have done the trick. Its the car overall.
Ø Inside and out, there are little touches that impress everywhere. |
|
Our goal for Model S was not just to build the best EV in the world, but to build the best premium sedan in the world. Frank Markus of Motor Trend reflected this in the headline of his Model S review: Rocket Scientists Launch an Out-of-This-World Sedan That Happens to be Electric. He wrote:
| Ø | So is it the best car in the world? This fourth production example built may not be, but Id rank it among the top few percentile. |
| Ø | The Model S bolts away from a stop like any EV, but it accelerates from 60 to 80 mph like a big gasser, continuing to pull strongly past 100 mph. |
| Ø | Trust me after a walk through the factory, a visit to a dealer showroom, and an hour-and-a-half spent driving the car on a mix of roads, my eyes are wide and my jaw has dropped. |
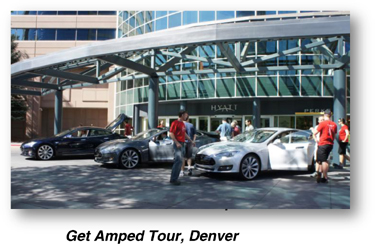
June 23rd marked the start of our Get Amped Model S Test Drive Tour. Throughout the summer, Model S vehicles will visit 15 major United States and Canadian cities, providing about 5,000 test drives to reservation holders and their guests. So far we have visited San Francisco, Los Angeles, Seattle, Washington DC, Scottsdale, Portland, Denver and New York City. Over the next four weeks we will be visiting Chicago, Miami and other cities throughout the United States and Canada.
Building the Tesla Brand
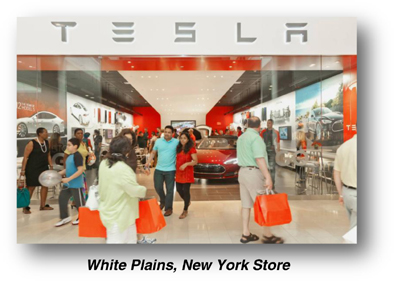
| We continue to open Tesla Stores and Service Centers to put infrastructure in place to support a broader base of Model S customers. In Q2, we opened three new Tesla stores in Oslo, Norway, White Plains, New York, and Santa Monica, California. In July, we have already opened two additional locations in Scottsdale, Arizona and Portland, Oregon. We plan to open about five more stores or galleries this year at strategic locations in North America, several of which will be in the northeast corridor of the United States. So far this year, we have welcomed over one million visitors to our ten new design stores and galleries in the United States and are exceeding our expectations for driving customer traffic. |
|
|
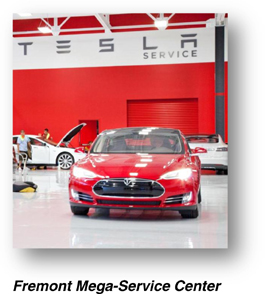
In addition to our Tesla Ranger service, where our technicians come to the customer, we currently operate 18 service centers globally. We are aggressively expanding this coverage with additional service center openings. In June, we opened our Fremont mega-service center, complete with customer lounge, parts distribution, customer delivery center, service technician training, and global service headquarters. By year-end, we plan to more than double the number of service locations around the world from todays levels.
In June, we also announced a partnership with Wells Fargo to provide retail financing for our customers in the United States. More than just offering traditional financing, our goal is to streamline the car buying process and offer competitive rates. We want buying a Tesla to be a transparent and enjoyable experience. |
Model S reservations at quarter end were over 11,500, and are now at about 12,200. The start of Model S deliveries, test drives and favorable media reviews led to a record number of retail reservations in June and has us on track for July to be another record month. This accelerating pace of reservations makes us confident that demand will surpass 20,000 Model S units for full year 2013 deliveries. We also plan to disclose quarterly reservations through the end of the year after which point deliveries will become the natural focus of our reporting.
Model S Production on Schedule for 2012 Goals
During the quarter we completed all regulatory tests, including crash safety assessments, required for the sale of Model S in the United States. Development and testing continue to homologate Model S for the rest of the world, with initial focus on Canada and Europe.
At Tesla, we listen to our customers. In response to some constructive feedback regarding the interior of Model S, we kicked off the Opportunity Console program with several variations of a center console enhancement for customer consideration. We have been collecting feedback on these variations and plan to offer some new options in this area. With our level of vertical integration and manufacturing flexibility, it is relatively easy for us to rapidly add these options.
In July, we received and tuned for production the last of the Fuji stamping dies. With almost all of our manufacturing equipment in place, we are currently taking time to produce each car to our highest standards while we work with our suppliers and refine our manufacturing processes to enable quality at larger volumes. As our capabilities scale, we plan to continue making customer deliveries on a methodical ramp with a target to deliver 5,000 units this year.
Quarterly Results
Our Q2 revenues were $27 million. Automotive sales were $22 million, a 15% increase from the prior quarter, which reflects continued sales of the remaining Roadsters internationally, start of Model S deliveries in the United States and ramp up of powertrain component sales to Toyota for the RAV4 EV. We sold 89 Roadsters in the quarter, bringing the total Roadsters sold to over 2,350. We anticipate selling out of Roadsters by the end of this year while our international sales team transitions to support the upcoming launch of Model S in Europe and Asia.
During the quarter, we made good progress in the development of the full electric powertrain for the Mercedes Benz EV, resulting in the first recognition of development services revenue on this program. Development services revenue in Q2 was $5 million, significantly lower than the prior quarter due to completion of the Toyota RAV4 EV program in the prior quarter and the start of the Daimler program in Q2.
Overall gross margin for Q2 was 18%, driven by strong development services margin. Automotive gross margin was lower at 9%, mainly due to planned ramp up costs associated with production of Model S and Toyota RAV4 EV components and the impact of the weak euro on Roadster revenues. The initial Model S deliveries have a lower gross margin as planned. We expect gross margin will improve significantly as we move into full production mode and absorb more of the fixed overheads.
Research and development (R&D) expenses were $68 million on a non-GAAP basis and $75 million on a GAAP basis. This 8% sequential increase in non-GAAP R&D expenses was primarily due to our continuing investments in Model S pre-production activities, including manufacturing preparedness, process validation, prototype builds and extensive testing at both the car and component levels.
Selling, general and administrative (SG&A) expenses were $31 million on a non-GAAP basis and $36 million on a GAAP basis, reflecting increased expenses for the expansion of our store network and the Model S delivery infrastructure. Capital expenditures were slightly below plan at about $61 million in Q2 as we continued to build out the Tesla Factory and invest in tooling for Model S components. Most of the remaining supplier payments are expected to be made in Q3 per normal payment terms.
Our non-GAAP net loss for the quarter was $93 million, or $(0.89) per share and GAAP net loss was $106 million, or $(1.00) per share, based on 105.2 million weighted common shares outstanding.
We concluded the quarter with $266 million in cash resources. This reflects $233 million in total cash on hand, including our Department of Energy (DoE) dedicated accounts, and the additional $33 million left to draw on our loan facility with the DoE. We drew down $71 million from our DoE loan facility in Q2. Our relationship with the DoE remains strong and we remain on track to draw all remaining funds in the next few months.
Updated 2012 Financial Guidance
We are maintaining our revenue guidance of $560 $600 million and our Model S volume projection of 5,000 units for 2012. We expect to deliver approximately 500 vehicles to customers in Q3 with the balance delivered in Q4. In June we were producing cars at the rate of about 5 per week. The pace of production has approximately doubled as of this week and we are ramping methodically. This plan gives us more time in Q3 to ensure quality production and allows us and our suppliers time to ramp operations commensurate with our delivery schedules.
|
We are reaffirming our gross margin target of 25% in 2013 upon achieving the manufacturing efficiencies and planned cost reductions associated with our objective of 20,000 deliveries in 2013. We anticipate that our automotive sales gross margin will become positive just before the end of Q3 of this year since until then our cost of automotive sales will reflect the full burden of operating our Tesla Factory, including depreciation for our manufacturing facility and equipment, allocated across only a limited number of vehicles. In Q4, we expect automotive sales gross margin to improve significantly mainly due to higher volume, as well as cost efficiencies and planned cost reductions.
We expect that R&D spending should decline sequentially in Q3 by about 20% as our Model S manufacturing expenses will be reflected in cost of goods sold rather than in R&D and as one time Model S development expenses decline. Selling, general and administrative expenses should continue to rise moderately on a quarterly basis as we continue to increase our vehicle selling and servicing capabilities. |
We remain on plan for capital expenditures of about $210 million for the year. For the rest of 2012, this spending will cover final payments on Model S related tooling and equipment, Model X development, and increases in our stores, galleries, service centers and overall operational capabilities to handle high volume sales. We currently expect to be close to free cash flow breakeven in Q4 of this year.
In Closing
We are thrilled that our customers, investors and the media have now had a chance to see for themselves just how compelling Model S is. We are also excited to have delivered the first group of Model S cars. We continue to focus on our long term goals of increasing quality production of the Model S so that we can achieve all of our goals to deliver on our volume, cash flow and profitability commitments.
If you have a chance, come by for a test drive. We want you to experience for yourselves how electric vehicles can surpass their internal combustion counterparts in every way.
Thank you for your interest in Tesla Motors.
| Sincerely,
|
||

|

|
|
| Elon Musk, Chairman, Product Architect and CEO | Deepak Ahuja, Chief Financial Officer | |
Webcast Information
Tesla will provide a live webcast of its second quarter 2012 financial results conference call beginning at 2:30 p.m. PDT on July 25, 2012, at ir.teslamotors.com. This webcast will also be available for replay for approximately one year thereafter.
Forward-Looking Statements
Certain statements in this shareholder letter, including statements in the Updated 2012 Financial Guidance section of this Shareholder Letter; statements relating to the progress Tesla is making with respect to the development, testing, performance, attributes, ability to add future options, quality expectations, safety expectations, schedule of development, test drives, production ramp and volume expectations of Model S; the schedule, development, features, anticipated performance, safety expectations, volume expectations and pricing of, and the ability of Tesla to leverage the Model S platform for, Model X; the ability of our suppliers to supply quality parts consistent with our production ramp of Model S; the ability to achieve vehicle volume, revenue, gross margin, spending and profitability and free cash flow targets (defined as cash flow from operations less capital expenditures); the ability of Tesla to produce vehicles in volume at the Tesla Factory in Fremont, California; the schedules related to, the financial results, including the total value, expected from, and the expected benefits from working on the development programs with Daimler and Toyota; our ability to execute multiple product development programs simultaneously; and future store and service center opening plans are forward-looking statements that are subject to risks and uncertainties. These forward-looking statements are based on managements current expectations, and as a result of certain risks and uncertainties actual results may differ materially from those projected. The following important factors, without limitation, could cause actual results to differ materially from those in the forward-looking statements: Teslas future success depends on its ability to design and achieve market acceptance of new vehicle models, specifically Model S and Model X; the risk of delays in the manufacture, production ramp and financing of Model S; the ability of suppliers to meet quality and part delivery expectations; consumers willingness to adopt electric vehicles and electric cars in particular; Teslas ability to fully draw down on its facility from the U.S. Department of Energy; risks associated with the ability to achieve the expected financial results from the production of powertrain systems for the Toyota RAV4 EV and vehicles for Daimler; competition in the automotive market generally and the alternative fuel vehicle market in particular; Teslas ability to establish, maintain and strengthen the Tesla brand; the unavailability, reduction or elimination of governmental and economic incentives for electric vehicles; Teslas ability to establish, maintain and strengthen its relationships with strategic partners such as Daimler, Toyota and Panasonic; and Teslas ability to execute on its plans for its new interactive retail strategy and for new store and service center openings. More information on potential factors that could affect the Companys financial results is included from time to time in Teslas Securities and Exchange Commission filings and reports, including the risks identified under the section captioned Risk Factors in its quarterly report on Form 10-Q filed on May 10, 2012. Tesla disclaims any obligation to update information contained in these forward-looking statements whether as a result of new information, future events, or otherwise.
| Investor Relations Contact: | Press Contact: | |||
| Jeff Evanson | Christina Ra | |||
| 650-681-5050 | Tesla Motors | |||
| ir@teslamotors.com | cra@teslamotors.com |
For additional information, please visit ir.teslamotors.com.
Tesla Motors, Inc.
Condensed Consolidated Statements of Operations
(Unaudited)
(In thousands, except per share data)
| Three Months Ended | Six Months Ended | |||||||||||||||||||
| June 30, 2012 |
Mar 31, 2012 |
June 30, 2011 |
June 30, 2012 |
June 30, 2011 |
||||||||||||||||
| Revenues |
||||||||||||||||||||
| Automotive sales |
$ | 22,054 | $ | 19,245 | $ | 39,028 | $ | 41,299 | $ | 72,656 | ||||||||||
| Development services |
4,599 | 10,922 | 19,143 | 15,521 | 34,545 | |||||||||||||||
|
|
|
|
|
|
|
|
|
|
|
|||||||||||
| Total revenues |
26,653 | 30,167 | 58,171 | 56,820 | 107,201 | |||||||||||||||
|
|
|
|
|
|
|
|
|
|
|
|||||||||||
| Cost of revenues |
||||||||||||||||||||
| Automotive sales |
20,150 | 13,932 | 30,528 | 34,082 | 57,489 | |||||||||||||||
| Development services |
1,741 | 6,025 | 9,135 | 7,766 | 13,176 | |||||||||||||||
|
|
|
|
|
|
|
|
|
|
|
|||||||||||
| Total cost of revenues (1) |
21,891 | 19,957 | 39,663 | 41,848 | 70,665 | |||||||||||||||
|
|
|
|
|
|
|
|
|
|
|
|||||||||||
| Gross profit |
4,762 | 10,210 | 18,508 | 14,972 | 36,536 | |||||||||||||||
| Operating expenses |
||||||||||||||||||||
| Research and development (1) |
74,854 | 68,391 | 52,531 | 143,245 | 93,693 | |||||||||||||||
| Selling, general and administrative (1) |
36,083 | 30,582 | 24,716 | 66,665 | 48,928 | |||||||||||||||
|
|
|
|
|
|
|
|
|
|
|
|||||||||||
| Total operating expenses |
110,937 | 98,973 | 77,247 | 209,910 | 142,621 | |||||||||||||||
|
|
|
|
|
|
|
|
|
|
|
|||||||||||
| Loss from operations |
(106,175 | ) | (88,763 | ) | (58,739 | ) | (194,938 | ) | (106,085 | ) | ||||||||||
| Interest income |
74 | 90 | 46 | 164 | 86 | |||||||||||||||
| Interest expense |
(84 | ) | (65 | ) | | (149 | ) | | ||||||||||||
| Other income (expense), net |
691 | (1,076 | ) | (71 | ) | (385 | ) | (1,556 | ) | |||||||||||
|
|
|
|
|
|
|
|
|
|
|
|||||||||||
| Loss before income taxes |
(105,494 | ) | (89,814 | ) | (58,764 | ) | (195,308 | ) | (107,555 | ) | ||||||||||
| Provision for income taxes |
109 | 59 | 139 | 168 | 289 | |||||||||||||||
|
|
|
|
|
|
|
|
|
|
|
|||||||||||
| Net loss |
$ | (105,603 | ) | $ | (89,873 | ) | $ | (58,903 | ) | $ | (195,476 | ) | $ | (107,844 | ) | |||||
|
|
|
|
|
|
|
|
|
|
|
|||||||||||
| Net loss per common share, basic and diluted |
$ | (1.00 | ) | $ | (0.86 | ) | $ | (0.60 | ) | $ | (1.86 | ) | $ | (1.12 | ) | |||||
|
|
|
|
|
|
|
|
|
|
|
|||||||||||
| Shares used in per share calculation, basic and diluted |
105,242 | 104,784 | 97,757 | 105,013 | 96,478 | |||||||||||||||
|
|
|
|
|
|
|
|
|
|
|
|||||||||||
| Notes: |
||||||||||||||||||||
| (1) Includes stock-based compensation expense of the following for the periods presented: |
|
|||||||||||||||||||
| Cost of revenues |
$ | 78 | $ | 7 | $ | 181 | $ | 85 | $ | 335 | ||||||||||
| Research and development |
7,133 | 5,932 | 3,018 | 13,065 | 5,317 | |||||||||||||||
| Selling, general and administrative |
5,332 | 4,772 | 3,727 | 10,104 | 7,200 | |||||||||||||||
|
|
|
|
|
|
|
|
|
|
|
|||||||||||
| Total stock-based compensation expense |
$ | 12,543 | $ | 10,711 | $ | 6,926 | $ | 23,254 | $ | 12,852 | ||||||||||
|
|
|
|
|
|
|
|
|
|
|
|||||||||||
Tesla Motors, Inc.
Condensed Consolidated Balance Sheets
(Unaudited)
(In thousands)
| June 30, 2012 |
December 31, 2011 |
|||||||
| Assets |
||||||||
| Cash and cash equivalents |
$ | 210,554 | $ | 255,266 | ||||
| Short-term marketable securities |
| 25,061 | ||||||
| Restricted cash - current |
21,960 | 23,476 | ||||||
| Accounts receivable |
11,023 | 9,539 | ||||||
| Inventory |
66,669 | 50,082 | ||||||
| Prepaid expenses and other current assets |
6,920 | 9,414 | ||||||
| Operating lease vehicles, net |
11,783 | 11,757 | ||||||
| Property and equipment, net |
421,859 | 298,414 | ||||||
| Restricted cash - noncurrent |
3,973 | 8,068 | ||||||
| Other assets |
22,128 | 22,371 | ||||||
|
|
|
|
|
|||||
| Total assets |
$ | 776,869 | $ | 713,448 | ||||
|
|
|
|
|
|||||
| Liabilities and Stockholders Equity |
||||||||
| Accounts payable and accrued liabilities |
$ | 112,214 | $ | 88,250 | ||||
| Deferred revenue |
5,377 | 5,491 | ||||||
| Reservation payments |
133,447 | 91,761 | ||||||
| Common stock warrant liability |
8,529 | 8,838 | ||||||
| Capital lease obligations |
7,181 | 3,897 | ||||||
| Long-term debt |
431,792 | 276,251 | ||||||
| Other long-term liabilities |
16,114 | 14,915 | ||||||
|
|
|
|
|
|||||
| Total liabilities |
714,654 | 489,403 | ||||||
| Stockholders equity |
62,215 | 224,045 | ||||||
|
|
|
|
|
|||||
| Total liabilities and stockholders equity |
$ | 776,869 | $ | 713,448 | ||||
|
|
|
|
|
|||||
Tesla Motors, Inc.
Supplemental Consolidated Financial Information
(Unaudited)
(In thousands)
| Three Months Ended | Six Months Ended | |||||||||||||||||||
| June 30, 2012 |
Mar 31, 2012 |
June 30, 2011 |
June 30, 2012 |
June 30, 2011 |
||||||||||||||||
| Selected Cash Flow Information |
||||||||||||||||||||
| Cash flows used in operating activities |
$ | 60,981 | $ | 50,087 | $ | 22,488 | $ | 111,068 | $ | 65,785 | ||||||||||
| Cash flows used in investing activities |
19,215 | 79,440 | 23,122 | 98,655 | 13,011 | |||||||||||||||
| Cash flows provided by financing activities |
72,180 | 92,831 | 264,335 | 165,011 | 298,618 | |||||||||||||||
| Other Selected Financial Information |
||||||||||||||||||||
| Capital expenditures |
$ | 61,286 | $ | 67,987 | $ | 54,314 | $ | 129,273 | $ | 74,790 | ||||||||||
| Depreciation and amortization |
4,348 | 4,163 | 4,317 | 8,511 | 7,835 | |||||||||||||||
| June 30, 2012 |
Mar 31, 2012 |
|||||||
| Cash |
||||||||
| Cash and cash equivalents |
$ | 210,554 | $ | 218,570 | ||||
| Restricted cash - current |
21,960 | 39,199 | ||||||
| Short-term marketable securities |
| 25,009 | ||||||
| Restricted cash - noncurrent |
3,973 | 3,805 | ||||||
Tesla Motors, Inc.
Reconciliation of GAAP to Non-GAAP Financial Information
(Unaudited)
(In thousands, except per share data)
| Three Months Ended | Six Months Ended | |||||||||||||||||||
| June 30, 2012 |
Mar 31, 2012 |
June 30, 2011 |
June 30, 2012 |
June 30, 2011 |
||||||||||||||||
| Research and development expenses (GAAP) |
$ | 74,854 | $ | 68,391 | $ | 52,531 | $ | 143,245 | $ | 93,693 | ||||||||||
| Stock-based compensation expense |
(7,133 | ) | (5,932 | ) | (3,018 | ) | (13,065 | ) | (5,317 | ) | ||||||||||
|
|
|
|
|
|
|
|
|
|
|
|||||||||||
| Research and development expenses (Non-GAAP) |
$ | 67,721 | $ | 62,459 | $ | 49,513 | $ | 130,180 | $ | 88,376 | ||||||||||
|
|
|
|
|
|
|
|
|
|
|
|||||||||||
| Selling, general and administrative expenses (GAAP) |
$ | 36,083 | $ | 30,582 | $ | 24,716 | $ | 66,665 | $ | 48,928 | ||||||||||
| Stock-based compensation expense |
(5,332 | ) | (4,772 | ) | (3,727 | ) | (10,104 | ) | (7,200 | ) | ||||||||||
|
|
|
|
|
|
|
|
|
|
|
|||||||||||
| Selling, general and administrative expenses (Non-GAAP) |
$ | 30,751 | $ | 25,810 | $ | 20,989 | $ | 56,561 | $ | 41,728 | ||||||||||
|
|
|
|
|
|
|
|
|
|
|
|||||||||||
| Net loss (GAAP) |
$ | (105,603 | ) | $ | (89,873 | ) | $ | (58,903 | ) | $ | (195,476 | ) | $ | (107,844 | ) | |||||
| Stock-based compensation expense |
12,543 | 10,711 | 6,926 | 23,254 | 12,852 | |||||||||||||||
| Change in fair value of warrant liability |
(154 | ) | (155 | ) | 340 | (309 | ) | 1,761 | ||||||||||||
|
|
|
|
|
|
|
|
|
|
|
|||||||||||
| Net loss (Non-GAAP) |
$ | (93,214 | ) | $ | (79,317 | ) | $ | (51,637 | ) | $ | (172,531 | ) | $ | (93,231 | ) | |||||
|
|
|
|
|
|
|
|
|
|
|
|||||||||||
| Net loss per common share, basic and diluted (GAAP) |
$ | (1.00 | ) | $ | (0.86 | ) | $ | (0.60 | ) | $ | (1.86 | ) | $ | (1.12 | ) | |||||
| Stock-based compensation expense |
0.11 | 0.10 | 0.07 | 0.22 | 0.13 | |||||||||||||||
| Change in fair value of warrant liability |
(0.00 | ) | (0.00 | ) | 0.00 | (0.00 | ) | 0.02 | ||||||||||||
|
|
|
|
|
|
|
|
|
|
|
|||||||||||
| Net loss per common share, basic and diluted (Non-GAAP) |
$ | (0.89 | ) | $ | (0.76 | ) | $ | (0.53 | ) | $ | (1.64 | ) | $ | (0.97 | ) | |||||
|
|
|
|
|
|
|
|
|
|
|
|||||||||||
| Shares used in per share calculation, basic and diluted (GAAP and Non-GAAP) |
105,242 | 104,784 | 97,757 | 105,013 | 96,478 | |||||||||||||||
|
|
|
|
|
|
|
|
|
|
|
|||||||||||
Non-GAAP Financial Information
Consolidated financial information has been presented in accordance with GAAP as well as on a non-GAAP basis. On a non-GAAP basis, financial measures exclude non-cash items such as stock-based compensation as well as the change in fair value related to Teslas warrant liability. Management believes that it is useful to supplement its GAAP financial statements with this non-GAAP information because management uses such information internally for its operating, budgeting and financial planning purposes. These non-GAAP financial measures also facilitate managements internal comparisons to Teslas historical performance as well as comparisons to the operating results of other companies. Non-GAAP information is not prepared under a comprehensive set of accounting rules and therefore, should only be read in conjunction with financial information reported under U.S. GAAP when understanding Teslas operating performance. A reconciliation between GAAP and non-GAAP financial information is provided above.
