Tesla Motors Inc 8-K 2012-02-15
Sign in or join
Add a note by highlighting text or Replying to an existing note.
Add a note by highlighting text or Replying to an existing note.
Exhibit 99.1

|
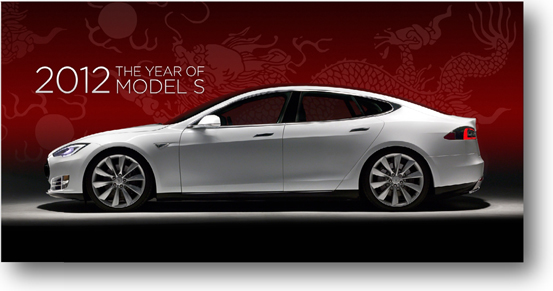
Tesla Motors, Inc. Fourth Quarter & Full Year 2011 Shareholder Letter
Model S deliveries to commence on schedule by July 2012
Model X Premiere A new vehicle category
New Mercedes-Benz EV powertrain program
Solid Q4 results; 2011 revenue of $204 million
2012 revenue anticipated to be $550-600 million |
February 15, 2012
Dear Fellow Shareholders,
We are pleased to report another quarter of solid performance throughout all areas of our company. Most importantly, Model S development and testing remain on schedule to commence deliveries by July of this year.
Last week we revealed our Model X crossover, a unique blend of a minivan, SUV and sports car based upon our Model S platform. The response from customers has been simply overwhelming. One day after the reveal, we had received over 500 reservation requests.
We are also pleased to announce the start of a development program with Daimler for a new Mercedes-Benz vehicle with a full Tesla powertrain. This represents an increase in the scope and scale of our deepening relationship with Daimler. More details will follow as we complete the contractual arrangements.
Our financial results for Q4 and full year 2011 reflect the continued demand for the Roadster and success in our Powertrain activities. Total revenues in the fourth quarter were $39 million, up 9% from Q4 of last year, and we concluded 2011 with over $204 million in revenues, up 75% from the year before.
Our losses reflect the planned investments in R&D and corporate infrastructure to support the launch of Model S. Our Q4 non-GAAP net loss was $0.69 per share, and $0.78 per share on a GAAP basis. For 2011, our non-GAAP net loss was $2.21 per share, and $2.53 per share on a GAAP basis. Net losses will continue as planned until we reach volume sales of Model S in 2013.
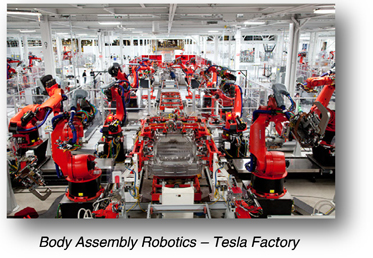
| Model S Development and Factory Preparation
Vehicle development and factory preparation remain on track to support our goal of initial Model S deliveries by July of this year. Almost 100% of the factory equipment needed to manufacture Model S is now in place. We are now fully assembling Beta vehicles at the Tesla Factory, and have already completed 30 of about 50 Betas we plan to produce. We continue to receive increasing quantities of dies and moulds for production of Model S parts in our press and plastics centers, and expect to have all of them fully commissioned by this spring.
The detailed testing planned with these vehicles, including testing for performance, safety and regulatory compliance, also remains on track. Notably, we achieved a 0 to 60 mph acceleration time of under 4.5 seconds in an outdoor test of the performance version of the Model S, successfully confirming our modeling assumptions. |
|
We expect to complete building our Beta vehicles and start building Release Candidate vehicles in the first quarter. During this process we are continuing to fine-tune our production processes and incorporate a higher percentage of production-intent components into the cars. Once Model S is qualified for street driving on U.S. roads, we expect to make cars available to customers for test drives in early summer.
Store Expansion & Growing Model S Reservations
During the quarter, we opened three New Design stores in Bellevue, WA, Chicago, IL and Newport Beach, CA, and a Tesla Gallery in Houston, TX. We now have stores or galleries in 20 locations globally. We expect to open about 8-10 new stores and 10-15 new service centers this year, primarily in the U.S. The service centers, complimented by our Tesla Ranger service, should enable us to provide service to our customers throughout the U.S.
The response to our store strategy continues to surpass our expectations nearly 300,000 people visited our six New Design locations during the month of December. This extraordinary level of consumer contact proves that our stores represent an effective branding and sales strategy.
Reservations for Model S continued to grow during the quarter. Aided by our store growth, the October customer event in Fremont, and the formalization of pricing, we added over 1,500 net new reservations during the quarter. This brings our total count to over 8,000 reservations as of the end of December, with all U.S. Signature Series reservations sold out in January!
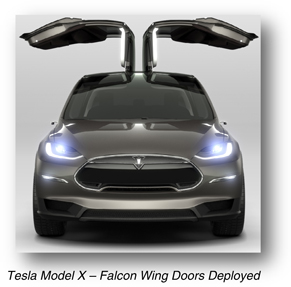
Tesla Model X World Premiere
Last week, we hosted the world premiere of our Model X crossover vehicle with over a thousand guests. Model X targets the design and performance-conscious consumer with a family.
Starting with the Model S platform, our design engineers were able to create a vehicle that is smaller than other seven passenger vehicles on the outside, but has substantially more room inside. The design is then amped-up in the Tesla way we announced that Model X will offer an all-wheel drive system with a dual motor which we anticipate will propel the vehicle from 0 to 60 mph in 4.4 seconds. This would make Model X faster than many sports cars. Matched with superior handling resulting from its low center of gravity, Model X should offer a remarkable combination of functionality, style and performance.
Model X should also offer exceptional levels of access and safety. With our innovative Falcon Wing doors, Model X has very convenient access to its third row passenger seats. Model X is the only seven passenger crossover vehicle that allows third row access without folding the second row (thus avoiding the removal of a child seat in the second row). In addition, we expect that Model Xs exceptional handling and its all-weather, all-road capabilities will make it a very safe vehicle.
|
|
Pricing for the Model X will be similar to a comparably equipped Model S, and will also be offered with Signature Series and performance versions. A Model X reservation requires a minimum $5,000 refundable deposit - a serious customer commitment. One day after the reveal, we received over 500 reservation requests, representing almost $40 million in potential sales, and making Model X our most popular product introduction ever.
These reservations came without Super Bowl ads or extensive marketing. Instead, a very compelling vehicle garnered such massive media attention that for a period last Friday, Model X was the third most searched term on Google. Moreover, since the event we have seen a modest increase in Model S reservations as well, suggesting to us that Model X is a complementary product to Model S, and that the risk of Model S cannibalization is low.
|
Since Model X leverages the Model S architecture and powertrain, we continue to anticipate that Model X can be brought to production quickly. We plan to start Model X production in late 2013 and ramp to significant customer deliveries in early 2014, with volumes targeted at 10,000-15,000 units per year. Importantly, much of the equipment we are currently installing at the Tesla Factory for Model S can also be used for Model X.
Powertrain Update; Daimler Partnership Deepens
We are pleased with our deepening partnership with Daimler. Daimler recently issued Tesla an initial purchase order to develop a full powertrain for a new, all-electric Mercedes-Benz. We anticipate that this vehicle program will represent an increase in the scope and scale of our work with Daimler. While our prior programs have only used Tesla battery packs and chargers, this program will be for a full powertrain, which also includes the motor, gearbox, inverter and all related software. We expect to recognize development services revenue from this program starting in Q2. The full development services and production agreements are expected to be finalized shortly. The key elements of the program, including launch timing, will be announced by Daimler at the appropriate time.
The RAV4 EV program continues on schedule. We expect to complete all milestones in the Toyota RAV4 EV development program on schedule in Q1, and plan to ship complete powertrain systems under the production contract starting in Q2.
Today, there are more Tesla-produced pure EV battery packs in the hands of Daimler and Toyota than Roadsters. This gives us a wealth of real-world data to compliment the nearly 20 million miles our customers have accumulated during Roadster driving.
Solid Financial Performance
Total revenues in Q4 were $39 million, up 9% from Q4 of last year. Full year revenues of $204 million were up 75% from 2010. Automotive sales in Q4 were up 12% from last year due to higher Roadster related revenue. This was partially offset by declining powertrain component sales, as we wrapped up the production programs with Daimler on A-Class and Smart EVs on schedule.
We delivered 150 Roadsters in Q4. As expected, unit deliveries declined slightly from last quarter, due to the successful wind down of sales in the U.S. In the rest of the world sales rose sequentially, except for the U.K. Total Roadster deliveries worldwide now exceed 2,150. We have now completed the assembly of the last gliders for the Roadster at Lotus. We expect to sell the remaining 330 Roadsters in Europe and Asia by the end of 2012.
Automotive gross margin at 23% was consistent with last quarter. Development services gross margin was only 6%, thus resulting in a total gross margin of 20%, down from last quarter. As shared before, timing differences between recognition of revenue and the underlying costs of development services can cause the gross margin of our development services contracts to vary from quarter to quarter. With the conclusion of the Toyota development services contract this quarter, we expect development services margin to improve substantially in Q1. Full year 2011 total gross margin was very solid at 30%.
Our operating expenses continue to reflect our investments in the development of powertrain technology and new products, as well as the build-out of our infrastructure. Our total Q4 operating expenses were $89 million on a GAAP basis and $80 million on a non-GAAP basis, which excludes stock-based compensation expense.
Over two-thirds of our operating expenses relate to our investments in research and development (R&D). R&D spending increased from last quarter, reflecting ongoing costs of developing the Model S, increased activity in preparing the Tesla Factory and the build of Beta vehicles. Selling, general and administrative (SG&A) expenses remained flat from last quarter, as higher store-related and marketing activities, including the opening of new stores, were offset by savings in G&A functions.
Capital expenditures were about $54 million in Q4 as we continued to build out the Tesla Factory and invest in tooling for Model S. Full year 2011 capex was $198 million, below the low end of our guidance of between $220 and $245 million.
In total, our non-GAAP net loss for the quarter was $72 million, or $0.69 per share, based on 104.4 million weighted common shares outstanding.
At the end of the year, we had cash and cash equivalents on our balance sheet of $304 million. Combining the cash on hand with the additional $189 million we have left to draw on our loan facility with the Department of Energy, we now have approximately $493 million in available capital. We drew down $51 million from our DoE loan facility in Q4. Our projects continue to be on track with the DoE per the terms of the loan agreement, and our relationship with the DoE remains strong.
2012 Financial Guidance
2012 is really a year of two halves for Tesla. Before Model S is launched, we expect that our quarterly revenue in the first half of the year should be lower than Q4. This is based on a lower rate of Roadster sales due to its availability only in Europe and Asia, as well as the transitions in our powertrain activities from existing Daimler and Toyota projects to the new development program for Daimler and start of component sales for the Toyota RAV4 EV. After Model S deliveries begin, our revenues should increase significantly. On the expectation of delivering 5,000 Model S sedans in addition to our other ongoing Roadster and powertrain sales, we anticipate that full year revenues will be in the range of $550-600 million, split about 10%/90% between the first and second halves of 2012.
Gross margin is expected to vary quite a bit this year. Due to timing differences associated with revenue recognition on the Toyota development services contract, we expect gross margin will be in the high 30% range in
Q1. In Q2 we expect gross margin to be closer to the level for this quarter as we transition to the start of component production for Toyota RAV4 EV. The start of Model S deliveries causes a shift of our production expenses from R&D expense to cost of revenues. Once deliveries begin, our gross margin should be heavily influenced by capacity utilization. As we plan to slowly ramp our production in order to produce high quality cars, we expect that our gross margin in Q3 will be positive, but likely not meaningful. In Q4, we expect margin to improve significantly as volume ramps up, ultimately tracking toward our target of 25% gross margin upon achieving the manufacturing efficiencies associated with our objective of 20,000 deliveries in 2013.
R&D spending will start the year modestly above the Q4 level. As we have discussed in the past, this is due to the inclusion of factory spending in R&D and completion of all pre-production engineering and testing for Model S Beta and Release Candidate vehicles - which adds $15-20 million per quarter in the first half of the year. We expect R&D spending will drop in the second half of the year after the launch of Model S, although there will be some pick-up in spending on Model X during that period.
SG&A expenses are presently about equally split between G&A and sales & marketing (S&M) expenses. G&A expenses should grow slightly each quarter in 2012 from last quarter, while S&M expenses should scale with the growth of new store and service center openings. Stock-based compensation should be about $40-45 million this year. We expect that capital expenditures should be about the same as last year at approximately $200-220 million. This includes about $30 million that shifted slightly from late 2011 to early 2012, based on the timing of final payments for equipment and tooling.
We expect that reservations should continue to grow and changes in working capital should help improve cash from operations. Based on our current plans, we believe that we have adequate liquidity to reach profitability in 2013.
In Closing
While we hope the initial success of the Model X further demonstrates our companys potential, we are maintaining our immediate focus on delivering an awesome Model S to our customers by July. We look forward to showing the world that electric vehicles can surpass their internal combustion counterparts in every way.
Thank you for your interest in Tesla Motors.
Sincerely,
|
|
|
|
| Elon Musk, Chairman, Product Architect and CEO | Deepak Ahuja, Chief Financial Officer |
Webcast Information
Tesla will provide a live webcast of its fourth quarter 2011 financial results conference call beginning at 2:30 p.m. PDT on February 15, 2012, at ir.teslamotors.com. This webcast will also be available for replay for approximately two weeks thereafter.
Forward-Looking Statements
Certain statements in this shareholder letter, including statements in the 2012 Financial Guidance section of this Shareholder Letter, statements relating to the progress Tesla is making with respect to the development, testing, performance, attributes, schedule of development and launch, and volume expectations of Model S; the schedule, development, features, anticipated performance, safety expectations, volume expectations and pricing of, and the ability of Tesla to leverage the Model S platform for, Model X; the ability to achieve revenue, gross margin, spending and profitability targets; the ability of Tesla to produce vehicles at the Tesla Factory in Fremont, California as well as the plans and schedule for the Tesla Factory and the equipment there; the schedules related to, and the financial results expected from,Teslas development programs with Daimler and Toyota; our ability to execute multiple product development programs simultaneously; the sufficiency of current available funds to develop Model S and Model X; and the ability of Tesla to execute on its new interactive retail strategy and future store opening plans are forward-looking statements that are subject to risks and uncertainties. These forward-looking statements are based on managements current expectations, and as a result of certain risks and uncertainties actual results may differ materially from those projected. The following important factors, without limitation, could cause actual results to differ materially from those in the forward-looking statements: Teslas future success depends on its ability to design and achieve market acceptance of new vehicle models, specifically Model S and Model X; the risk of delays in the design, manufacture, launch and financing of Model S, including the build-out of its Model S manufacturing facility and the ability of its suppliers to meet quality and part delivery expectations; the risk of a decline in revenues prior to the launch of Model S; consumers willingness to adopt electric vehicles and electric cars in particular; Teslas ability to fully draw down on its facility from the U.S. Department of Energy; risks associated with the ability to achieve the expected financial results from the production of powertrain systems for the Toyota RAV4 EV; competition in the automotive market generally and the alternative fuel vehicle market in particular; Teslas ability to establish, maintain and strengthen the Tesla brand; the unavailability, reduction or elimination of governmental and economic incentives for electric vehicles; Teslas ability to establish, maintain and strengthen its relationships with strategic partners such as Daimler, Toyota and Panasonic; and Teslas ability to execute on its plans for its new interactive retail strategy and for new store openings. More information on potential factors that could affect the Companys financial results is included from time to time in Teslas Securities and Exchange Commission filings and reports, including the risks identified under the section captioned Risk Factors in its quarterly report on Form 10-Q filed on November 14, 2011, and its registration statement on Form S-1 filed on June 2, 2011. Tesla disclaims any obligation to update information contained in these forward-looking statements whether as a result of new information, future events, or otherwise.
Non-GAAP Financial Information
Consolidated financial information has been presented in accordance with GAAP as well as on a non-GAAP basis. On a non-GAAP basis, financial measures exclude non-cash items such as stock-based compensation as well as the change in fair value related to Teslas warrant liabilities. Management believes that it is useful to supplement its GAAP financial statements with this non-GAAP information because management uses such information internally for its operating, budgeting and financial planning purposes. These non-GAAP financial measures also facilitate managements internal comparisons to Teslas historical performance as well as comparisons to the operating results of other companies. In addition, Tesla believes these non-GAAP financial measures are useful to investors because they allow for greater transparency into the indicators used by management as a basis for its financial and operational decision making. Non-GAAP information is not prepared under a comprehensive set of accounting rules and therefore, should only be read in conjunction with financial information reported under U.S. GAAP when understanding Teslas operating performance. A reconciliation between GAAP and non-GAAP financial information is provided below.
| Investor Relations Contact: | Press Contact: | |||
| Jeff Evanson | Khobi Brooklyn | |||
| 650-681-5050 | Tesla Motors | |||
| ir@teslamotors.com | kbrooklyn@teslamotors.com |
For additional information, please visit ir.teslamotors.com.
Tesla Motors, Inc.
Condensed Consolidated Statements of Operations
(Unaudited)
(In thousands, except per share data)
| Three Months Ended | Year Ended | |||||||||||||||||||
| Dec 31, 2011 |
Sept 30, 2011 |
Dec 31, 2010 |
Dec 31, 2011 |
Dec 31, 2010 |
||||||||||||||||
| Revenues |
||||||||||||||||||||
| Automotive sales |
$ | 32,677 | $ | 43,235 | $ | 29,172 | $ | 148,568 | $ | 97,078 | ||||||||||
| Development services |
6,698 | 14,431 | 7,114 | 55,674 | 19,666 | |||||||||||||||
|
|
|
|
|
|
|
|
|
|
|
|||||||||||
| Total revenues |
39,375 | 57,666 | 36,286 | 204,242 | 116,744 | |||||||||||||||
|
|
|
|
|
|
|
|
|
|
|
|||||||||||
| Cost of revenues |
||||||||||||||||||||
| Automotive sales |
25,241 | 32,752 | 23,401 | 115,482 | 79,982 | |||||||||||||||
| Development services |
6,299 | 7,690 | 1,564 | 27,165 | 6,031 | |||||||||||||||
|
|
|
|
|
|
|
|
|
|
|
|||||||||||
| Total cost of revenues (1) |
31,540 | 40,442 | 24,965 | 142,647 | 86,013 | |||||||||||||||
|
|
|
|
|
|
|
|
|
|
|
|||||||||||
| Gross profit |
7,835 | 17,224 | 11,321 | 61,595 | 30,731 | |||||||||||||||
| Operating expenses |
||||||||||||||||||||
| Research and development (1) |
61,206 | 54,083 | 37,617 | 208,981 | 92,996 | |||||||||||||||
| Selling, general and administrative (1) |
27,556 | 27,618 | 25,349 | 104,102 | 84,573 | |||||||||||||||
|
|
|
|
|
|
|
|
|
|
|
|||||||||||
| Total operating expenses |
88,762 | 81,701 | 62,966 | 313,083 | 177,569 | |||||||||||||||
|
|
|
|
|
|
|
|
|
|
|
|||||||||||
| Loss from operations |
(80,927 | ) | (64,477 | ) | (51,645 | ) | (251,488 | ) | (146,838 | ) | ||||||||||
| Interest income |
89 | 80 | 63 | 255 | 258 | |||||||||||||||
| Interest expense |
(43 | ) | | | (43 | ) | (992 | ) | ||||||||||||
| Other income (expense), net |
(495 | ) | (594 | ) | 187 | (2,646 | ) | (6,583 | ) | |||||||||||
|
|
|
|
|
|
|
|
|
|
|
|||||||||||
| Loss before income taxes |
(81,376 | ) | (64,991 | ) | (51,395 | ) | (253,922 | ) | (154,155 | ) | ||||||||||
| Provision for (benefit from) income taxes |
112 | 87 | (37 | ) | 489 | 173 | ||||||||||||||
|
|
|
|
|
|
|
|
|
|
|
|||||||||||
| Net loss |
$ | (81,488 | ) | $ | (65,078 | ) | $ | (51,358 | ) | $ | (254,411 | ) | $ | (154,328 | ) | |||||
|
|
|
|
|
|
|
|
|
|
|
|||||||||||
| Net loss per common share, basic and diluted (2)(3)(4) |
$ | (0.78 | ) | $ | (0.63 | ) | $ | (0.54 | ) | $ | (2.53 | ) | $ | (3.04 | ) | |||||
|
|
|
|
|
|
|
|
|
|
|
|||||||||||
| Shares used in per share calculation, basic and diluted (2)(3)(4) |
104,392 | 104,077 | 94,240 | 100,389 | 50,718 | |||||||||||||||
|
|
|
|
|
|
|
|
|
|
|
|||||||||||
| Notes: | ||||||||||||||||||||
| (1) Includes stock-based compensation expense of the following for the periods presented: |
|
|||||||||||||||||||
| Cost of revenues |
$ | 164 | $ | 171 | $ | 93 | $ | 670 | $ | 243 | ||||||||||
| Research and development |
4,473 | 3,588 | 2,051 | 13,377 | 4,139 | |||||||||||||||
| Selling, general and administrative |
4,045 | 4,127 | 5,699 | 15,372 | 16,774 | |||||||||||||||
|
|
|
|
|
|
|
|
|
|
|
|||||||||||
| Total stock-based compensation expense |
$ | 8,682 | $ | 7,886 | $ | 7,843 | $ | 29,419 | $ | 21,156 | ||||||||||
|
|
|
|
|
|
|
|
|
|
|
|||||||||||
| (2) | On July 2, 2010, the Company completed its initial public offering (IPO), pursuant to which the Company sold 11,880,600 shares of common stock. Concurrent with the closing of the IPO, the Company issued 2,941,176 shares of common stock to Toyota Motor Corporation in a private placement. |
Upon the completion of the IPO, all convertible preferred stock automatically converted into 70,226,844 shares of common stock. Additionally, 445,047 shares of common stock were issued upon the net exercise of all outstanding warrants, excluding the Department of Energy warrant.
| (3) | On November 2, 2010, the Company sold 1,418,573 shares of common stock to Panasonic Corporation in a private placement. |
| (4) | On June 8, 2011, the Company completed its follow-on public offering, pursuant to which the Company sold 6,095,000 shares of common stock. Concurrent with the closing of the offering, the Company issued 1,416,000 shares of common stock to Elon Musk and 637,475 shares of common stock to an affiliate of Daimler AG in a private placement. |
Tesla Motors, Inc.
Condensed Consolidated Balance Sheets
(Unaudited)
(In thousands)
| December 31, | December 31, | |||||||
| 2011 | 2010 | |||||||
| Assets |
||||||||
| Cash and cash equivalents |
$ | 255,266 | $ | 99,558 | ||||
| Restricted cash - current |
23,476 | 73,597 | ||||||
| Short-term marketable securities |
25,061 | | ||||||
| Accounts receivable |
9,539 | 6,710 | ||||||
| Inventory |
50,082 | 45,182 | ||||||
| Prepaid expenses and other current assets |
9,414 | 10,839 | ||||||
| Operating lease vehicles, net |
11,757 | 7,963 | ||||||
| Property and equipment, net |
298,414 | 114,636 | ||||||
| Restricted cash - noncurrent |
8,068 | 4,867 | ||||||
| Other assets |
22,371 | 22,730 | ||||||
|
|
|
|
|
|||||
| Total assets |
$ | 713,448 | $ | 386,082 | ||||
|
|
|
|
|
|||||
| Liabilities and Stockholders Equity |
||||||||
| Accounts payable and accrued liabilities |
$ | 88,250 | $ | 49,896 | ||||
| Deferred revenue |
5,491 | 7,418 | ||||||
| Reservation payments |
91,761 | 30,755 | ||||||
| Common stock warrant liability |
8,838 | 6,088 | ||||||
| Capital lease obligations |
3,897 | 775 | ||||||
| Long-term debt |
276,251 | 71,828 | ||||||
| Other long-term liabilities |
14,915 | 12,274 | ||||||
|
|
|
|
|
|||||
| Total liabilities |
489,403 | 179,034 | ||||||
| Stockholders equity |
224,045 | 207,048 | ||||||
|
|
|
|
|
|||||
| Total liabilities and stockholders equity |
$ | 713,448 | $ | 386,082 | ||||
|
|
|
|
|
|||||
Tesla Motors, Inc.
Supplemental Consolidated Financial Information
(Unaudited)
(In thousands)
| Three Months Ended | Year Ended | |||||||||||||||||||
| Dec 31, 2011 |
Sept 30, 2011 |
Dec 31, 2010 |
Dec 31, 2011 |
Dec 31, 2010 |
||||||||||||||||
| Selected Cash Flow Information |
||||||||||||||||||||
| Cash flows used in operating activities |
$ | 27,088 | $ | 21,491 | $ | 34,284 | $ | 114,364 | $ | 127,817 | ||||||||||
| Cash flows provided by (used in) investing activities |
15,254 | (178,170 | ) | (8,550 | ) | (175,928 | ) | (180,297 | ) | |||||||||||
| Cash flows provided by financing activities |
53,772 | 93,609 | 45,829 | 446,000 | 338,045 | |||||||||||||||
| Other Selected Financial Information |
||||||||||||||||||||
| Capital expenditures |
$ | 54,262 | $ | 68,844 | $ | 23,648 | $ | 197,896 | $ | 40,203 | ||||||||||
| Capital expenditures related to initial acquisition of Fremont facility and assets |
| | | | 65,210 | |||||||||||||||
|
|
|
|
|
|
|
|
|
|
|
|||||||||||
| Total capital expenditures |
$ | 54,262 | $ | 68,844 | $ | 23,648 | $ | 197,896 | $ | 105,413 | ||||||||||
|
|
|
|
|
|
|
|
|
|
|
|||||||||||
| Depreciation and amortization |
$ | 4,804 | $ | 4,280 | $ | 2,890 | $ | 16,919 | $ | 10,623 | ||||||||||
| Dec 31, 2011 |
Sept 30, 2011 |
Dec 31, 2010 |
||||||||||
| Cash and Investments |
||||||||||||
| Cash and cash equivalents |
$ | 255,266 | $ | 213,328 | $ | 99,558 | ||||||
| Restricted cash - current |
23,476 | 55,305 | 73,597 | |||||||||
| Short-term marketable securities |
25,061 | 65,060 | | |||||||||
| Restricted cash - noncurrent |
8,068 | 5,754 | 4,867 | |||||||||
Tesla Motors, Inc.
Reconciliation of GAAP to Non-GAAP Financial Information
(Unaudited)
(In thousands, except per share data)
| Three Months Ended | Year Ended | |||||||||||||||||||
| Dec 31, 2011 |
Sept 30, 2011 |
Dec 31, 2010 |
Dec 31, 2011 |
Dec 31, 2010 |
||||||||||||||||
| Research and development expenses (GAAP) |
$ | 61,206 | $ | 54,083 | $ | 37,617 | $ | 208,981 | $ | 92,996 | ||||||||||
| Stock-based compensation expense |
(4,473 | ) | (3,588 | ) | (2,051 | ) | (13,377 | ) | (4,139 | ) | ||||||||||
|
|
|
|
|
|
|
|
|
|
|
|||||||||||
| Research and development expenses (Non-GAAP) |
$ | 56,733 | $ | 50,495 | $ | 35,566 | $ | 195,604 | $ | 88,857 | ||||||||||
|
|
|
|
|
|
|
|
|
|
|
|||||||||||
| Selling, general and administrative expenses (GAAP) |
$ | 27,556 | $ | 27,618 | $ | 25,349 | $ | 104,102 | $ | 84,573 | ||||||||||
| Stock-based compensation expense |
(4,045 | ) | (4,127 | ) | (5,699 | ) | (15,372 | ) | (16,774 | ) | ||||||||||
|
|
|
|
|
|
|
|
|
|
|
|||||||||||
| Selling, general and administrative expenses (Non-GAAP) |
$ | 23,511 | $ | 23,491 | $ | 19,650 | $ | 88,730 | $ | 67,799 | ||||||||||
|
|
|
|
|
|
|
|
|
|
|
|||||||||||
| Net loss (GAAP) |
$ | (81,488 | ) | $ | (65,078 | ) | $ | (51,358 | ) | $ | (254,411 | ) | $ | (154,328 | ) | |||||
| Stock-based compensation expense |
8,682 | 7,886 | 7,843 | 29,419 | 21,156 | |||||||||||||||
| Change in fair value of warrant liabilities |
649 | 340 | (587 | ) | 2,750 | 5,022 | ||||||||||||||
|
|
|
|
|
|
|
|
|
|
|
|||||||||||
| Net loss (Non-GAAP) |
$ | (72,157 | ) | $ | (56,852 | ) | $ | (44,102 | ) | $ | (222,242 | ) | $ | (128,150 | ) | |||||
|
|
|
|
|
|
|
|
|
|
|
|||||||||||
| Net loss per common share, basic and diluted (GAAP) |
$ | (0.78 | ) | $ | (0.63 | ) | $ | (0.54 | ) | $ | (2.53 | ) | $ | (3.04 | ) | |||||
| Stock-based compensation expense |
0.08 | 0.08 | 0.08 | 0.29 | 0.42 | |||||||||||||||
| Change in fair value of warrant liabilities |
0.01 | 0.00 | (0.01 | ) | 0.03 | 0.09 | ||||||||||||||
|
|
|
|
|
|
|
|
|
|
|
|||||||||||
| Net loss per common share, basic and diluted (Non-GAAP) |
$ | (0.69 | ) | $ | (0.55 | ) | $ | (0.47 | ) | $ | (2.21 | ) | $ | (2.53 | ) | |||||
|
|
|
|
|
|
|
|
|
|
|
|||||||||||
| Shares used in per share calculation, basic and diluted (GAAP and Non-GAAP) |
104,392 | 104,077 | 94,240 | 100,389 | 50,718 | |||||||||||||||
|
|
|
|
|
|
|
|
|
|
|
|||||||||||
Non-GAAP Financial Information
Consolidated financial information has been presented in accordance with GAAP as well as on a non-GAAP basis. On a non-GAAP basis, financial measures exclude non-cash items such as stock-based compensation as well as the change in fair value related to Teslas warrant liabilities. Management believes that it is useful to supplement its GAAP financial statements with this non-GAAP information because management uses such information internally for its operating, budgeting and financial planning purposes. These non-GAAP financial measures also facilitate managements internal comparisons to Teslas historical performance as well as comparisons to the operating results of other companies. Non-GAAP information is not prepared under a comprehensive set of accounting rules and therefore, should only be read in conjunction with financial information reported under U.S. GAAP when understanding Teslas operating performance. A reconciliation between GAAP and non-GAAP financial information is provided above.