Tesla Motors Inc 8-K 2013-11-05
Sign in or join
Add a note by highlighting text or Replying to an existing note.
Add a note by highlighting text or Replying to an existing note.
Exhibit 99.1

|
Tesla Motors, Inc. Third Quarter 2013 Shareholder Letter
Record 5,500 Model S deliveries
Gross margin increased to 21% (non-GAAP) excluding ZEV credits
Net income (non-GAAP) of $16 million
Major WW expansion of service centers, stores and Superchargers
Cash balance nonetheless increased by $49 million to $796 million
Ramping production to meet growing demand in 2014 |
November 5, 2013
Dear Fellow Shareholders:
We achieved record levels of Model S production, deliveries and vehicle gross margin in Q3. This performance drove positive free cash flow and our third consecutive quarter of non-GAAP net income, while supporting substantial investments in future growth and customer support infrastructure.
Model S is becoming more pervasive every day. Over 19,000 Model S owners are driving in excess of 700,000 miles per day in over 20 countries and have now driven their cars more than 100 million miles. As more people see our car on the road, take a test drive or talk with another Model S owner, more demand is created for our product. Demand exceeds supply, despite no advertising, no discounts and no paid endorsements.
Model S Production, Deliveries and Gross Margin
| We are now producing 550 cars per week with improved process controls which consistently result in high quality cars. Consequently, we finished the quarter with a record of slightly over 5,500 deliveries, including over 1,000 deliveries to European customers. Production in the quarter significantly exceeded deliveries in order to fill the pipeline of vehicles in transit to Europe and provide cars for service and marketing uses.
We plan to continue to increase productions over the next several quarters in order to keep up with the growth in demand. Our suppliers are also ramping up their capacity to meet our production targets. Along those lines, we recently expanded our 2011 supplier agreement with Panasonic. Under this new agreement, Panasonic will increase its production capacity of automotive-grade lithium-ion battery cells to supply Tesla with a minimum of 1.8 billion cells over four years, more than three times our previous agreement. This number should be viewed as more of a floor than a ceiling. |
European Operations in Netherlands |
Our operations in the Netherlands have expanded substantially to enable vehicle assembly and testing of several hundred cars per week arriving into Europe. This facility also serves as a pan European parts warehouse and regional customer service center.
We made solid improvements in vehicle gross margin as our non-GAAP automotive gross margin (excluding zero emission vehicle or ZEV credits) rose to 21% from 14% last quarter. Cost reductions were achieved through a variety of approaches without reducing the value proposition to the customer. This included process efficiencies, design improvements, and reduction of waste in the supply chain. Strong average pricing, driven by more highly optioned European deliveries and a mix shift towards 85 kWh battery pack cars, also contributed to the gross margin improvement.
Growing Global Demand and Customer Infrastructure
Demand for Model S has continued to grow in North America and Europe. We began to take reservations in China during the quarter and now anticipate our first Model S deliveries there in Q1 2014. Customer testimonials and test drives remain our strongest demand drivers. With every passing week, we are hitting new records in the number of test drives with potential customers.
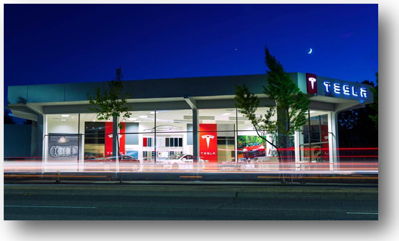
We are finding that opening a service center in a new geographic area can drive demand. As a result, we have complemented our store strategy with sales personnel in service centers to more rapidly expand our retail footprint. Since the end of Q2, our combined global retail and service locations have expanded by almost 20% to a total of over 100 locations today.
|
New Store in Palo Alto, CA |
During the quarter, we made dramatic improvements in our service operations. Our investments in staffing, training and locations are beginning to bear fruit. Tesla is pioneering a new approach to vehicle servicing that we believe will revolutionize the customer experience. An announcement about this will be forthcoming shortly.
We are also providing highly optioned Model S vehicles as service loaners to ensure a high level of customer satisfaction. The joy of driving a higher performance service loaner has persuaded some of our customers to trade up to these highly optioned cars. |
Model S - Safety First
Results of independent testing done by NHTSA confirmed our engineering goals regarding Model S safety. Model S was awarded a 5-star safety rating as part of the New Car Assessment Program (NCAP), not just overall, but in every subcategory. While approximately 1% of all vehicles tested also achieve 5 stars in every category, NHTSA also provides a more precise statistical number to manufacturers regarding the probability of injury of any given car. By this metric, Model S has the lowest probability of injury of any car ever tested.
Safely storing and using the energy contained in our battery packs has been a core objective of Tesla. All vehicles carry energy and face the risk that this energy could be released in an accident. Even though the electrical energy
stored in the battery pack is only about one tenth of the chemical energy stored in a tank of gasoline, we have designed complementary safety systems into the battery pack, including armor plating, internal firewalls and monitoring systems which provide additional layers of protection.
Supercharger Network Enhances Value
| Supercharging has become a significant part of the Tesla value proposition. Customers cite the ability to supercharge as one of the top 5 reasons they choose a Tesla. As a result, 90% of our customers opt for supercharging capability when they order their Model S. So far, nearly a third of all Model S cars have been supercharged at least once, powering these cars over 4 million supercharged miles and saving nearly 200,000 gallons of fuel.
We continue to rapidly expand the Supercharger network with 31 stations open in North America today. Our network now enables free long distance driving along the entire west coast of North America, from Vancouver to San Diego. By year-end, we expect to have a network that will allow cross country driving in the United States and a higher concentration of stations along the east coast. |
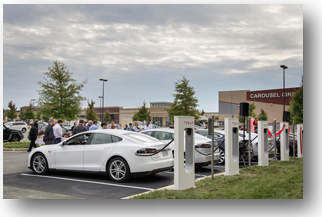
|
|
| Tesla Supercharger - Burlington, WA |
We are also expanding our Supercharging network into Scandinavia and Europe. In August, Tesla opened a network of six Supercharger stations in Norway, allowing Model S owners to travel conveniently and for free across Norways most vital and commonly used roads and highways.
After Norway, we are putting specific emphasis on Germany where we plan to upgrade to even faster 135 kW Superchargers. By March 2014, we plan that more than half of Germany should be covered, with complete coverage by mid-2014. By the end of 2014, we expect that the entire population of the Netherlands, Switzerland, Belgium, Austria, Denmark and Luxembourg and about 90 percent of the population in England, Wales and Sweden will live within 320 km of a Supercharger station.
Quarterly Results
Like last quarter, in addition to GAAP financials, we have presented non-GAAP financials excluding the effect of lease accounting. We believe these non-GAAP financials are useful because they align with the underlying cash flow activity and timing of vehicle deliveries, and we use such information internally for operational management and financial planning purposes. Non-GAAP financials add back deferred revenues and related costs for Q3 cars sold with a resale value guarantee to customers who obtained financing from one of our banking partners. This financing program was very popular in the United States during the quarter, and represented about half the cars delivered in states where the program is available.
Q3 non-GAAP revenues were $603 million, up 9% from Q2, while GAAP revenues were $431 million, up 6% from Q2, despite the drop in ZEV credit revenue. One of the drivers for the anticipated drop in ZEV credit revenue to $10 million in Q3 from $51 million in the prior quarter was the shift in the mix of sales to Europe and non-ZEV states in the United States.
Excluding ZEV revenue, non-GAAP revenues grew 18% from Q2. The strong revenue growth was driven by an increase in vehicle deliveries and higher vehicle average selling prices (ASPs) due to the start of European deliveries and a higher mix of cars with 85 kWh battery packs. We also continued to supply full electric powertrains to Toyota for the RAV4 EV.
|
Development services gross margin was negative this quarter due to the timing of revenue milestones and development costs incurred during Q3. The development program with Daimler is on track for full completion by early next year. Shortly thereafter, we anticipate the start of production to support market launch by Daimler in 2014.
Overall, Q3 non-GAAP gross margin was 22%, and 24% on a GAAP basis.
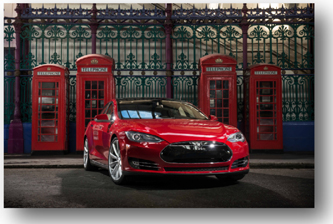
Research and development (R&D) expenses were $48 million on a non-GAAP basis and $56 million on a GAAP basis. R&D spending increased due to the work on Model S right-hand drive and localization efforts for foreign markets. We have also accelerated development work on Model X. |
|
| Model S in London for Store Opening |
Selling, general and administrative (SG&A) expenses were $67 million on a non-GAAP basis and $77 million on a GAAP basis. This increase from Q2 was driven by our global expansion including service and information technology infrastructure, and continued investments in our retail and Supercharger networks.
Q3 non-GAAP net income was $16 million, or $0.12 per share. This excludes lease accounting, stock-based compensation and non-cash interest expense. Including these items, GAAP net loss was $38 million or $(0.32) per share.
The Q3 non-GAAP earnings per share (EPS) calculation is based on 137.1 million fully diluted shares, and includes 0.9 million shares from the conversion feature of our convertible bond issued last quarter, since the average price of Teslas common shares during the third quarter exceeded the conversion price of $124.52 per share. The dilution of 0.9 million shares from the conversion feature is fully offset by the bond hedge, but this benefit is not considered for EPS reporting since it is anti-dilutive. Our Q3 GAAP net loss per share is calculated using 121.9 million basic shares.
In Q3, we generated $26 million of positive free cash flow (cash flow from operations less capital expenditures). This is a new record for positive cash flow generated in any quarter. Our total cash at quarter end was $796 million (including current restricted cash), an increase of $49 million from last quarter.
Q4 Outlook
We are continuing to expand production and plan to deliver slightly under 6,000 Model S vehicles in Q4, which increases our total expected deliveries to 21,500 vehicles worldwide for 2013. ASPs are expected to be relatively flat sequentially as we continue to see a rich mix of options on incoming orders.
Model S gross margin may continue to make slight improvements over the next several quarters as we continue to drive down manufacturing costs. While we expect to achieve our target of 25% non-GAAP automotive gross margin in Q4 (assuming no contribution from ZEV credits), further progress is likely if customers continue to purchase our vehicles with a high option take rate.
R&D expenses are expected to increase sequentially by about 25% in Q4 as we accelerate product development efforts on Model X and Model S enhancements. SG&A expenses are expected to rise sequentially by about 20%, driven by the growth in our retail locations, service centers and Supercharger facilities.
We expect our non-GAAP profitability to be about consistent with Q3, with approximately 139 million fully diluted shares outstanding based on the current level of our stock price. Free cash flow is expected to be close to breakeven.
We expect to spend about $75 to $85 million on capital expenditures for a total of approximately $250 million in 2013, as we expand our factory production capability and customer support infrastructure. All these investments, funded in part by our profitable operations, position us for further expansion of our product portfolio and global growth.
We plan to share further details of our 2014 plan when we report Q4 results early next year.

|

|
|
| Elon Musk, Chairman & CEO | Deepak Ahuja, Chief Financial Officer | |
Webcast Information
Tesla will provide a live webcast of its third quarter 2013 financial results conference call beginning at 2:30 p.m. PT on November 5, 2013, at ir.teslamotors.com. This webcast will also be available for replay for approximately one year thereafter.
Non-GAAP Financial Information
Consolidated financial information has been presented in accordance with GAAP as well as on a non-GAAP basis. On a non-GAAP basis, financial measures exclude non-cash items such as stock-based compensation, the change in fair value related to Teslas warrant liability, non-cash interest expense related to Teslas 1.5% convertible senior notes as well as one-time expenses associated with the early repayment of the Department of Energy Loan. Non-GAAP financial measures also exclude the impact of lease accounting on Model S related revenues and cost of revenues, as this perspective is useful in understanding the underlying cash flow activity and timing of vehicle deliveries. Management believes that it is useful to supplement its GAAP financial statements with this non-GAAP information because management uses such information internally for its operating, budgeting and financial planning purposes. These non-GAAP financial measures also facilitate managements internal comparisons to Teslas historical performance as well as comparisons to the operating results of other companies. Non-GAAP information is not prepared under a comprehensive set of accounting rules and therefore, should only be read in conjunction with financial information reported under U.S. GAAP when understanding Teslas operating performance. A reconciliation between GAAP and non-GAAP financial information is provided below.
Forward-Looking Statements
Certain statements in this shareholder letter, including statements in the Q4 Outlook section of this Shareholder Letter; statements regarding profitability and free cash flow in Q4 2013 and cost reduction efforts; statements relating to the progress Tesla is making with respect to product development, Asian launch expectations, schedule for the introduction of future options and variants, quality improvements, delivery and volume expectations of Model S; the ability to achieve vehicle demand, volume, revenue, gross margin, spending, profitability and cash flow targets; and future store, service center and Tesla Supercharger expected costs, openings and expansion plans are forward-looking statements that are subject to risks and uncertainties. These forward-looking statements are based on managements current expectations, and as a result of certain risks and uncertainties, actual results may differ materially from those projected. The following important factors, without limitation, could cause actual results to differ materially from those in the forward-looking statements: Teslas future success depends on its ability to design and achieve market acceptance of Model S and other new vehicle models, specifically Model X; the risk of delays in the manufacture, production and delivery ramp of Model S vehicles; the ability of suppliers to meet quality and part delivery expectations at increasing volumes; Teslas ability to continue to reduce or control manufacutring and other costs; consumers willingness to adopt electric vehicles; competition in the automotive market generally and the alternative fuel vehicle market in particular; Teslas ability to establish, maintain and strengthen the Tesla brand; the unavailability, reduction or elimination of governmental and economic incentives for electric vehicles; Teslas ability to establish, maintain and strengthen its relationships with strategic partners such as Daimler, Toyota and Panasonic; and Teslas ability to execute on its retail strategy and for new store, service center and Tesla Supercharger openings. More information on potential factors that could affect the Companys financial results is included from time to time in Teslas Securities and Exchange Commission filings and reports, including the risks identified under the section captioned Risk Factors in our quarterly report on Form 10-Q filed with the SEC on August 9, 2013. Tesla disclaims any obligation to update information contained in these forward-looking statements whether as a result of new information, future events, or otherwise.
| Investor Relations Contact: | Press Contact: | |||
| Jeff Evanson | Liz Jarvis-Shean | |||
| VP Investor Relations Tesla Motors | Communications Tesla Motors | |||
| ir@teslamotors.com | ejs@teslamotors.com |
For additional information, please visit ir.teslamotors.com.
Tesla Motors, Inc.
Condensed Consolidated Statements of Operations
(Unaudited)
(In thousands, except per share data)
| Three Months Ended | Nine Months Ended | |||||||||||||||||||
|
Sept 30, 2013 |
June 30, 2013 |
Sept 30, 2012 |
Sept 30, 2013 |
Sept 30, 2012 |
||||||||||||||||
| Revenues |
||||||||||||||||||||
| Automotive sales (1A) |
$ | 430,196 | $ | 401,535 | $ | 50,023 | $ | 1,386,934 | $ | 91,323 | ||||||||||
| Development services |
1,150 | 3,604 | 81 | 11,343 | 15,601 | |||||||||||||||
|
|
|
|
|
|
|
|
|
|
|
|||||||||||
| Total revenues |
431,346 | 405,139 | 50,104 | 1,398,277 | 106,924 | |||||||||||||||
|
|
|
|
|
|
|
|
|
|
|
|||||||||||
| Cost of revenues |
||||||||||||||||||||
| Automotive sales (1B) |
324,883 | 303,599 | 58,865 | 1,090,300 | 92,947 | |||||||||||||||
| Development services |
3,595 | 1,057 | | 8,304 | 7,767 | |||||||||||||||
|
|
|
|
|
|
|
|
|
|
|
|||||||||||
| Total cost of revenues (2) |
328,478 | 304,656 | 58,865 | 1,098,604 | 100,714 | |||||||||||||||
|
|
|
|
|
|
|
|
|
|
|
|||||||||||
| Gross profit (loss) |
102,868 | 100,483 | (8,761 | ) | 299,673 | 6,210 | ||||||||||||||
| Operating expenses |
||||||||||||||||||||
| Research and development (2) |
56,351 | 52,312 | 61,901 | 163,523 | 205,146 | |||||||||||||||
| Selling, general and administrative (2) |
77,071 | 59,963 | 37,798 | 184,080 | 104,464 | |||||||||||||||
|
|
|
|
|
|
|
|
|
|
|
|||||||||||
| Total operating expenses |
133,422 | 112,275 | 99,699 | 347,603 | 309,610 | |||||||||||||||
|
|
|
|
|
|
|
|
|
|
|
|||||||||||
| Loss from operations |
(30,554 | ) | (11,792 | ) | (108,460 | ) | (47,930 | ) | (303,400 | ) | ||||||||||
| Interest income |
68 | 39 | 38 | 97 | 203 | |||||||||||||||
| Interest expense |
(6,492 | ) | (20,116 | ) | (78 | ) | (26,705 | ) | (228 | ) | ||||||||||
| Other income (expense), net (3) |
(740 | ) | 1,668 | (2,188 | ) | 18,018 | (2,573 | ) | ||||||||||||
|
|
|
|
|
|
|
|
|
|
|
|||||||||||
| Loss before income taxes |
(37,718 | ) | (30,201 | ) | (110,688 | ) | (56,520 | ) | (305,998 | ) | ||||||||||
| Provision for income taxes |
778 | 301 | 116 | 1,230 | 284 | |||||||||||||||
|
|
|
|
|
|
|
|
|
|
|
|||||||||||
| Net loss |
$ | (38,496 | ) | $ | (30,502 | ) | $ | (110,804 | ) | $ | (57,750 | ) | $ | (306,282 | ) | |||||
|
|
|
|
|
|
|
|
|
|
|
|||||||||||
| Net loss per common share, basic and diluted (4)(5) |
$ | (0.32 | ) | $ | (0.26 | ) | $ | (1.05 | ) | $ | (0.49 | ) | $ | (2.91 | ) | |||||
|
|
|
|
|
|
|
|
|
|
|
|||||||||||
| Shares used in per share calculation, basic and diluted (4)(5) |
121,862 | 118,194 | 105,556 | 118,282 | 105,196 | |||||||||||||||
|
|
|
|
|
|
|
|
|
|
|
|||||||||||
| Notes: |
||||||||||||||||||||
| (1) Due to the application of lease accounting for Model S vehicles with the resale value guarantee, the following is supplemental information for the periods presented: |
||||||||||||||||||||
| (A) Net increase in deferred revenue and other long-term liabilities as a result of lease accounting and therefore not recognized in automotive sales |
$ | 171,229 | $ | 146,812 | $ | 318,041 | ||||||||||||||
|
|
|
|
|
|
|
|||||||||||||||
| (B) Net increase in operating lease vehicles as a result of lease accounting and therefore not recognized in automotive cost of sales |
$ | 138,839 | $ | 123,919 | $ | 262,758 | ||||||||||||||
|
|
|
|
|
|
|
|||||||||||||||
| Under lease accounting, warranty costs are expensed as incurred instead of accrued at the time of sale. |
||||||||||||||||||||
| (2) Includes stock-based compensation expense of the following for the periods presented: |
||||||||||||||||||||
| Cost of revenues | $ | 3,017 | $ | 1,063 | $ | 471 | $ | 5,616 | $ | 556 | ||||||||||
| Research and development | 8,707 | 8,565 | 6,356 | 24,916 | 19,421 | |||||||||||||||
| Selling, general and administrative | 9,715 | 9,631 | 5,648 | 25,034 | 15,752 | |||||||||||||||
|
|
|
|
|
|
|
|
|
|
|
|||||||||||
| Total stock-based compensation expense |
$ | 21,439 | $ | 19,259 | $ | 12,475 | $ | 55,566 | $ | 35,729 | ||||||||||
|
|
|
|
|
|
|
|
|
|
|
|||||||||||
| (3) Other income (expense), net, for the nine months ended September 30, 2013 includes the gain from the elimination of the $10.7 million Department of Energy (DoE) common stock warrant liability and a $7.3 million favorable foreign currency exchange impact. |
||||||||||
| (4) In May 2013, the Company completed a public offering pursuant to which the Company sold 3,902,862 shares of common stock. Concurrent with the closing of the offering, the Company sold 596,272 shares of common stock to Elon Musk in a private placement at the public offering price. |
||||||||||
| (5) In October 2012, the Company completed a public offering pursuant to which the Company sold 7,964,601 shares of common stock. |
||||||||||
Tesla Motors, Inc.
Condensed Consolidated Balance Sheets
(Unaudited)
(In thousands)
| Sept 30, 2013 |
Dec 31, 2012 |
|||||||
| Assets |
||||||||
| Cash and cash equivalents |
$ | 795,116 | $ | 201,890 | ||||
| Restricted cash - current |
1,265 | 19,094 | ||||||
| Accounts receivable |
47,580 | 26,842 | ||||||
| Inventory |
347,545 | 268,504 | ||||||
| Prepaid expenses and other current assets |
27,260 | 8,438 | ||||||
| Operating lease vehicles, net (1) |
268,824 | 10,071 | ||||||
| Property and equipment, net |
654,482 | 552,229 | ||||||
| Restricted cash - noncurrent |
8,110 | 5,159 | ||||||
| Other assets |
16,027 | 21,963 | ||||||
|
|
|
|
|
|||||
| Total assets |
$ | 2,166,209 | $ | 1,114,190 | ||||
|
|
|
|
|
|||||
| Liabilities and Stockholders Equity |
||||||||
| Accounts payable and accrued liabilities |
$ | 376,970 | $ | 343,180 | ||||
| Deferred revenue (2) |
195,037 | 4,964 | ||||||
| Customer deposits |
140,277 | 138,817 | ||||||
| Common stock warrant liability |
| 10,692 | ||||||
| Capital lease obligations |
16,902 | 14,330 | ||||||
| Long-term debt (4) |
582,502 | 452,337 | ||||||
| Other long-term liabilities (3) |
212,858 | 25,170 | ||||||
|
|
|
|
|
|||||
| Total liabilities |
1,524,546 | 989,490 | ||||||
| Convertible debt (4) |
77,498 | | ||||||
| Stockholders equity |
564,165 | 124,700 | ||||||
|
|
|
|
|
|||||
| Total liabilities and stockholders equity |
$ | 2,166,209 | $ | 1,114,190 | ||||
|
|
|
|
|
|||||
| Notes: |
||||||||
| (1) Includes the following increase in operating lease vehicles related to deliveries of Model S with the resale value guarantee and subject to lease accounting, net of depreciation recognized in automotive cost of sales, for the following periods: |
||||||||
| Q2 2013 |
$ | 123,919 | ||||||
| Q3 2013 |
138,839 | |||||||
|
|
|
|||||||
| Net increase during the nine months ended September 30, 2013 |
$ | 262,758 | ||||||
|
|
|
|||||||
| (2) Includes the following increase in deferred revenue related to deliveries of Model S with the resale value guarantee and subject to lease accounting, net of revenue amortized to automotive sales for the following periods: |
||||||||
| Q2 2013 |
$ | 74,455 | ||||||
| Q3 2013 |
84,577 | |||||||
|
|
|
|||||||
| Net increase during the nine months ended September 30, 2013 |
$ | 159,032 | ||||||
|
|
|
|||||||
| (3) Includes the following increase in other long-term liabilities related to deliveries of Model S with the resale value guarantee and subject to lease accounting for the following periods: |
||||||||
| Q2 2013 |
$ | 72,357 | ||||||
| Q3 2013 |
86,652 | |||||||
|
|
|
|||||||
| Net increase during the nine months ended September 30, 2013 |
$ | 159,009 | ||||||
|
|
|
|||||||
| (4) Our common stock price exceeded the conversion threshold price of our convertible senior notes due 2018 (Notes) issued in May 2013; therefore, the Notes are convertible at the holders option during the fourth quarter of 2013. As such, the carrying value of the Notes was classified as a current liability as of September 30, 2013 and the difference between the principal amount and the carrying value of the Notes was reflected as convertible debt in mezzanine equity on our condensed consolidated balance sheet as of September 30, 2013. |
Tesla Motors, Inc.
Supplemental Consolidated Financial Information
(Unaudited)
(In thousands)
| Three Months Ended | Nine Months Ended | |||||||||||||||||||
|
Sept 30, 2013 |
June 30, 2013 |
Sept 30, 2012 |
Sept 30, 2013 |
Sept 30, 2012 |
||||||||||||||||
| Selected Cash Flow Information |
||||||||||||||||||||
| Cash flows provided by (used in) operating activities |
$ | 102,343 | $ | (38,194 | ) | $ | (101,026 | ) | $ | 128,232 | $ | (228,590 | ) | |||||||
| Cash flows used in investing activities |
(77,501 | ) | (27,173 | ) | (64,014 | ) | (159,912 | ) | (146,173 | ) | ||||||||||
| Cash flows provided by financing activities |
24,216 | 597,007 | 40,179 | 624,906 | 205,190 | |||||||||||||||
| Other Selected Financial Information |
||||||||||||||||||||
| Cash flows provided by (used in) operating activities |
$ | 102,343 | $ | (38,194 | ) | $ | (101,026 | ) | $ | 128,232 | $ | (228,590 | ) | |||||||
| Capital expenditures |
(76,548 | ) | (40,514 | ) | (62,398 | ) | (174,790 | ) | (175,175 | ) | ||||||||||
|
|
|
|
|
|
|
|
|
|
|
|||||||||||
| Free cash flow (cash flow from operations plus capital expenditures) |
$ | 25,795 | $ | (78,708 | ) | $ | (163,424 | ) | $ | (46,558 | ) | $ | (403,765 | ) | ||||||
|
|
|
|
|
|
|
|
|
|
|
|||||||||||
| Depreciation and amortization |
$ | 28,449 | $ | 22,199 | $ | 7,521 | $ | 68,498 | $ | 16,033 | ||||||||||
|
Sept 30, 2013 |
June 30, 2013 |
Sept 30, 2012 |
||||||||||||||||||
| Cash and Investments |
||||||||||||||||||||
| Cash and cash equivalents |
$ | 795,116 | $ | 746,057 | $ | 85,693 | ||||||||||||||
| Restricted cash - current |
1,265 | 1,362 | 22,861 | |||||||||||||||||
| Restricted cash - noncurrent |
8,110 | 7,059 | 4,688 | |||||||||||||||||
Tesla Motors, Inc.
Reconciliation of GAAP to Non-GAAP Financial Information
(Unaudited)
(In thousands, except per share data)
| Three Months Ended | Nine Months Ended | |||||||||||||||||||
|
Sept 30, 2013 |
June 30, 2013 |
Sept 30, 2012 |
Sept 30, 2013 |
Sept 30, 2012 |
||||||||||||||||
| Revenues (GAAP) |
$ | 431,346 | $ | 405,139 | $ | 50,104 | $ | 1,398,277 | $ | 106,924 | ||||||||||
| Model S revenue deferred due to lease accounting |
171,229 | 146,812 | | 318,041 | | |||||||||||||||
|
|
|
|
|
|
|
|
|
|
|
|||||||||||
| Revenues (Non-GAAP) |
$ | 602,575 | $ | 551,951 | $ | 50,104 | $ | 1,716,318 | $ | 106,924 | ||||||||||
|
|
|
|
|
|
|
|
|
|
|
|||||||||||
| Gross profit (loss) (GAAP) |
$ | 102,868 | $ | 100,483 | $ | (8,761 | ) | $ | 299,673 | $ | 6,210 | |||||||||
| Model S gross profit deferred due to lease accounting (1) |
28,732 | 19,349 | | 48,082 | | |||||||||||||||
| Stock-based compensation expense |
3,017 | 1,063 | 471 | 5,616 | 556 | |||||||||||||||
|
|
|
|
|
|
|
|
|
|
|
|||||||||||
| Gross profit (loss) (Non-GAAP) |
$ | 134,617 | $ | 120,895 | $ | (8,290 | ) | $ | 353,371 | $ | 6,766 | |||||||||
|
|
|
|
|
|
|
|
|
|
|
|||||||||||
| Research and development expenses (GAAP) |
$ | 56,351 | $ | 52,312 | $ | 61,901 | $ | 163,523 | $ | 205,146 | ||||||||||
| Stock-based compensation expense |
(8,707 | ) | (8,565 | ) | (6,356 | ) | (24,916 | ) | (19,421 | ) | ||||||||||
|
|
|
|
|
|
|
|
|
|
|
|||||||||||
| Research and development expenses (Non-GAAP) |
$ | 47,644 | $ | 43,747 | $ | 55,545 | $ | 138,607 | $ | 185,725 | ||||||||||
|
|
|
|
|
|
|
|
|
|
|
|||||||||||
| Selling, general and administrative expenses (GAAP) |
$ | 77,071 | $ | 59,963 | $ | 37,798 | $ | 184,080 | $ | 104,464 | ||||||||||
| Stock-based compensation expense |
(9,715 | ) | (9,631 | ) | (5,648 | ) | (25,034 | ) | (15,752 | ) | ||||||||||
|
|
|
|
|
|
|
|
|
|
|
|||||||||||
| Selling, general and administrative expenses (Non-GAAP) |
$ | 67,356 | $ | 50,332 | $ | 32,150 | $ | 159,046 | $ | 88,712 | ||||||||||
|
|
|
|
|
|
|
|
|
|
|
|||||||||||
| Net loss (GAAP) |
$ | (38,496 | ) | $ | (30,502 | ) | $ | (110,804 | ) | $ | (57,750 | ) | $ | (306,282 | ) | |||||
| Stock-based compensation expense |
21,439 | 19,259 | 12,475 | 55,566 | 35,729 | |||||||||||||||
| Change in fair value of warrant liability |
| | 1,205 | (10,692 | ) | 896 | ||||||||||||||
| Non-cash interest expense related to convertible notes |
4,260 | 1,791 | | 6,051 | | |||||||||||||||
| Early extinguishment of DoE loans |
| 16,386 | | 16,386 | | |||||||||||||||
|
|
|
|
|
|
|
|
|
|
|
|||||||||||
| Net income (loss) (Non-GAAP) including lease accounting |
(12,797 | ) | 6,934 | (97,124 | ) | 9,561 | (269,657 | ) | ||||||||||||
|
|
|
|
|
|
|
|
|
|
|
|||||||||||
| Model S gross profit deferred due to lease accounting (1) |
28,732 | 19,349 | | 48,082 | | |||||||||||||||
|
|
|
|
|
|
|
|
|
|
|
|||||||||||
| Net income (loss) (Non-GAAP) |
$ | 15,935 | $ | 26,283 | $ | (97,124 | ) | $ | 57,643 | $ | (269,657 | ) | ||||||||
|
|
|
|
|
|
|
|
|
|
|
|||||||||||
| Net loss per common share, basic (GAAP) |
$ | (0.32 | ) | $ | (0.26 | ) | $ | (1.05 | ) | $ | (0.49 | ) | $ | (2.91 | ) | |||||
| Stock-based compensation expense |
0.18 | 0.16 | 0.12 | 0.47 | 0.34 | |||||||||||||||
| Change in fair value of warrant liability |
| | 0.01 | (0.09 | ) | 0.01 | ||||||||||||||
| Non-cash interest expense related to convertible notes |
0.03 | 0.02 | | 0.05 | | |||||||||||||||
| Early extinguishment of DoE loans |
| 0.14 | | 0.14 | | |||||||||||||||
| Model S gross profit deferred due to lease accounting (1) |
0.24 | 0.16 | | 0.41 | | |||||||||||||||
|
|
|
|
|
|
|
|
|
|
|
|||||||||||
| Net income (loss) per common share, basic (Non-GAAP) |
$ | 0.13 | $ | 0.22 | $ | (0.92 | ) | $ | 0.49 | $ | (2.56 | ) | ||||||||
|
|
|
|
|
|
|
|
|
|
|
|||||||||||
| Shares used in per share calculation, basic (GAAP and Non-GAAP) |
121,862 | 118,194 | 105,556 | 118,282 | 105,196 | |||||||||||||||
|
|
|
|
|
|
|
|
|
|
|
|||||||||||
| Net loss per share, diluted (GAAP) |
$ | (0.28 | ) | $ | (0.23 | ) | $ | (1.05 | ) | $ | (0.44 | ) | $ | (2.91 | ) | |||||
| Stock-based compensation expense |
0.16 | 0.15 | 0.12 | 0.42 | 0.34 | |||||||||||||||
| Change in fair value of warrant liability |
| | 0.01 | (0.08 | ) | 0.01 | ||||||||||||||
| Non-cash interest expense related to convertible notes |
0.03 | 0.01 | | 0.05 | | |||||||||||||||
| Early extinguishment of DoE loans |
| 0.13 | | 0.12 | | |||||||||||||||
|
|
|
|
|
|
|
|
|
|
|
|||||||||||
| Net income (loss) (Non-GAAP) including lease accounting |
(0.09 | ) | 0.05 | (0.92 | ) | 0.07 | (2.56 | ) | ||||||||||||
|
|
|
|
|
|
|
|
|
|
|
|||||||||||
| Model S gross profit deferred due to lease accounting (1) |
0.21 | 0.15 | | 0.36 | | |||||||||||||||
|
|
|
|
|
|
|
|
|
|
|
|||||||||||
| Net income (loss) per share, diluted (Non-GAAP) |
$ | 0.12 | $ | 0.20 | $ | (0.92 | ) | $ | 0.44 | $ | (2.56 | ) | ||||||||
|
|
|
|
|
|
|
|
|
|
|
|||||||||||
| Shares used in per share calculation, diluted (Non-GAAP) |
137,131 | 130,503 | 105,556 | 131,878 | 105,196 | |||||||||||||||
|
|
|
|
|
|
|
|
|
|
|
|||||||||||
| (1) | Under GAAP, warranty costs are expensed as incurred for Model S vehicle deliveries with lease accounting. For Non-GAAP purposes, an estimated incremental warranty reserve of $5.0 million and $9.0 million is included for the three and nine months ended September 30, 2013, respectively. Additionally, stock-based compensation of $1.3 million and $1.8 million is excluded for non-GAAP purposes for the three and nine months ended September 30, 2013, respectively. |