Yahoo! Inc 10-K 2003-12-31
Sign in or join
Add a note by highlighting text or Replying to an existing note.
Add a note by highlighting text or Replying to an existing note.
SECURITIES AND EXCHANGE COMMISSION
Washington, D.C. 20549
FORM 10-K
ANNUAL REPORT PURSUANT TO SECTION 13 OR 15(d) OF THE
SECURITIES EXCHANGE ACT OF 1934
For the fiscal year ended December 31, 2003
Commission File Number 0-28018
YAHOO! INC.
(Exact name of Registrant as specified in its charter)
| Delaware | 77-0398689 | |
| (State or other jurisdiction of incorporation or organization) |
(I.R.S. Employer Identification No.) |
701 First Avenue
Sunnyvale, California 94089
(Address of principal executive offices)
Registrant's telephone number, including area code: (408) 349-3300
Securities registered pursuant to Section 12(b) of the Act:
None
Securities registered pursuant to Section 12(g) of the Act:
Common Stock, $.001 par value
(Title of Class)
Indicate by check mark whether the Registrant (1) has filed all reports required to be filed by Section 13 or 15(d) of the Securities Exchange Act of 1934 during the preceding 12 months (or for such shorter period that the Registrant was required to file such reports), and (2) has been subject to such filing requirements for the past 90 days. Yes /x/ No / /
Indicate by check mark if disclosure of delinquent filers pursuant to Item 405 of Regulation S-K is not contained herein, and will not be contained, to the best of Registrant's knowledge, in definitive proxy or information statements incorporated by reference in Part III of this Form 10-K or any amendment to this Form 10-K. /x/
Indicate by check mark whether the registrant is an accelerated filer (as defined in Rule 12b-2 of the Act). Yes /x/ No / /
As of June 30, 2003, the aggregate market value of voting stock held by non-affiliates of the Registrant, based upon the closing sales price for the Registrant's Common Stock, as reported in the NASDAQ National Market System, was $15,444,607,992. Shares of Common Stock held by each officer and director and by each person who owns five percent or more of the outstanding Common Stock have been excluded in that such persons may be deemed to be affiliates. This determination of affiliate status is not necessarily a conclusive determination for any other purpose.
The number of shares of the Registrant's Common Stock outstanding as of February 25, 2004 was 665,159,934.
DOCUMENTS INCORPORATED BY REFERENCE
The following documents (or parts thereof) are incorporated by reference into the following parts of this Form 10-K:
OVERVIEW
Yahoo! Inc., together with its consolidated subsidiaries, ("Yahoo!", "Our" or "We") is a leading provider of comprehensive Internet products and services to consumers and businesses through our worldwide network of online properties (the "Yahoo! network"). Yahoo! was developed and first made available in 1994 by our founders, David Filo and Jerry Yang, while they were graduate students at Stanford University. Yahoo! was incorporated in 1995 and is a Delaware corporation.
Headquartered in Sunnyvale, California, we have offices in North America, Europe, Asia, Latin America and Australia. We manage our business geographically; our principal areas of measurement and decision-making are the United States and International. Our properties and services for consumers and businesses currently reside in four areas: Search and Marketplace; Information and Content; Communications and Consumer Services; and Affiliate Services. Our basic products and service offerings are available without charge to our users. We also offer a variety of fee-based premium services that provide our users access to value-added content or services. In addition, we sell marketing and advertising services to businesses across the majority of our properties and services.
During 2003, we completed the acquisitions of Inktomi Corporation ("Inktomi") and Overture Services, Inc. ("Overture") in March and October, respectively. Inktomi is a provider of Web search and paid inclusion services on the Internet. Overture is a provider of commercial search services on the Internet, including pay-for-performance search services. Since inception, we have acquired several other companies including those that provided databases, software, technologies, content, and/or tools to develop and expand upon our network of properties and services.
We generate multiple sources of revenue across these properties and services that are classified as: Marketing Services, Fees and Listings. The following table presents an overview of our financial reporting structure as well as our properties and services.
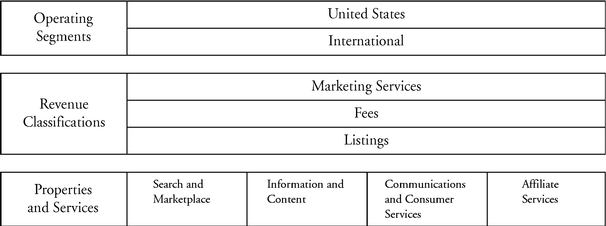
PROPERTIES AND SERVICES
Our properties and service offerings are generally available without charge to our users. We generate revenues from marketing and listing services, and also offer fee-based premium services that provide our users access to additional content or services.
Search and Marketplace
Our Search and Marketplace properties focus on being the starting point for consumers and businesses looking for information and looking to purchase products and services. The properties include the following:
2
Search
Yahoo! Search offers users a highly relevant, comprehensive, fast and easy-to-use search experience on the Internet. Our search properties are a gateway to the properties and services within the Yahoo! network. Using complex search engine algorithms, Yahoo! Search provides users with free Web-wide search results prioritized based on relevance. Our Yahoo! Search also offers a hierarchical, subject-based directory of Websites. Users can access directory listings by browsing through subject matter or using the keyword search function.
We generate revenue primarily by providing enhanced placement of our customers' Websites in our search results. Additionally, we generate revenue through our paid inclusion service, which guarantees that our customers' Websites are included in the Web search index, and through fees generated from customers who use our Web search services and incorporate the search results we provide into their online offerings to end users. See "Affiliate Services" below for further explanation.
Local
Yahoo! Local is comprised of four comprehensive offerings of local information, available free to users Yahoo! Yellow Pages, Yahoo! Maps, Yahoo! City Guides, and Yahoo! Real Estate. Yahoo! Yellow Pages enables users to connect to local and national merchants in the United States. Yahoo! Yellow Page business listings can be displayed by proximity to the user's location. Businesses can pay to have their listings placed in the Sponsored Business section above regular non-paid listings. Yahoo! Maps provides interactive maps with zooming and other capabilities and integrated driving directions. Yahoo! City Guides offers information on local arts and entertainment news and events. Yahoo! Real Estate offers free services to our users including: information for prospective home buyers and sellers; the ability to search for listed properties based on geography, price and features; moving-related content and services; information about finding a real estate agent, researching neighborhoods, financing and insurance, and home improvement ideas; and assistance in locating rentals and roommates. Users can also pay to list a property.
Autos
Yahoo! Autos offers information about buying, selling, leasing and owning automobiles. Services available free to our users include new and used car searches; pricing, specification, insurance, general financing, and other research information; and new car quote referral services provided through third parties.
Shopping/Auctions
The Yahoo! Shopping platform provides, free of charge to users, search functionality and comparison-shopping tools making it easy for consumers to find, research, compare and conveniently buy almost anything online including consumer electronics, apparel, books and flowers. Yahoo! Shopping combines comprehensive product search functionality with a full suite of comparison shopping, merchant rating and product review tools. Yahoo! Shopping connects buyers and sellers, and is a starting point for online commerce.
Yahoo! Auctions creates a marketplace for buyers and both individual and corporate sellers who wish to purchase or sell goods in an auction-style setting. Yahoo! Auctions connects buyers and sellers, generating revenue through listing fees and revenue share of the final selling value from sellers, and is available free of charge to buyers.
Travel
Yahoo! Travel provides research and booking functionality for consumers to find, compare and conveniently buy leisure travel products such as flights, hotel rooms, vacation packages and cruises. Yahoo! Travel generates revenue through transactions fees and advertising from travel suppliers and advertisers.
3
Careers
Our Yahoo! HotJobs ("HotJobs") property is a leader in the online recruiting industry, providing comprehensive solutions for employers, staffing firms and job seekers. HotJobs' tools and advice put job seekers in control of their career search and make it easier and more cost-effective for recruiters and employers to find qualified candidates compared to offline alternatives. We provide services for job seekers, which include the ability to create a resume and to search and apply for jobs, as well as access to newsletters, online forums and salary research, free of charge. We generate revenues from employers and staffing firms that access our database of job seekers and use our tools to post, track and manage job openings. In addition to our popular consumer job board, HotJobs provides employers and staffing agencies with a variety of recruiting solutions, including hiring management software.
Small Business
Yahoo! Small Business provides a comprehensive suite of fee-based services that enable a company to develop an online presence (through Yahoo! Domains, Yahoo! Business Mail and Yahoo! Web Hosting), sell their products online (through Yahoo! Merchant Solutions) and market online by integrating offerings such as Yahoo! Shopping, pay-for-performance search and Yahoo! Yellow Pages.
Information and Content
Our Information and Content properties deliver information and entertainment to consumers. We offer basic content that is available without charge to our users, and also provide some of our content on a fee or subscription basis. Our properties provide information and content including the following:
Media
Yahoo! Sports provides up-to-the-minute news, real-time statistics and scoring, broadcast programming, localized and global coverage, integrated shopping and auctions opportunities, and an on-line sports community. Yahoo! Sports has content or marketing relationships with professional sports organizations including the National Basketball Association and the Major League Baseball Players Association, among others, as well as sports media outlets such as Sports Illustrated Interactive. Yahoo! Sports also offers fee-based fantasy games' sports statistic trackers and leagues and audio feeds.
LAUNCH, Music on Yahoo! is a comprehensive online music destination. LAUNCH provides music fans with access to a wide selection of streaming audio, music videos, artist interviews, music news, album reviews and artist biographies. In 2003, LAUNCH introduced a variety of fee-based music services such as concert ticket offerings and premium radio.
Yahoo! Games offers free, Java-based classic board, card and word games along with downloadable games, game strategy guides, shopping guides, gaming news and reviews on computer and console videogames. Yahoo! Games also offers a variety of fee-based premium downloads and subscriptions.
Finance
Yahoo! Finance provides a comprehensive set of financial resources from investment and company information to personalized financial management tools. Yahoo! Finance offers Money Manager, a free set of financial tools that provides an integrated view of an individual's financial life. In addition, Yahoo! Finance offers fee-based products, including a real-time stock quotes package, research reports and services to allow users to pay their bills online.
Entertainment
Yahoo! Movies offers a daily mix of exclusive movie-related content, movie news and special features, including box office results, trailers, and photo galleries, as well as links to the movie-related content across the Yahoo! network. Yahoo! Movies features paid-for film promotions for major movie studios, including Disney, Sony, Warner Bros., Universal and Fox. Yahoo! TV connects users to personalized television listings and other television-related content.
4
Information
Yahoo! News aggregates news stories from news providers, bringing together content from media companies such as Associated Press, Reuters, AFP, The Washington Post, USA Today, Tribune Interactive, National Public Radio, US News & World Report, and more. Through Yahoo! News, users receive up-to-the-minute news coverage with text, photos, audio and video, from multiple sources and points of view.
Yahooligans! is an entertaining and educational Web guide targeted for children ages seven to twelve. Yahooligans! provides games, instant messaging, reference materials and movie information, among others.
Yahoo! Health is a comprehensive starting point for users to find healthcare information. Yahoo! Health provides information and links to sites on diseases, conditions and medications, as well as listings for various health information centers, clinical trial information and online community tools.
Network Services
The Yahoo! Front Page (www.yahoo.com) serves as a free navigation hub and entry point into the Yahoo! network. Among many available features on the page are the ability to perform a Web search, read the latest news, link to Yahoo! sites, and view promotions from Yahoo!'s key advertising partners.
My Yahoo! is our free, personalized Web information service that allows registered members to create a personal profile which organizes and delivers information of personal interest to the user via a user-customized interface. The My Yahoo! platform allows us to deliver targeted product, advertising and transaction-based services on behalf of our advertisers and partners.
Yahoo! Companion is a free browser add-on that enables users to conveniently access our properties and services from anywhere on the Web.
Communications and Consumer Services
Our Communications and Consumer Services group provides a wide range of communication and content services to consumers and small businesses. The offerings are distributed both on the Yahoo! network and through our access alliances, including those with SBC Communications Inc. ("SBC") and British Telecommunications plc. ("BT"). These offerings incorporate a suite of integrated Yahoo! tools and services including safety and security features, communications tools, compelling content, and a customized Internet browser all in an individualized environment.
Premium Internet Packages
During 2002, we launched a strategic alliance with SBC to offer a co-branded Internet service to DSL (broadband) customers in SBC's 13-state region and to dial-up subscribers nationwide. The services offer consumers integrated access and premium services on a subscription basis, and include a suite of Yahoo! and SBC customized products and services. During 2003, we launched a similar alliance with BT offering co-branded DSL, dial, and email services in the United Kingdom. In December of 2003, Yahoo! also introduced Yahoo! Plus, a comprehensive premium Internet package for users with broadband Internet access. In early 2004, Yahoo! announced an alliance with Rogers Cable Inc., which will provide broadband Internet access bundled with Yahoo! products and services in Canada.
Communications
Yahoo! Mail is a free service that provides users with a full-featured email experience including industry-leading Spam control, robust address book functionality and integration with Yahoo! Calendar. In addition to our basic email service, we offer premium Mail products that include extra email storage, mail forwarding and the ability to use Yahoo! Mail with other client applications. Yahoo! Mail Plus, a premium mail product, offers a combination of these features plus enhanced junk mail control, increased virus protection and personalized stationery.
Yahoo! Messenger provides a platform for instantaneous communications for personal and business users. Users can interact with friends and family on a real-time basis while
5
customizing the experience via features such as IMVironments which allows users to change the messaging window background, animated emoticons, video Web cams and integrated mobile messaging. For a fee, Yahoo!'s Enterprise Edition Messenger extends the benefits of this instant communication to the workplace by adding an enhanced level of security and centralized administrative control. This service was formerly part of our Enterprise Solutions business along with Yahoo! Portal Solutions and Broadcast Solutions, which provided communications solutions to help businesses more easily aggregate and distribute business critical information and interact with their target audience. During 2003 we reduced our Yahoo! Portal Solutions and Broadcast Solutions efforts and reorganized Enterprise Edition Messenger into the Communications and Consumer Services group.
Yahoo! Photos makes it easy for a user to upload and store pictures, as well as share them with friends and family for free. For example, Yahoo! users can now view their pictures with a friend instantly using a specially designed Yahoo! Photos IMVironment. Users can also order prints with the click of a mouse as a premium service.
Our online Communities help users build and manage relationships and includes properties such as Yahoo! Groups, Chat, Member Directory, and Message Boards. Yahoo! Groups gives users a convenient way to connect with others who share the same interests and ideas through a Website and email group.
Personals
Yahoo! Personals allows users to post a profile and search for others with whom to communicate for free. Users can also send short one-time messages to others in the community to communicate their interest without charge. With a subscription, Yahoo! Personals' users can email and use Yahoo! Messenger to communicate with others in the community. Our Personals service includes online dating industry-leading features such as voice and video clips, and a special recommendations engine called "Likely Likables," which uses advanced search technology to bring similar people together in the community.
Mobile
Through paid arrangements with leading wireless carriers around the world, Yahoo! Mobile makes a range of Yahoo! products and services available through wireless phones and PDA's. Customers can access a variety of Yahoo! services for free, including email, instant messaging, and a wide range of information offerings on their mobile phones via wireless-specific browsers. Yahoo! also allows consumers to receive mobile alerts on a wide variety of interests from sports scores to breaking news to weather. In 2003, Yahoo! launched a number of innovative mobile features including PC-to-SMS (Short Message Service) messaging and Yahoo! Mobile Photos.
Affiliate Services
We offer pay-for-performance advertising, paid inclusion and algorithmic search services. These services connect advertisers and potential buyers through our network and our affiliates' Websites, networks of Web properties that have integrated Overture's search service into their Web pages. These services include:
Pay-For-Performance
Precision Match or keyword search prioritizes search results by the amount the advertiser has bid for placement. Advertisers are listed in the search results on our network and also on our affiliates' networks in descending order of their bid, with the highest bidder appearing as the first search listing in the search results. Bids may be expressed either as the amount the advertiser pays each time there is a click on the advertiser's search listing or as the maximum amount the advertiser is willing to pay for a click on the advertiser's search listing. Advertisers pay only when a click-through occurs on the advertiser's search listing. Advertisers may see the bids of other advertisers on their keywords, enabling the advertiser to determine his or her own bid necessary to achieve a desired ranking, which instills competition among advertisers and promotes greater relevance for consumers. Most advertisers utilize self-service tools to open and manage accounts online including tracking, bid management and measurement features.
6
Content Match allows businesses to place listings on more locations on the Web and drive more traffic to their sites. Content Match displays listings when Internet users are viewing related content on the Yahoo! network or our affiliates' pages. For example, if the user is reading an article about interest rates, he or she could find links on the side of the page for mortgage-related advertisers. Similarly, users who are researching vacation plans may see listings for hotels and rental car agencies.
Paid Inclusion
Paid Inclusion guarantees that our customers' Websites are included and frequently updated in the index that is crawled by the search engine. Customers may pay fees based on sales leads or click-throughs powered by our search services. Customers may also pay a fixed fee that provides inclusion in the Web search index and an automatic 48-hour refresh of the submitted content. Through our paid inclusion programs, customers submit information often not normally available by traditional Web crawling techniques and this information is included in our Web search index.
Algorithmic Search
Our Algorithmic Search services provide search results to some of our affiliates, who in turn incorporate these results into their online offerings to end users. Our search engine uses proprietary technology to crawl the Web, index and serve Web results on text-based queries. Customers pay per-query search fees based on query volume.
GEOGRAPHIC PROPERTIES
We seek to build upon our global user base by developing Internet properties and services focused on geographic regions, which include foreign countries as well as domestic metropolitan areas. We have launched numerous geographically targeted Web properties and search services. Additional information required by this item is incorporated herein by reference to Note 12 "Segments" of the Notes to the Consolidated Financial Statements, which appears in Item 8 of this Annual Report on Form 10-K.
Yahoo! Inc. and its subsidiaries provide products and services in 13 languages in over 20 countries, including localized versions of Yahoo! in Argentina, Australia & New Zealand, Brazil, Canada, China, France, Germany, Hong Kong, India, Italy, Japan, Korea, Mexico, Singapore, Spain, Taiwan and the United Kingdom & Ireland. We also provide services through Yahoo! Asia (our portal to southeast Asia), Yahoo! Chinese (U.S. Chinese language site), Yahoo! en Español (U.S. Hispanic site), Yahoo! Canada en Français (French Canadian) and Yahoo! en Català (part of Yahoo! Spain's Catalan language offerings). Outside the English-speaking markets, we have built independent directories of local language Websites and other content, developed by native speakers of each language. We own a majority or 100 percent of these non-U.S. operations (except in Japan), and have established offices internationally to facilitate the local development of these businesses. We have pursued a consistent strategy of content aggregation with leading third parties and currently plan to continue to rollout certain selected services for our international markets.
Our joint ventures with SOFTBANK and its affiliates, a holder of approximately four percent of our common stock as of December 31, 2003, include Yahoo! Germany, Yahoo! United Kingdom, Yahoo! France (collectively "Yahoo! Europe"), Yahoo! Japan and Yahoo! Korea. These joint ventures were formed to establish and manage local versions of our properties in the respective countries. With the exception of Yahoo! Japan, these joint ventures are operated and managed by us as a part of our global network. Yahoo! Japan is a publicly traded company in Japan that is majority owned by SOFTBANK. As of December 31, 2003, we owned approximately 70 percent of Yahoo! Europe, 34 percent of Yahoo! Japan and 67 percent of Yahoo! Korea. Yahoo! Europe and Yahoo! Korea are consolidated subsidiaries of Yahoo! Inc. The Company has no funding commitment to Yahoo! Japan. As of December 31, 2003, SOFTBANK and its affiliates owned the remaining interests in Yahoo! Europe and Yahoo! Korea not owned by Yahoo! and its affiliates.
REVENUE CLASSIFICATIONS
Marketing services revenue is primarily generated from the sale of rich media advertisements (banner and other media advertisements), sponsorship and text-link advertisements, (including pay-for-performance search advertisements), paid inclusion, algorithmic searches and transactions revenue. Banner and other media agreements typically consist of targeted and non-targeted advertising that appears on or around pages within the Yahoo! network. Sponsorship agreements take many forms including: high profile promotions that are typically focused on a particular event, such as a sweepstakes; third party branded content integration into our properties allowing marketers to provide information about their products to consumers; and
7
merchant sponsorship opportunities on targeted Yahoo! properties encouraging users to purchase the goods and services of our advertisers. Text-links and hypertext links are links that are embedded in certain words, advertisements, sponsorships or directed emails, which provide the user with instant access to the advertiser's Website, to obtain additional information or to purchase products and services. Additionally, we offer online research and data services, enabling marketers to better understand their customers profiles and behaviors. Transactions revenue includes service fees for facilitating transactions through the Yahoo! network.
Although a significant amount of advertising purchases on our properties are for general rotation on pages within the Yahoo! network, we also offer highly-targeted marketing opportunities that are designed to deliver greater value to advertisers through more focused audiences. By developing an extended family of Yahoo!-branded properties, we seek to offer advertisers a wide range of placement options and promotional opportunities. For example, through our pay-for-performance search advertisements, advertisers can bid for priority placement in search results. We also offer an integrated set of sales and marketing tools built on the Yahoo! network and delivered in an integrated manner to our global audience. They consist of innovative, interactive marketing programs designed to provide one-stop shopping for companies seeking to secure a measurable Internet presence.
We maintain three primary channels for selling our marketing services: online, telephone and direct. Our Sponsored Matches service, which provides enhanced visibility for Websites within Yahoo!'s search results, is primarily sold through our online and direct channels. Under this program, search results pages feature up to the top six pay-for-performance search listings sold to advertisers. Our telemarketing channel focuses on sales of online marketing services to small and medium-size businesses. Our direct advertising sales team focuses on selling our marketing services and solutions to leading agencies and marketers in the United States. As of December 31, 2003, we employed advertising sales professionals in 10 locations across the U.S., including: Atlanta, Boston, Chicago, Dallas, Detroit, the Los Angeles Area, Miami, New York, the San Francisco Bay Area and Washington D.C. Our advertising sales organization consults regularly with agencies and advertisers on design and placement of Web-based advertising, and provides clients with measurements and analyses of advertising effectiveness. In addition to our geographic sales structure, we have advertising sales teams for automotive, consumer packaged goods, entertainment, finance, retail, pharmaceuticals, sports, technology, telecommunications, travel and advertising agencies. In international markets, our own internal sales representatives handle our advertising sales. In some countries, where we have not established full operational capacity, we have established sales agency relationships.
Fees revenue consists of revenues generated from a variety of consumer and business fee-based services, including SBC Yahoo! DSL and SBC Yahoo! Dial, Yahoo! Personals, Small Business Services, Yahoo! Mail and Yahoo! Enterprise Solutions.
Listings revenue consists of revenues generated from a variety of consumer and business listings-based services, including access to the HotJobs database and classifieds, such as Yahoo! Autos, Yahoo! Real Estate and other search services. HotJobs career offerings are handled by a designated sales team.
COMPETITION
We operate in the market for Internet products and services, which is a highly competitive market characterized by rapid change, converging technologies, and increased competition from companies offering communication, information and entertainment integrated into other products and media properties.
Globally, our most significant competition is from Time Warner and Microsoft ("Microsoft" or "MSN"). Time Warner is an integrated media and communications company engaged in online services, cable, filmed entertainment, television network, music and publishing. Time Warner has access to a large potential customer base through its America Online ("AOL"), cable and publishing business units. Microsoft is the largest software company in the world and through its MSN network provides numerous Internet products and services and has alliances with companies involved with broadband access and various forms of digital interactivity. Microsoft's presence on computer desktops through packaged software products and their strategy to sell software through online subscriptions provides them a competitive advantage over us in providing software and services to online users. Both AOL and MSN have a direct billing relationship with a greater number of their users through access and other services
8
than we have with our users through certain of our premium services. This gives them a potential advantage over us in targeting the sale of enhanced services to their user base.
As a result of our recent acquisitions of Inktomi and Overture, we compete directly with other providers of Web search and related search services, including, among others, Ask Jeeves, Inc., Google Inc. and Looksmart, Ltd.
We also face competition from companies focused on markets where expertise in a particular segment of the market may provide them a competitive advantage over us. Two of these competitors, Amazon.com, Inc. and eBay Inc., are expanding their positions as e-commerce merchants to leverage advantages from the scale of their commerce platforms to offer informational and community features that are competitive with the services we provide.
Internationally, we compete with local portals that are predominantly supported by the local telecommunication providers, which gives them a potential competitive advantage over us because they typically already have a direct billing relationship with their users.
See the "Risk Factors" section below for additional information regarding competition.
PRODUCT DEVELOPMENT
We continually enhance existing services and develop new services to meet evolving consumer demand for technological innovation. Our domestic engineering and production teams are primarily located in our Sunnyvale, California headquarters and in Pasadena, California, Dallas, Texas and Bangalore, India. Locally-based teams handle most international production and engineering. We have developed internally, acquired or licensed the properties and services we offer.
INTELLECTUAL PROPERTY
We seek to protect our intellectual property through patent, copyright, trade secret and trademark law and through contractual restrictions, such as confidentiality agreements. We consider the Yahoo! trademark to be one of our most valuable assets and we have registered this trademark in the United States and other countries throughout the world.
EMPLOYEES
As of December 31, 2003, we had approximately 5,500 full-time employees. Our future success is substantially dependent on the performance of our senior management and key technical personnel, and our continuing ability to attract and retain highly qualified technical and managerial personnel. See the "Risk Factors" section below for a further discussion of certain risks related to our employees.
AVAILABLE INFORMATION
Yahoo!'s Website is located at http://www.yahoo.com. Yahoo! makes available free of charge, on or through its Website, its annual, quarterly and current reports, and any amendments to those reports, as soon as reasonably practicable after electronically filing such reports with the Securities and Exchange Commission ("SEC"). Information contained on Yahoo!'s Website is not part of this report or any other report filed with the SEC.
RISK FACTORS
If our competitors are more successful in attracting and retaining customers and users, then our revenues could decline.
We compete with many other providers of online navigation, Web search, commercial search, information, entertainment, business, recruitment, community, electronic commerce and Internet access services. As we expand the scope of our Internet offerings, we will compete directly with a greater number of Internet sites, media companies, and companies providing business services across a wide range of different online services, including:
9
In order to compete effectively, we may need to expend significant internal engineering resources or acquire other technologies and companies to provide or enhance our capabilities. If we are unable to maintain or expand our customer and user base in the future, our revenues may decline.
Companies such as Time Warner's AOL and Microsoft may have a competitive advantage because they have greater access to content, maintain billing relationships with more customers and have access to established distribution networks.
We face significant competition from Time Warner's America Online business ("AOL" or "America Online") and Microsoft ("Microsoft" or "MSN"). The combination of America Online and Time Warner provides America Online with content from Time Warner's movie and television, music, books and periodicals, news, sports and other media holdings; access to a network of cable and other broadband delivery technologies; and considerable resources for future growth and expansion. The America Online/Time Warner combination also provides America Online with access to a broad potential customer base consisting of Time Warner's current customers and subscribers of its various media properties. To a less significant extent, we also face competition from other companies that have combined a variety of services under one brand in a manner similar to Yahoo!. In certain of these cases, most notably AOL and MSN, our competition has a direct billing relationship with a greater number of their users through access and other services than we have with our users through certain of our premium services. This relationship permits our competitors to have several potential advantages including the potential to be more effective than us in targeting services and advertisements to the specific taste of their users.
Our recent acquisitions of Inktomi and Overture expose our business to greater competition in the area of algorithmic Web search and paid inclusion services.
In March 2003 we completed our acquisition of Inktomi Corporation ("Inktomi"), a provider of algorithmic Web search and paid inclusion services. In addition, we completed our acquisition of Overture Services, Inc. ("Overture") in October 2003, increasing our algorithmic Web search and paid inclusion business through Overture's Alta Vista and Fast Search & Transfer Web search businesses. As a result of these acquisitions, we compete directly with other providers of Web search and related search services, including, among others, AskJeeves, Inc., Google Inc, and LookSmart, Ltd. Some of these competitors may have longer operating histories focusing on providing Web search services, larger customer or user bases and greater brand recognition for their Web search businesses. In addition to the general acquisition risks highlighted in these risk factors, we are subject to the risk that other companies with greater operational, strategic, financial, personnel or other resources may choose to enter the Web search or paid inclusion spaces by acquisition or internal development, and may create greater competition for advertisers, customers and users.
If Overture fails to maintain its advertiser, user, business and affiliate constituencies, our revenues could significantly decline and our business could be adversely affected.
Overture's pay-for-performance search service is comprised of advertiser-generated listings, which are screened for relevance and accessed by users and businesses through the Yahoo! properties and through Overture's affiliates, a network of other Web properties that have integrated Overture's search service into their sites or that direct user traffic to Overture's sites. The search listings are ranked according to the advertiser's bid; that is, the higher the bid, the higher the ranking. Advertisers pay Overture the bid price for clicks on the advertiser's search listing (also known as a paid introduction, click-through or a paid click). Overture's success in pay-for-performance search services depends in part on the maintenance of a critical mass of advertisers, users, and traffic generated by the Yahoo! properties and Overture's affiliates. Such a critical mass encourages increased participation in Overture's paid placement search marketplace. To the extent Overture experiences a decline in the number of any of these constituents, the value of Overture's paid placement service could be harmed, and our revenues or business could be adversely affected.
Our recent acquisition of Overture exposes our business to greater competition with providers of pay-for-performance advertising search services.
As a result of our acquisition of Overture, we compete directly with other providers of pay-for-performance advertising services that are similar to Overture's, including Espotting Media, Inc. (which is under agreement to be acquired by FindWhat), FindWhat.com, Google Inc, LookSmart, Ltd., and Terra Lycos. In addition, we believe it is likely that there will be additional entrants to the pay-for-performance search market. Some of these entrants
10
may have greater operational, strategic, financial, personnel or other resources than we do, as well as greater brand recognition. These competitors compete against Overture for affiliate arrangements and could cause Overture to enter into affiliate arrangements with less favorable terms, lose current affiliates or not acquire new affiliates, which could reduce the number of click-throughs, increase the amount of revenue shared with affiliates, and reduce total revenues and thereby harm our business, operating results and financial condition.
Acquisitions could result in operating difficulties.
As part of our business strategy, we acquired Inktomi in March 2003, Overture in October 2003, 3721 Network Software Company Limited ("3721") in January 2004, and have completed several other acquisitions since inception. We expect to enter into additional business combinations and acquisitions in the future. Acquisitions may result in dilutive issuances of equity securities, use of our cash resources, incurrence of debt and amortization of expenses related to intangible assets. The acquisitions of Inktomi, Overture and 3721 were accompanied by a number of risks, including:
We may experience similar risks in connection with our future acquisitions. We may not be successful in addressing these risks or any other problems encountered in connection with the acquisitions of Overture, Inktomi and 3721 or that we could encounter in future acquisitions, which would harm our business or cause us to fail to realize the anticipated benefits of our acquisitions.
We may be subject to intellectual property infringement claims, which are costly to defend and could limit our ability to provide certain content or use certain technologies in the future.
Many parties are actively developing search, indexing, electronic commerce and other Web-related technologies, as well as a variety of online business models and methods. We believe that these parties will continue to take steps to protect these technologies, including, but not limited to, seeking patent protection. As a result, disputes regarding the ownership of these technologies and rights associated with online business are likely to arise in the future. In addition to existing patents and intellectual property rights, we anticipate that additional third-party patents related to our services will be issued in the future. From time to time, parties assert patent infringement claims against us in the form of letters, lawsuits and other forms of communications. Currently, we are engaged in several lawsuits regarding patent issues and have been notified of a number of other potential disputes. We expect that we will increasingly be subject to patent litigation as our services expand.
In addition to patent claims, third parties have asserted and most likely will continue to assert claims against us alleging infringement of copyrights, trademark rights, trade secret rights or other proprietary rights, or alleging unfair competition or violations of privacy rights. Currently, our subsidiary LAUNCH Media, Inc. ("LAUNCH") is engaged in a lawsuit regarding copyright issues that commenced prior to our acquisition of LAUNCH. In addition, Overture is in litigation with several companies, each of which has claimed that allowing advertisers to bid on certain search terms constitutes trademark infringement.
11
In the event that there is a determination that we have infringed third-party proprietary rights such as patents, copyrights, trademark rights, trade secret rights or other third party rights such as publicity and privacy rights, we could incur substantial monetary liability, be required to enter into costly royalty or licensing agreements, if available, or be prevented from using the rights, which could require us to change our business practices in the future. We may also incur substantial expenses in defending against third-party infringement claims regardless of the merit of such claims. As a result, these claims could harm our business.
Our intellectual property rights are valuable and any inability to protect them could dilute our brand image or harm our business.
We regard our copyrights, patents, trademarks, trade dress, trade secrets, and similar intellectual property, including our rights to certain domain names, as important to Yahoo!'s success. Effective trademark, patent, copyright, and trade secret protection may not be available in every country in which our products and media properties are distributed or made available through the Internet. Further, the efforts we have taken to protect our proprietary rights may not be sufficient or effective. If we are unable to protect our trademarks from unauthorized use, our brand image may be harmed. While we attempt to ensure that the quality of our brand is maintained by our licensees, our licensees may take actions that could impair the value of our proprietary rights or the reputation of our products and media properties. We are aware that third parties have, from time to time, copied significant content available on Yahoo! for use in competitive Internet services. Protection of the distinctive elements of Yahoo! may not be available under copyright law. Any impairment of our brand image could harm our business and cause our stock price to decline. In addition, protecting our intellectual property and other proprietary rights can be expensive. Any increase in the unauthorized use of our intellectual property could make it more expensive to do business and consequently harm our operating results. In turn, this could harm the results of our business and lower our stock price.
Our international segment competes with local Internet service providers that may have a competitive advantage.
On an international level, we compete directly with local ISPs; they may have several advantages, including greater knowledge about the particular country or local market and access to significant financial or strategic resources in such local markets. We must continue to improve our product offerings, obtain more knowledge about our users and their preferences, deepen our relationships with our users as well as increase our branding and other marketing activities in order to remain competitive and strengthen our international market position.
Financial results for any particular period will not predict results for future periods.
There can be no assurance that the purchasing pattern of customers advertising on the Yahoo! network will not continue to fluctuate, that advertisers will not make smaller and shorter-term purchases, or that market prices for online advertising will not decrease due to competitive or other factors. In addition, there can be no assurance that the volume of searches conducted, the amounts bid by advertisers for search listings or the number of advertisers that bid on the Overture service will not vary widely from period to period. As revenues from sources other than advertising increase, it may become more difficult to predict our financial results based on historical performance. Because of the rapidly changing market we serve, period-to-period comparisons of operating results are not likely to be meaningful. You should not rely on the results for any period as an indication of future performance.
We expect our operating expenses to continue to increase as we attempt to expand the Yahoo! brand, fund product development, develop media properties and acquire other businesses.
Yahoo! currently expects that its operating expenses will continue to increase as we expand our operations in areas of expected growth, continue to develop and extend the Yahoo! brand, fund greater levels of product development, develop and commercialize additional media properties and premium services, and acquire and integrate complementary businesses and technologies. If our expenses increase at a greater pace than our revenues, our operating results could be harmed.
We may be required to record a significant charge to earnings if we must reassess our goodwill or amortizable intangible assets.
We are required under generally accepted accounting principles to review our amortizable intangible assets for impairment when events or changes in circumstances indicate the carrying value may not be recoverable. Goodwill is required to be tested for impairment at least annually.
12
Factors that may be considered a change in circumstances indicating that the carrying value of our amortizable intangible assets may not be recoverable include a decline in stock price and market capitalization, and slower growth rates in our industry. We may be required to record a significant charge to earnings in our financial statements during the period in which any impairment of our goodwill or amortizable intangible assets is determined. At December 31, 2003, our goodwill and amortizable intangible assets were $2.3 billion. In the first quarter of 2002, we recorded a transitional impairment charge of $64 million as a cumulative effect of an accounting change, upon the adoption of Statement of Financial Accounting Standards No. 142 "Goodwill and Other Intangible Assets."
The majority of our revenues are derived from marketing services. Demand from our current and potential clients for online advertising is difficult to forecast accurately.
For the fiscal year ended December 31, 2003, approximately 74 percent of our total revenues came from marketing services. Our ability to continue to achieve substantial advertising revenue depends upon:
Our agreements with advertisers and sponsors generally have terms of three years or less and, in many cases, the terms are one year or less or in the case of Overture's business, may be immediately terminable by the advertiser. The agreements often have payments contingent on usage or "click-through" levels. Accordingly, it is difficult to forecast these revenues accurately. However, our expense levels are based in part on expectations of future revenues, include guaranteed minimum payments to our affiliates in connection with our pay-for-performance advertising services, and are fixed over the short-term with respect to certain categories. We may be unable to adjust spending quickly enough to compensate for any unexpected revenue shortfall.
Overture depends on a limited number of sources to direct users and businesses to its service to conduct searches.
The users and businesses that conduct searches on Overture's service come from a limited number of sources. In addition to the Yahoo! properties, sources for users conducting searches are members of Overture's affiliate network, including portals, browsers, and other affiliates. Overture's agreements with affiliates vary in duration, and depending on the agreement, provide varying levels of discretion to the affiliate in the implementation of the Overture service, including the degree to which affiliates can modify the presentation of the Overture search results on their websites or integrate the Overture services with their own services, and may be terminable upon the occurrence of certain events, including failure to meet certain service levels, material breaches of agreement terms, changes in control (including the change of control of Overture which occurred with Yahoo!'s acquisition of Overture) or in some instances, at will. Overture may not be successful in renewing any of its affiliate agreements, or if they are renewed, they may not be on as favorable terms. The loss of any of these affiliates or adverse change in implementation of the Overture service by our affiliates could harm our ability to generate revenue and our operating results.
Decreases or delays in advertising spending due to general economic downturns could harm our ability to generate advertising revenue.
Expenditures by advertisers tend to be cyclical, reflecting overall economic conditions as well as budgeting and buying patterns. In the recent past, the overall market for advertising, including Internet advertising, was generally characterized by softness of demand and the reduction of marketing and advertising budgets or the delay in
13
spending of budgeted resources. As a result, advertising spending decreased. Since Yahoo! derives a large part of its revenues from advertising fees, any decreases in or delays of advertising spending could reduce our revenues or negatively impact our ability to grow our revenues. Even as economic conditions improve, marketing budgets and advertising spending may not increase from current levels.
Due to intense competition, we may not be able to generate substantial revenues from the Internet access market.
In 2002 we launched SBC Yahoo! DSL and SBC Yahoo! Dial, an Internet access service provided through an alliance with SBC Communications Inc. In 2003 we launched BT Yahoo! Internet, a range of broadband and dial-up Internet access services provided in the United Kingdom through an alliance with British Telecommunications plc ("BT"). These access services combine customized content and services from Yahoo! (including browser and other communications services) and DSL transport and Internet access from SBC Internet Services (an affiliate of SBC Communications Inc.) and BT. These Internet access services compete with many large companies, some of which may have substantially greater market presence (including an existing user base), financial, technical, marketing or other resources than those committed to the product offerings with SBC and BT. In the United States, these services primarily compete directly or indirectly with established Internet services, such as AOL and MSN; other national telecommunications companies and regional Bell operating companies; and broadband Internet access providers such as Earthlink, Inc., Comcast Corporation, and other cable broadband providers. In the United Kingdom, these services primarily compete directly or indirectly with established Internet services, such as AOL and Freeserve plc; other major UK Internet service providers; and cable broadband providers such as NTL Incoporated and Telewest Communications. As a result of these and other competitive factors, these services may not be able to attract, grow or retain a customer base, which would negatively impact our ability to sell customized content and services through this channel.
Our success in the Internet access market will depend on technical and customer service issues, which we have a limited ability to control.
Internet access services, including SBC Yahoo! DSL, SBC Yahoo! Dial and BT Yahoo! Internet, are susceptible to natural or man-made disasters such as earthquakes, floods, fires, power loss, or sabotage, as well as interruptions from technology malfunctions, computer viruses or hacker attacks. Other potential service interruptions may result from unanticipated demands on network infrastructure, increased traffic or problems in customer service to our access customers. Our ability to control technical and customer service issues is further limited by our dependence on SBC and BT for connectivity, customer service, joint marketing and technical integration of aspects of our access service. Significant disruptions in our access service could harm our goodwill, the Yahoo! brand and ultimately could significantly and negatively impact the amount of revenue we may earn from our service.
Some of our sponsorship arrangements may not generate anticipated revenues.
A key element of our strategy is to generate marketing services revenue through sponsored services and placements by third parties in our online media properties in addition to banner advertising. We typically receive sponsorship fees or a portion of transactions revenue in return for minimum levels of user impressions to be provided by us. These arrangements expose us to potentially significant financial risks in the event our usage levels decrease, including the following:
14
Accordingly, any leveling off or decrease of our user base (or usage by our existing base) or the failure to generate anticipated levels of shared transactions revenue could result in a significant decrease in our revenues.
We may not be successful in expanding the number of users of our electronic commerce services.
We have focused, and intend to continue to focus, significant resources on the development and enhancement of our electronic commerce properties, such as Yahoo! Shopping. The success of our electronic commerce properties depends on, among other things, our ability to attract and retain well-known brands among our network of retailers, the ability to generate traffic to our commerce properties, and, in the case of Yahoo! Shopping, the rate at which users click through to product search results. Through our electronic commerce properties, we do not establish a direct billing relationship with our users as a result of any purchases they may make with the retailers. The revenue that we derive from our electronic commerce properties is typically in the form of lead-based fees, wherein retailers pay a fee based on the number of times a user clicks on a link to their site, transaction fees, and advertising fees. Users who had a favorable buying experience with a particular retailer may contact that retailer directly for future purchases rather than through our service. If our users bypass our electronic commerce properties, such as Yahoo! Shopping, and contact retailers directly, our revenue could decline. Competing providers of online shopping, including merchants with whom we have relationships, may provide a more convenient and comprehensive online shopping experience due to their singular focus on electronic commerce. As a result, we may have difficulty competing with those merchants for users of electronic commerce services and as a consequence our revenue could decline or we could fail to generate significant revenues from electronic commerce.
We will continue to operate in international markets in which we have limited experience and are faced with relatively higher costs and are exposed to greater risks.
A key part of our strategy is to develop Yahoo!-branded online properties and expand our commercial search offerings in international markets. We have developed, through joint ventures, subsidiaries and branch offices, localized properties in over 20 international countries. We also provide search services in 15 international countries. To date, we have only limited experience in marketing and operating our products and services internationally, and we rely on the efforts and abilities of our foreign business partners in such activities.
We believe that in light of substantial competition, we need to expand our operations in international markets quickly in order to obtain market share effectively. However, in a number of international markets, especially those in Europe, we face substantial competition from Internet Service Providers ("ISPs") that offer or may offer their own navigational services and from other companies that provide commercial search services. Many of these companies have a dominant market share in their territories. Furthermore, foreign providers of competing online services may have a substantial advantage over us in attracting users in their country due to more established branding in that country, greater knowledge with respect to the tastes and preferences of users residing in that country and/or their focus on a single market. We have experienced and expect to continue to experience higher costs as a percentage of revenues in connection with the development and maintenance of our international online properties relative to our domestic experience. We have selected international markets that may not develop at a rate that supports our level of investment. In particular, certain international markets may be slower than domestic markets in adopting the Internet as an advertising and commerce medium.
Our international operations are subject to increased risks.
In addition to uncertainty about our ability to continue to generate revenues from our foreign operations and expand our international presence, there are certain risks inherent in doing business on an international level, including:
15
One or more of these factors could harm our future international operations and consequently, could harm our business, operating results, and financial condition.
If key personnel leave unexpectedly and are not replaced, we may not be able to execute our business plan.
We are substantially dependent on the continued services of our key personnel, including our two founders, our chief executive officer, chief financial officer, chief operating officer, chief technical officer, and our executive and senior vice presidents. These individuals have acquired specialized knowledge and skills with respect to Yahoo! and its operations. In addition, as part of our integration of Overture's personnel and operations, we may lose key employees of Overture. If any of these individuals were to leave unexpectedly, we could face substantial difficulty in hiring qualified successors and could experience a loss in productivity while any such successor obtains the necessary training and experience. Many of our management personnel have reached or will soon reach the four-year anniversary of their Yahoo! hiring date and, as a result, have become or will shortly become fully vested in their initial stock option grants. While management personnel are typically granted additional stock options subsequent to their hire date, which will usually vest over a period of four years to provide additional incentive to remain at Yahoo!, the initial option grant is typically the largest for a given position, and an employee may be more likely to leave Yahoo! upon completion of the vesting period for the initial option grant.
If we are unable to hire qualified personnel in designated growth areas, we may not be able to execute our business plan.
We expect that we will need to hire additional personnel in designated growth areas. The competition for qualified personnel can be intense, particularly in the San Francisco Bay Area, where our corporate headquarters are located. At times, we have experienced difficulties in hiring personnel with the right training or experience, particularly in technical areas. If we do not succeed in attracting new personnel, or retaining and motivating existing personnel, we may be unable to meet our business plan and as a result our stock price may decline.
We may have difficulty scaling and adapting our existing architecture to accommodate increased traffic and technology advances or customer requirements.
Yahoo! is one of the most highly trafficked Websites on the Internet and is regularly serving numbers of users and delivering daily page views which are beyond previous standards for Internet usage. In addition, the services offered by Yahoo!, and popular with users and customers, have changed significantly in the past, are expected to change rapidly in the future, and are difficult to predict. Rapid increases in the levels or types of use of our online properties and services could result in delays or interruptions in our service. In particular, the architectures utilized for our services are highly complex and may not provide satisfactory service in the future, especially as the usage levels of email and certain other services increase, the rate of unsolicited email continues to increase in volume and complexity and the number of advertisers utilizing the Overture service increases. In the future, we may be required to make significant changes to our architectures, including moving to completely new architectures. If we are required to switch architectures, we may incur substantial costs and experience delays or interruptions in our service. These delays or interruptions in our service may cause users and customers to become dissatisfied with our service and move to competing providers of online services. Further, to the extent that demand for our services increases, we will need to expand our infrastructure, including the capacity of our hardware servers and the sophistication of our software. This expansion is likely to be expensive and complex, and require additional technical expertise. As we acquire users who rely upon us for a wide variety of services, it becomes more technologically complex and costly to retrieve, store and integrate data that will enable us to track each user's preferences. An unanticipated loss of traffic, increased costs, inefficiencies or failures to adapt to new technologies or user requirements and the associated adjustments to our architecture could harm our operating results and financial condition.
Our competitors often provide Internet access or computer hardware to our users, and our competitors could make it difficult for our users to access our services, which in turn, could reduce the number of our users.
Our users must access our services through an Internet access provider, including providers of cable and DSL
16
Internet access, with which the user establishes a direct billing relationship using a personal computer or other access device. To the extent that an access provider (other than those with which we have a relationship), such as AOL or MSN, or a computer or computing device manufacturer offers online services or properties that are competitive with those of Yahoo!, the user may find it more convenient to use the services or properties of that access provider or manufacturer. In addition, the access provider or manufacturer may make it difficult to access our services by not listing them in the access provider's or manufacturer's own directory. Also, because the access provider gathers information from the user in connection with the establishment of the billing relationship, the access provider may be more effective than us in tailoring services and advertisements to the specific tastes of the user. To the extent that a user opts to use the services offered by an access provider (other than those with which we have a relationship) or those offered by computer or computing device manufacturers rather than the services provided by us, our revenues may decline.
More individuals are utilizing non-PC devices to access the Internet, and versions of our service developed or optimized for these devices may not gain widespread adoption by users of such devices.
The number of individuals who access the Internet through devices other than a personal computer, such as personal digital assistants, mobile telephones and television set-top devices, has increased dramatically. Our services were originally designed for rich, graphical environments such as those available on desktop and laptop computers. The lower resolution, functionality and memory associated with alternative devices may make the use of our services through such devices difficult, and the versions of our service developed for these devices may not be compelling to users of alternative devices. As we have limited experience to date in operating versions of our service developed or optimized for users of alternative devices, it is difficult to predict the problems we may encounter in doing so, and we may need to devote significant resources to the creation, support and maintenance of such versions. If we are unable to attract and retain a substantial number of alternative device users to our online services, we will fail to capture a sufficient share of an increasingly important portion of the market for online services.
We rely on the value of the Yahoo! brand, and the costs of maintaining and enhancing our brand awareness are increasing.
We believe that maintaining and expanding the Yahoo! brand (and our other brands, including HotJobs, Inktomi, LAUNCH, and Overture) is an important aspect of our efforts to attract and expand our user and advertiser base. We also believe that the importance of brand recognition will increase due to the relatively low barriers to entry. We have spent considerable money and resources to date on the establishment and maintenance of the Yahoo! brands. We will spend increasing amounts of money on, and devote greater resources to advertising, marketing and other brand-building efforts to preserve and enhance consumer awareness of the Yahoo! brands. We may not be able to successfully maintain or enhance consumer awareness of the Yahoo! brands and, even if we are successful in our branding efforts, such efforts may not be cost-effective. If we are unable to maintain or enhance customer awareness of the Yahoo! brands in a cost effective manner, our business, operating results and financial condition would be harmed.
The successful operation of our business depends upon the supply of critical elements from other companies and any interruption in that supply could cause service interruptions or reduce the quality of our product offerings.
We depend upon third parties, to a substantial extent, for several critical elements of our business, including various technology, infrastructure, content development, software and distribution components.
Technology and Infrastructure. We rely on private third-party providers for our principal Internet connections, co-location of a significant portion of our data servers and network access. Any disruption in the Internet or network access or co-location services provided by these third-party providers or any failure of these third-party providers to handle current or higher volumes of use could significantly harm our business, operating results and financial condition. Any financial difficulties for our providers may have negative effects on our business, the nature and extent of which we cannot predict. We license technology and related databases from third parties for certain elements of our properties, including, among others, technology underlying the delivery of news, stock quotes and current financial information, chat services, street mapping and telephone listings, streaming capabilities and similar services. We have experienced and expect to continue to
17
experience interruptions and delays in service and availability for such elements. We also rely on a third-party manufacturer for key components of our email service. Furthermore, we depend on hardware and software suppliers for prompt delivery, installation and service of servers and other equipment to deliver our products and services. Any errors, failures, interruptions, or delays experienced in connection with these third-party technologies and information services could negatively impact our relationship with users and adversely affect our brand and our business and could expose us to liabilities to third parties.
Distribution Relationships. In addition to our relationships with SBC and BT, to increase traffic for our online properties and services and make them more available and attractive to advertisers and consumers, we have certain distribution agreements and informal relationships with, operators of online networks and leading Websites, electronics companies, and computer manufacturers. These distribution arrangements typically are not exclusive and do not extend over a significant amount of time. Further, some of our distributors are competitors or potential competitors who may not renew their distribution contracts with us. Potential distributors may not offer distribution of our properties and services on reasonable terms, or at all. In addition, as new methods for accessing the Web become available, including through alternative devices, we may need to enter into additional distribution relationships. If we fail to obtain distribution or to obtain distribution on terms that are reasonable, we may not be able to fully execute our business plan.
Streaming Media Software. We rely on the two leading providers of streaming media products, RealNetworks, Inc. and Microsoft, to license the software necessary to broadcast streaming audio and video content to our users. There can be no assurance that these providers will continue to license these products to us on reasonable terms, or at all. Our users are currently able to electronically download copies of the software to play streaming media free of charge, but providers of streaming media products may begin charging users for copies of their player software or otherwise change their business model in a manner that slows the widespread acceptance of these products. In order for our rich media services to be successful, there must be a large base of users of these streaming media products. We have limited or no control over the availability or acceptance of streaming media software, and to the extent that any of these circumstances occur, our business will be adversely affected.
Content and Search Service. Our future success depends upon our ability to aggregate compelling content and deliver that content through our online properties. We license much of the content that attracts users to our online properties, such as news items, stock quotes, weather reports, maps and audio and video content from third parties. In particular, our music and entertainment properties rely on major sports organizations, radio and television stations, record labels, cable networks, businesses, colleges and universities, film producers and distributors, and other organizations for a large portion of the content available on our properties. Our ability to maintain and build relationships with third-party content providers will be critical to our success. We may be unable to enter into or preserve relationships with the third parties whose content we seek to obtain. Many of our current licenses for third-party content extend for a period of less than two years and there can be no guarantee that they will be renewed upon their expiration. In addition, as competition for compelling content increases both domestically and abroad, our content providers may increase the prices at which they offer their content to us and potential content providers may not offer their content on terms agreeable to us. An increase in the prices charged to us by third-party content providers could harm our operating results and financial condition. Further, many of our content licenses with third parties are non-exclusive. Accordingly, other Webcasters may be able to offer similar or identical content. Likewise, most sports and entertainment content available on our online properties are also available on other media like radio or television. These media are currently, and for the foreseeable future will be, much more widely adopted for listening or viewing such content than the Web. These factors also increase the importance of our ability to deliver compelling editorial content and personalization of this content for users in order to differentiate Yahoo! from other businesses. If we are unable to license or acquire compelling content, if other companies broadcast content that is similar to or the same as that provided by Yahoo!, or if we do not develop compelling editorial content or personalization services, the number of users on our online properties may not grow at all or may grow at a slower rate than anticipated, which would harm our operating results.
18
As we provide more audio and video content, particularly music, we may be required to spend significant amounts of money on content acquisition and content broadcasts.
In the past, the majority of the content that we provided to our users was in print, picture or graphical format and was either created internally or licensed to us by third parties for little or no charge. However, we have been providing and intend to continue to provide increasing amounts of audio and video content to our users, such as the broadcast of music, film content, speeches, news footage, concerts and other special events, through our media and entertainment properties. We believe that users of Internet services such as the Yahoo! online properties will increasingly demand high-quality audio and video content. Such content may require us to make substantial payments to third parties from whom we license or acquire such content.
For example, in order to broadcast music through our online properties, we are currently required to pay royalties both on the copyright in the musical compositions and the copyright in the actual sound recordings of the music to be broadcast. The revenue we receive as a result of our audio and video broadcasts may not justify the costs of providing such broadcasts.
Our failure to manage growth and diversification of our business could harm us.
We have experienced dramatic growth in personnel since inception and expect to continue to hire additional personnel in selected areas. This growth requires significant time and resource commitments from us and our senior management. Further, as a result of recent acquisitions and international expansion, more than one-half of our employees are based outside of our Sunnyvale, California headquarters. If we are unable to effectively manage a large and geographically dispersed group of employees or anticipate our future growth, our business will be adversely affected.
Additionally, our business relies on our financial reporting and data systems (including our systems for billing users of our fee-based services), which have grown increasingly complex in the recent past due to acquisitions and the diversification and complexity of our business. Our ability to operate our business efficiently depends on these systems and if we are unable to adapt to these changes, our business will be adversely affected.
We are subject to U.S. and foreign government regulation of the Internet, the impact of which is difficult to predict.
We are subject to general business regulations and laws, as well as regulations and laws directly applicable to the Internet. As we continue to expand the scope of our properties and service offerings, the application of existing laws and regulations to Yahoo! relating to issues such as user privacy, defamation, pricing, advertising, taxation, gambling, sweepstakes, promotions, financial market regulation, consumer protection, content regulation, quality of products and services, and intellectual property ownership and infringement can be unclear. In addition, we will also be subject to new laws and regulations directly applicable to our activities. Further, the application of existing laws to Yahoo! or our subsidiaries regulating or requiring licenses for certain businesses of our advertisers including, for example, distribution of pharmaceuticals, alcohol, tobacco or firearms, as well as insurance and securities brokerage and legal services, can be unclear. Any existing or new legislation applicable to us could expose us to substantial liability, including significant expenses necessary to comply with such laws and regulations, and dampen the growth in use of the Web.
Several federal laws, including the following, could have an impact on our business. The Digital Millennium Copyright Act is intended, in part, to limit the liability of eligible online service providers for listing or linking to third-party Websites that include materials that infringe copyrights or other rights of others. The Children's Online Protection Act and the Children's Online Privacy Protection Act are intended to restrict the distribution of certain materials deemed harmful to children and impose additional restrictions on the ability of online services to collect user information from minors. In addition, the Protection of Children From Sexual Predators Act of 1998 requires online service providers to report evidence of violations of federal child pornography laws under certain circumstances. Such legislation may impose significant additional costs on our business or subject us to additional liabilities.
We post our privacy policies and practices concerning the use and disclosure of user data. In addition, GeoCities, a company we acquired in 1999, is required to comply with a consent order between it and the Federal Trade Commission (the "FTC"), which imposes certain obligations and restrictions with respect to information collected from
19
users. Any failure by us to comply with our posted privacy policies, the consent order, FTC requirements or other privacy-related laws and regulations could result in proceedings by the FTC or others which could potentially have an adverse effect on our business, results of operations and financial condition. In this regard, there are a large number of legislative proposals before the United States Congress and various state legislative bodies regarding privacy issues related to our business. It is not possible to predict whether or when such legislation may be adopted, and certain proposals, if adopted, could materially and adversely affect our business through a decrease in user registrations and revenues. This could be caused by, among other possible provisions, the required use of disclaimers or other requirements before users can utilize our services.
Due to the nature of the Web, it is possible that the governments of other states and foreign countries might attempt to regulate Web transmissions or prosecute us for violations of their laws. We might unintentionally violate such laws, such laws may be modified and new laws may be enacted in the future. Any such developments (or developments stemming from enactment or modification of other laws) could increase the costs of regulatory compliance for us or force us to change our business practices.
We may be subject to legal liability for online services.
We host a wide variety of services that enable individuals to exchange information, generate content, conduct business and engage in various online activities on an international basis, including public message posting and services relating to online auctions and homesteading. The law relating to the liability of providers of these online services for activities of their users is currently unsettled both within the United States and abroad. Claims have been threatened and have been brought against us for defamation, negligence, copyright or trademark infringement, unlawful activity, tort, including personal injury, fraud, or other theories based on the nature and content of information that we provide links to or that may be posted online or generated by our users or with respect to auctioned materials. In addition, Yahoo! was the subject of a claim brought by certain entities in a French court regarding, among other things, the availability of certain content within our services which was alleged to violate French law. Due to the unsettled nature of the law in this area, we may be subject to similar actions in domestic or other international jurisdictions in the future. Our defense of any such actions could be costly and involve significant distraction of our management and other resources. In addition, we are aware that governmental agencies are currently investigating the conduct of online auctions.
We also periodically enter into arrangements to offer third-party products, services, or content under the Yahoo! brand or via distribution on various Yahoo! properties, including stock quotes and trading information. We may be subject to claims concerning these products, services or content by virtue of our involvement in marketing, branding, broadcasting or providing access to them, even if we do not ourselves host, operate, provide, or provide access to these products, services or content. While our agreements with these parties often provide that we will be indemnified against such liabilities, such indemnification may not be adequate.
It is also possible that, if any information provided directly by us contains errors or is otherwise negligently provided to users, third parties could make claims against us. For example, we offer Web-based email services, which expose us to potential risks, such as liabilities or claims resulting from unsolicited email, lost or misdirected messages, illegal or fraudulent use of email, or interruptions or delays in email service. Investigating and defending any of these types of claims is expensive, even to the extent that the claims do not ultimately result in liability.
We issued $750 million of zero coupon senior convertible notes due April 2008 which we may not be able to repay in cash and could result in dilution of our earnings per share.
In April 2003, we issued $750 million of zero coupon senior convertible notes due April 1, 2008. The notes are convertible into our common stock at a conversion price of $41.00 per share, which would result in the issuance of an aggregate of 18 million shares, subject to adjustment upon the occurrence of specified events. Therefore, each $1,000 principal amount of the notes will initially be convertible into 24.3902 shares of our common stock prior to April 1, 2008 if the sale price of our common stock issuable upon conversion of the notes reaches a specified threshold or specified corporate transactions have occurred. The specified thresholds for conversion prior to the maturity date are (1) the closing sale price of our common stock for at least 20 trading days in the 30 trading-day period ending on the last trading day of the immediately preceding fiscal quarter exceeds 110 percent of the conversion price in effect on that 30th trading day,
20
and (2) during the period beginning January 1, 2008 through the maturity date, the closing sale price of our common stock on the previous trading day was 110 percent or more of the then current conversion price. We may be required to repurchase all of the notes at face value following a fundamental change of the Company, such as a change of control, prior to maturity. Following a fundamental change of the Company, we may choose to pay the purchase price of the notes in cash, shares of our common stock, shares of common stock of the surviving corporation, or a combination of cash and shares of the applicable common stock. We may not have enough cash on hand or have the ability to access cash to pay the notes if presented on a fundamental change or at maturity. In addition, the purchase of our notes with shares of our common stock or the conversion of the notes into our common stock could result in dilution of our earnings per share.
Our stock price has been volatile historically and may continue to be volatile.
The trading price of our common stock has been and may continue to be subject to wide fluctuations. During 2003, the closing sale prices of our common stock on the Nasdaq ranged from $17.54 to $45.03 per share and the closing sale price on February 25, 2004 was $43.34 per share. Our stock price may fluctuate in response to a number of events and factors, such as quarterly variations in operating results; announcements of technological innovations or new products and media properties by us or our competitors; changes in financial estimates and recommendations by securities analysts; the operating and stock price performance of other companies that investors may deem comparable to us; the operating performance and stock price of companies in which we have an equity investment, including Yahoo! Japan; and news reports relating to trends in our markets or general economic conditions.
In addition, the stock market in general, and the market prices for Internet-related companies in particular, have experienced volatility that often has been unrelated to the operating performance of such companies. These broad market and industry fluctuations may adversely affect the price of our stock, regardless of our operating performance. Additionally, volatility or a lack of positive performance in our stock price may adversely affect our ability to retain key employees, all of whom have been granted stock options.
Our operations could be significantly hindered by the occurrence of a natural disaster or other catastrophic event.
Our operations are susceptible to outages due to fire, floods, power loss, telecommunications failures, break-ins and similar events. In addition, a significant portion of our network infrastructure is located in Northern California, an area susceptible to earthquakes. We do not have multiple site capacity for all of our services in the event of any such occurrence. In an effort to reduce the likelihood of a geographical or other disaster impacting our business, we are continually distributing our servers among additional data centers located around the world. Failure to execute these changes properly or in a timely manner could result in delays or interruptions to our service. In addition, despite our implementation of network security measures, our servers are vulnerable to computer viruses, physical and electronic break-ins, and similar disruptions from unauthorized tampering with our computer systems.
Technological or other assaults on our service could harm our business.
We are vulnerable to coordinated attempts to overload our systems with data, resulting in denial or reduction of service to some or all of our users for a period of time. We have experienced a coordinated denial of service attack in the past, and may experience such attempts in the future. We may not carry sufficient business interruption insurance to compensate us for losses that may occur as a result of any of these events. Any such event could reduce our revenue and harm our operating results and financial condition.
Anti-takeover provisions could make it more difficult for a third party to acquire us.
We have adopted a stockholder rights plan and declared a dividend distribution of one right for each outstanding share of common stock to stockholders of record as of March 20, 2001. Each right entitles the holder to purchase one unit consisting of one one-thousandth of a share of our Series A Junior Participating Preferred Stock for $250 per unit. Under certain circumstances, if a person or group acquires 15 percent or more of our outstanding common stock, holders of the rights (other than the person or group triggering their exercise) will be able to purchase, in exchange for the $250 exercise price, shares of our common stock or of any company into which we are merged having a value of $500. The rights expire on March 1, 2011 unless extended by our board of directors. Because the rights may substantially dilute the
21
stock ownership of a person or group attempting to take us over without the approval of our board of directors, our rights plan could make it more difficult for a third party to acquire us (or a significant percentage of our outstanding capital stock) without first negotiating with our board of directors regarding such acquisition.
In addition, our board of directors has the authority to issue up to 10,000,000 shares of Preferred Stock (of which 2,000,000 shares have been designated as Series A Junior Participating Preferred Stock) and to determine the price, rights, preferences, privileges and restrictions, including voting rights, of those shares without any further vote or action by the stockholders.
The rights of the holders of our common stock may be subject to, and may be adversely affected by, the rights of the holders of any Preferred Stock that may be issued in the future. The issuance of Preferred Stock may have the effect of delaying, deterring or preventing a change of control of Yahoo! without further action by the stockholders and may adversely affect the voting and other rights of the holders of our common stock. Further, certain provisions of our charter documents, including provisions eliminating the ability of stockholders to take action by written consent and limiting the ability of stockholders to raise matters at a meeting of stockholders without giving advance notice, may have the effect of delaying or preventing changes in control or management of Yahoo!, which could have an adverse effect on the market price of our stock. In addition, our charter documents do not permit cumulative voting, which may make it more difficult for a third party to gain control of our Board of Directors. Further, we are subject to the anti-takeover provisions of Section 203 of the Delaware General Corporation Law, which will prohibit us from engaging in a "business combination" with an "interested stockholder" for a period of three years after the date of the transaction in which the person became an interested stockholder, even if such combination is favored by a majority of stockholders, unless the business combination is approved in a prescribed manner. The application of Section 203 also could have the effect of delaying or preventing a change of control or management.
Terrorist attacks and the recent hostilities in Iraq have contributed to economic instability in the United States and internationally, which could lead to reduced advertising spending by our customers.
On September 11, 2001, the United States was the target of terrorist attacks of unprecedented scope, and in March 2003, the United States became involved in hostilities with Iraq. These events, coupled with political instability elsewhere in the world have caused volatility in the financial markets and uncertainty in the global economy. Under these circumstances, there is a risk that our existing and potential customers may decrease spending, particularly for marketing services. Because marketing services continue to constitute a majority of our revenues, any such decrease in expenditures could materially and adversely affect our operating results and financial condition. In addition, the political and economic conditions described above may contribute to increased volatility in stock prices, which may cause our stock price to decline.
Special note regarding forward-looking statements.
Some of the statements in this Report constitute forward-looking statements. In some cases, you can identify forward-looking statements by terminology such as "may," "will," "should," "intend," "expect," "plan," "anticipate," "believe," "estimate," "predict," "potential," or "continue" or the negative of such terms or other comparable terminology. This Report includes, among others for fiscal 2004, statements regarding our:
These statements involve known and unknown risks, uncertainties, and other factors that may cause our or our
22
industry's results, levels of activity, performance, or achievements to be materially different from any future results, levels of activity, performance, or achievements expressed or implied by such forward-looking statements. Such factors include, among others, those listed in these "Risk Factors" and elsewhere in this Report. Although we believe that the expectations reflected in the forward-looking statements are reasonable, we cannot guarantee future results, events, levels of activity, performance, or achievements. We do not assume responsibility for the accuracy and completeness of the forward-looking statements. We do not intend to update any of the forward-looking statements after the date of this Report to conform them to actual results.
Our headquarters are located in Sunnyvale, California and aggregate approximately one million square feet. Office space for our international subsidiaries is leased in Bangalore, Beijing, Buenos Aires, Calgary, Copenhagen, Dublin, Dusseldorf, Hamburg, Hong Kong, London, Madrid, Melbourne, Mexico City, Milan, Mumbai, Munich, New Delhi, Paris, São Paulo, Seoul, Shanghai, Singapore, Stockholm, Sydney, Taipei, Tokyo, Toronto and Trondheim. We also lease offices in various locations in the United States, including Atlanta, Boston, Chicago, Columbus, Dallas, Detroit, Irvine, the Los Angeles Area, Miami, New York, Reston, Sacramento, the San Diego Area, San Francisco Bay Area, St. Louis, and Washington, D.C. Our principal Web server equipment and operations are maintained in Santa Clara, California and several other domestic and international locations.
We believe that our existing facilities are adequate to meet current requirements, and that suitable additional or substitute space will be available as needed to accommodate any further physical expansion of corporate operations and for any additional sales offices.
From time to time, third parties assert patent infringement claims against Yahoo! in the form of letters, lawsuits, and other forms of communication. Currently, we are engaged in several lawsuits regarding patent issues and have been notified of a number of other potential patent disputes.
In addition, from time to time we are subject to other legal proceedings and claims in the ordinary course of business, including claims of alleged infringement of trademarks, copyrights and other intellectual property rights, and a variety of claims arising in connection with our email, message boards, auction sites, shopping services, and other communications and community features, such as claims alleging defamation or invasion of privacy.
In
October 2000, 800-JR-Cigar, Inc. filed a complaint in the United States District Court for the District of New Jersey against Overture, a wholly-owned
subsidiary of Yahoo! acquired in October 2003. In October 2002, Robert Novak, doing business as PetsWarehouse and
PetsWarehouse.com, filed a complaint in the United States District Court for the Eastern District of New York against Overture. In August 2003, Accor filed a complaint in the Nanterre District
Court in France against Overture and Overture S.A.R.L., Overture's wholly-owned subsidiary in France. The plaintiffs in each of these cases claim, among other things, that they have trademark rights
in certain search terms and that Overture violates these rights by allowing its advertisers to bid on these search terms. The complaints seek injunctive relief and damages. Overture has also been
named as a defendant in several other
trade name infringement actions filed in Los Angeles, California in which plaintiffs made similar claims. Yahoo! and Overture believe that Overture has meritorious defenses to liability and damages in
each of these lawsuits and are contesting them vigorously.
We do not believe, based on current knowledge, that any of the foregoing legal proceedings or claims are likely to have a material adverse effect on our financial position, results of operations or cash flows. However, we may incur substantial expenses in defending against third party claims. In the event of a determination adverse to Yahoo! or our subsidiaries, we may incur substantial monetary liability, and be required to change our business practices. Either of these could have a material adverse effect on our financial position, results of operations or cash flows.
On May 24, 2001, Arista Records, Inc., Bad Boy Records, BMG Music d/b/a The RCA Records Label, Capitol Records, Inc., Virgin Records America, Inc., Sony Music Entertainment Inc., UMG Recordings, Inc., Interscope Records, Motown Record Company, L.P., and Zomba Recording Corporation filed a lawsuit alleging copyright infringement against LAUNCH Media, Inc. ("LAUNCH") in the United States District Court for the Southern District of New York. After the lawsuit was commenced, Yahoo! entered into an agreement to acquire
23
LAUNCH. In June 2001, LAUNCH settled the LAUNCH litigation as to UMG Recordings, Inc. Our acquisition of LAUNCH closed in August 2001, and since that time LAUNCH has been a wholly owned subsidiary of Yahoo!. The plaintiffs allege, among other things, that the consumer-influenced portion of LAUNCH's LAUNCHcast service is "interactive" within the meaning of Section 114 of the Copyright Act and therefore does not qualify for the compulsory license provided for by the Copyright Act. The Complaint seeks declaratory and injunctive relief and damages for the alleged infringement. Yahoo! and LAUNCH do not believe that LAUNCH has infringed any rights of plaintiffs and intend to vigorously contest the lawsuit. The lawsuit is still in the preliminary, discovery phase and we do not believe it is feasible to predict or determine the outcome or resolution of the LAUNCH litigation. The range of possible resolutions of the LAUNCH litigation could include judgments against us or settlements that could require substantial payments by us, which could have a material adverse impact on our financial position, results of operations or cash flows. An estimate of the potential loss, if any, or range of loss that could arise from the LAUNCH litigation cannot be made at this time. In January 2003, LAUNCH settled the LAUNCH litigation as to Sony Music Entertainment, Inc. In October 2003, LAUNCH settled the litigation as to Capitol Records, Inc. and Virgin Records America, Inc. Accordingly, BMG Music d/b/a/ The RCA Records Label is the sole remaining plaintiff in this proceeding as of October 2003.
On July 12, 2001, the first of several purported securities class action lawsuits was filed in the United States District Court, Southern District of New York against certain underwriters involved in Overture's initial public offering, Overture, and certain of Overture's current and former officers and directors. The Court consolidated the cases against Overture into case number 01 Civ. 6339. Plaintiffs allege, among other things, violations of the Securities Act of 1933 and the Securities Exchange Act of 1934 involving undisclosed compensation to the underwriters, and improper practices by the underwriters, and seek unspecified damages. Similar complaints were filed in the same court against numerous public companies that conducted initial public offerings of their common stock since the mid-1990s. All of these lawsuits were consolidated for pretrial purposes before Judge Shira Scheindlin. On April 19, 2002, plaintiffs filed an amended complaint, alleging Rule 10b-5 claims of fraud. On July 15, 2002, the issuers filed a motion to dismiss for failure to comply with applicable pleading standards. On October 8, 2002, the Court entered an Order of Dismissal as to all of the individual defendants in the Overture IPO litigation, without prejudice. On February 19, 2003, the Court denied the motion to dismiss the Rule 10b-5 claims against certain defendants, including Overture. Settlement discussions relating to this case on behalf of the named defendants have occurred over the last several months, resulting in a final settlement memorandum of understanding with the plaintiffs in the case and Overture's insurance carriers. A proposal has been made for the settlement and release of claims against the issuer defendants, including Overture. The settlement is subject to a number of conditions, including approval of the proposed settling parties and the court. If the settlement does not occur, and litigation against Overture continues, the Company and Overture believe that Overture has meritorious defenses to liability and damages and intend to defend the case vigorously.
On or about February 4, 2004, a shareholder derivative action was filed in the Court of Chancery of the State of Delaware in and for New Castle County, against us (as nominal defendant) and certain of our current and former officers and directors (the "Derivative Defendants"). Two similar shareholder derivative actions were filed in the California Superior Court for the County of San Mateo on February 13, 2004. The complaints generally allege breaches of fiduciary duties by the Derivative Defendants related to the alleged purchase of shares in initial public offerings or the alleged acquiescence in such conduct. The complaints seek unspecified monetary damages and other relief purportedly on behalf of Yahoo! from the Derivative Defendants. We understand the Derivative Defendants deny any impropriety and intend to defend the lawsuits vigorously. We do not believe that the ultimate costs to resolve these matters will have a material adverse effect on our financial condition, results of operations or cash flows. In addition, we believe there are procedural defects to permitting these complaints to proceed on Yahoo!'s behalf.
Item 4. Submission of Matters to a Vote of Security Holders
No matters were submitted to a vote of security holders during the fourth quarter of 2003.
24
Item 5. Market for the Registrant's Common Equity, Related Stockholder Matters and Issuer Purchases of Equity Securities
Yahoo! Inc. common stock is quoted on the Nasdaq National Market System under the symbol "YHOO." The following table sets forth the range of high and low per share sales prices as reported for each period indicated and reflects all stock splits effected:
|
|
2002 |
2003 |
||||||||||
|---|---|---|---|---|---|---|---|---|---|---|---|---|
|
|
High |
Low |
High |
Low |
||||||||
|
|
||||||||||||
| First quarter | $ | 21.35 | $ | 13.41 | $ | 24.99 | $ | 16.50 | ||||
| Second quarter | $ | 19.15 | $ | 12.82 | $ | 33.49 | $ | 22.52 | ||||
| Third quarter | $ | 14.86 | $ | 8.94 | $ | 38.25 | $ | 28.10 | ||||
| Fourth quarter | $ | 18.97 | $ | 9.01 | $ | 45.48 | $ | 35.00 | ||||
We had 10,180 stockholders of record as of February 25, 2004. We have not declared or paid any cash dividends on our common stock. We presently intend to retain our future earnings, if any, to fund the development and growth of our business and, therefore, do not have plans to pay any cash dividends in the near future.
We did not make any unregistered sales of our common stock during the fourth quarter of 2003.
Equity Compensation Plan Information
The following table sets forth information as of December 31, 2003 with respect to shares of the Company's common stock that may be issued under the Company's existing equity compensation plans, including our 1995 Stock Plan, as amended, 1996 Employee Stock Purchase Plan (the "ESPP"), as amended and 1996 Directors' Stock Option Plan, as amended.
|
Plan Category |
Number of Securities to be Issued Upon Exercise of Outstanding Options, Warrants and Rights |
Weighted Average Exercise Price per Share of Outstanding Options, Warrants and Rights |
Number of Securities Remaining Available for Future Issuance |
|||||
|---|---|---|---|---|---|---|---|---|
| Equity compensation plans approved by security holders (1) | 113,510,000 | $ | 39.21 | 37,828,000 | (2) | |||
25
Item 6. Selected Financial Data
|
|
Years Ended December 31, |
||||||||||||||
|---|---|---|---|---|---|---|---|---|---|---|---|---|---|---|---|
|
(in thousands, except per share amounts) |
|||||||||||||||
|
1999 |
2000 |
2001 |
2002 |
2003 |
|||||||||||
|
|
|||||||||||||||
| Revenues | $ | 591,786 | $ | 1,110,178 | $ | 717,422 | $ | 953,067 | $ | 1,625,097 | |||||
Gross profit |
$ |
498,605 |
$ |
960,434 |
$ |
560,421 |
$ |
790,186 |
$ |
1,266,994 |
|||||
Net income (loss) before cumulative effect of accounting change |
$ |
47,811 |
$ |
70,776 |
$ |
(92,788 |
) |
$ |
106,935 |
$ |
237,879 |
||||
| Cumulative effect of accounting change | | | | (64,120 | ) | | |||||||||
| Net income (loss) | $ | 47,811 | $ | 70,776 | $ | (92,788 | ) | $ | 42,815 | $ | 237,879 | ||||
| Net income (loss) per share before cumulative effect of accounting change basic | $ | 0.09 | $ | 0.13 | $ | (0.16 | ) | $ | 0.18 | $ | 0.39 | ||||
| Cumulative effect of accounting change per share basic | | | | (0.11 | ) | | |||||||||
| Net income (loss) per share basic | $ | 0.09 | $ | 0.13 | $ | (0.16 | ) | $ | 0.07 | $ | 0.39 | ||||
| Net income (loss) per share before cumulative effect of accounting change diluted | $ | 0.08 | $ | 0.12 | $ | (0.16 | ) | $ | 0.18 | $ | 0.37 | ||||
| Cumulative effect of accounting change per share diluted | | | | (0.11 | ) | | |||||||||
| Net income (loss) per share diluted | $ | 0.08 | $ | 0.12 | $ | (0.16 | ) | $ | 0.07 | $ | 0.37 | ||||
| Shares used in per share calculation basic | 516,237 | 550,657 | 569,724 | 593,838 | 616,740 | ||||||||||
| Shares used in per share calculation diluted | 599,558 | 610,678 | 569,724 | 610,060 | 642,081 | ||||||||||
|
|
December 31, |
||||||||||||||
|
|
1999 |
2000 |
2001 |
2002 |
2003 |
||||||||||
|
|
|||||||||||||||
| Cash, cash equivalents and investments in marketable securities | $ | 1,255,267 | $ | 1,746,211 | $ | 1,506,845 | $ | 1,537,584 | $ | 2,571,210 | |||||
| Restricted cash and restricted long-term investments | $ | | $ | 30,000 | $ | 258,662 | $ | | $ | | |||||
| Working capital | $ | 796,653 | $ | 979,635 | $ | 693,016 | $ | 558,190 | $ | 1,013,913 | |||||
| Total assets | $ | 1,520,129 | $ | 2,269,576 | $ | 2,379,346 | $ | 2,790,181 | $ | 5,931,654 | |||||
| Long-term liabilities | $ | 17,621 | $ | 32,115 | $ | 23,806 | $ | 84,540 | $ | 822,890 | |||||
| Mandatorily redeemable convertible preferred stock | $ | 52,173 | $ | | $ | | $ | | $ | | |||||
| Stockholders' equity | $ | 1,251,732 | $ | 1,896,914 | $ | 1,967,017 | $ | 2,262,270 | $ | 4,363,490 | |||||
All historical information has been restated to reflect the acquisitions during the years ended December 31, 1999 and 2000 that were accounted for as pooling of interests. Acquisitions during the years ended December 31, 2001, 2002 and 2003 were accounted for under the purchase method, and are described in Note 6 "Acquisitions."
26
Item 7. Management's Discussion and Analysis of Financial Condition and Results of Operations
This Report contains forward-looking statements within the meaning of Section 27A of the Securities Act of 1933, as amended, and Section 21E of the Securities Exchange Act of 1934, as amended, including, without limitation, statements regarding the Company's expectations, beliefs, intentions or future strategies that are signified by the words "expects," "anticipates," "intends," "believes," or similar language. These forward-looking statements, including those with respect to our operating results for 2004, are based upon current expectations and beliefs of the Company's management and are subject to risks and uncertainties that could cause results to differ materially from those indicated in the forward-looking statements. Some, but not all, of the factors, which could cause actual results to differ materially include those set forth in the section in this Annual Report on Form 10-K entitled "Risk Factors" and elsewhere in this report. The Company undertakes no obligation to revise or publicly release the results of any revision to these forward-looking statements, or to explain why actual results differ. Readers should carefully review the risk factors described in this document and in any reports subsequently filed with the Securities and Exchange Commission ("SEC").
Overview
Yahoo! Inc., including its consolidated subsidiaries, ("Yahoo!") is a global Internet company that offers a comprehensive branded network of properties and services to consumers and businesses worldwide. As the first online navigational guide to the Web, www.yahoo.com, is a leading guide in terms of traffic, advertising, household and business user reach. Yahoo!'s global brand reaches the largest audience worldwide. Headquartered in Sunnyvale, California, we have offices in the United States, Europe, Asia, Latin America, Australia and Canada.
We manage our business geographically. We rely on an internal management reporting process that provides revenue and certain operating cost information for making financial decisions and allocating resources. Our principal areas of measurement and decision-making are the United States and International.
We generate service revenues from our marketing services, fees and listings offerings. Revenues for the years ended December 31, 2002 and 2003 were as follows (dollars in thousands):
|
Revenues |
2002 |
2003 |
Year-over-Year Growth ($) |
Year-over-Year Growth (%) |
||||||||
|---|---|---|---|---|---|---|---|---|---|---|---|---|
| Marketing services | $ | 651,568 | $ | 1,199,733 | $ | 548,165 | 84 | % | ||||
| Fees | 207,941 | 298,192 | 90,251 | 43 | % | |||||||
| Listings | 93,558 | 127,172 | 33,614 | 36 | % | |||||||
| Total revenues | $ | 953,067 | $ | 1,625,097 | $ | 672,030 | 71 | % | ||||
Marketing services revenue is primarily generated from the sale of rich media advertisements, sponsorship and text-link advertisements, (including pay-for-performance search advertisements), paid inclusion, algorithmic searches and transactions revenue. The increase in marketing services in 2003 compared to 2002 was due to incremental revenue contribution from our 2003 acquisitions and strong growth in the balance of Yahoo!'s global legacy (non-acquisition related) marketing services revenue. For the year ended December 31, 2003, approximately 74 percent of our total revenues came from marketing services. Fees revenue is generated from a variety of consumer and business fee-based services. Fees revenue increased in 2003 when compared to 2002 due to an increase in the number of paying users for our fee-based services, from approximately 2.2 million paying users at December 31, 2002 to approximately 4.9 million paying users at December 31, 2003. Average revenue per paying user per month declined from approximately $7 per user per month in 2002 to approximately $5 per user per month in 2003 as a result of faster subscriber growth in some of the lower priced offerings, and the introduction of lower priced fee-based products offered in 2003. Listings revenue consists of revenues generated from a variety of consumer and business listings-based services. Listings revenue increased as compared to the prior year, primarily from our Search & Marketplace listings.
27
Cash flows for the years ended December 31, 2002 and 2003 were as follows (in thousands):
|
|
2002 |
2003 |
Year-over-Year Change ($) |
|||||||
|---|---|---|---|---|---|---|---|---|---|---|
| Net cash provided by operating activities | $ | 302,448 | $ | 428,144 | $ | 125,696 | ||||
| Net cash used in investing activities | $ | (345,854 | ) | $ | (1,121,589 | ) | $ | (775,735 | ) | |
| Net cash provided by (used in) financing activities | $ | (21,810 | ) | $ | 1,086,326 | $ | 1,108,136 | |||
The increase in net cash provided by operating activities was primarily related to the overall increase in revenues that we describe above. We also generated cash from our convertible note offering and proceeds from the exercise of stock options by our employees. We used the cash we generated to continue to pursue our investment and acquisition strategies and completed two significant acquisitions in 2003. On March 19, 2003, we completed the acquisition of Inktomi Corporation, a provider of Web search and paid inclusion services on the Internet. On October 7, 2003, we completed the acquisition of Overture Services, Inc. a provider of commercial search services on the Internet, including pay-for-performance search services.
Revenue Recognition. Our revenues are derived principally from services, which include marketing services, fees, and listings. We recognize revenue in accordance with Securities and Exchange Commission Staff Accounting Bulletin No. 104 ("SAB 104"), "Revenue Recognition," and Emerging Issues Task Force ("EITF") Issue 00-21, "Revenue Arrangements with Multiple Deliverables." In all cases, revenue is recognized only when the price is fixed or determinable, persuasive evidence of an arrangement exists, the service is performed, and collectibility of the resulting receivable is reasonably assured. The results of operations of acquisitions completed during each year are included in our consolidated statements of operations starting from the date of the acquisition.
Marketing services revenue is primarily generated from the sale of rich media advertisements (banner and other media advertisements), sponsorship and text-link advertisements, (including pay-for-performance search advertisements), paid inclusion, algorithmic searches and transactions revenue. Banner advertising agreements typically range from one week to three years. The Company recognizes marketing services revenue related to banner advertisements as "impressions" are delivered by the Company. "Impressions" are defined as the number of times that an advertisement appears in pages viewed by users of the Yahoo! network. Sponsorship advertising agreements have longer terms than banner advertising agreements, typically ranging from three months to three years, and often involve multiple element arrangements (arrangements with more than one deliverable) that may include placement on specific properties, exclusivity and content integration. Sponsorship advertisement revenues are recognized as "impressions" are delivered or ratably over the contract period, where applicable. Text-link advertisements, including pay-for-performance search advertisements or results are recognized in the period in which the "click-throughs" occur. "Click-throughs" are defined as the number of times a user clicks on an advertisement or search result. Per-query search fees are recognized based on the query volume in the period, and revenue from customers who pay a fixed fee to be included in the Web search index are recognized over the term of the agreement. Transactions revenue includes service fees for facilitating transactions through the Yahoo! network, principally from our commerce properties. Transactions revenue is recognized when there is evidence that the qualifying transactions have occurred and collection of the resulting receivable is reasonably assured.
Revenues from pay-for-performance search and rich media advertisements from our agreement with Overture are included in marketing services for the period from January 1, 2003 through October 7, 2003, the date we acquired Overture, and for the years ended December 31, 2002 and 2001. Revenues from Overture for the period from January 1, 2003 through October 7, 2003 amounted to 12 percent of total revenues for the year ended December 31, 2003. Revenues from Overture amounted to 14 percent of total revenues for the year ended December 31, 2002. No one customer accounted for 10 percent or more of total revenues during 2001.
We have agreements with various affiliates, networks of Web properties that have integrated our search service into their sites, to provide pay-for-performance search results. We pay affiliates based on click-throughs on these listings. In accordance with EITF Issue No. 99-19, "Reporting Revenue Gross as a Principal Versus Net as an Agent," the revenues derived from pay-for-performance search results related to traffic supplied by affiliates are reported gross of
28
the payment to affiliates. This revenue is reported gross primarily due to the fact that we are the primary obligor to the customers of the pay-for-performance search services.
Periodically, we engage in barter transactions for marketing services. Barter revenue is recognized over the periods in which we complete our obligations under the arrangement. We recognize barter revenue in accordance with Emerging Issues Task Force No. 99-17 ("EITF 99-17"), "Accounting for Advertising Barter Transactions," which requires advertising barter transactions to be valued based on similar cash transactions that have occurred within six months prior to the barter transaction, and also Accounting Principles Board No. 29 ("APB 29") "Accounting for Nonmonetary Transactions," which requires nonmonetary transactions to be based on the fair values involved, similar to monetary transactions. Barter revenues represented 1 percent, 2 percent, and 7 percent of total revenues for 2003, 2002, and 2001, respectively. During 2003, 2002, and 2001, we delivered approximately 4.3 billion, 3.5 billion, and 1.6 billion impressions, respectively, under advertising barter arrangements where fair value was not determinable under EITF 99-17, and accordingly revenue was not recognized.
Fees revenue consists of revenues generated from a variety of consumer and business fee-based services, including SBC Yahoo! DSL and Dial, Yahoo! Personals, Small Business Services, Yahoo! Mail, and Yahoo! Enterprise Solutions, including Yahoo! Portal Solutions. With the exception of Yahoo! Portal Solutions, revenue is recognized in the month in which the services are performed, provided that no significant obligations remain and collection of the resulting receivable is reasonably assured. Revenue from Yahoo! Portal Solutions consists of software license and service revenues, which are principally platform and maintenance services. Yahoo! Portal Solutions revenue is recognized in accordance with Statement of Position ("SOP") No. 97-2, "Software Revenue Recognition" and Statement of Position 98-9, "Modification of SOP No. 97-2 with Respect to Certain Transactions." License revenues are recognized when persuasive evidence of arrangement exists, delivery of the license has occurred, the fee is fixed or determinable, and collection is probable. License revenue from Portal Solutions was not material to Yahoo!, as it represented less than one percent of total revenue for all periods presented. Platform services are sold as a subscription and are recognized ratably over the subscription period. Platform services are priced based on the specific content or service purchased by the customer. These services are optional and renewable annually at fixed renewal rates. Maintenance is generally sold under annual contracts with fixed renewal rates. Maintenance revenue is recognized ratably over the contract period. Yahoo! Portal Solutions revenues have represented less than 10 percent of total revenues in all periods presented.
Listings revenue consists of revenues generated from a variety of consumer and business listings-based services, including access to the HotJobs database and classifieds, such as Yahoo! Autos, Yahoo! Real Estate and other search services. Revenues are recognized in the month in which the services are performed, provided that no significant obligations remain and collection of the resulting receivable is reasonably assured.
Results of Operations
Revenues. Revenues by groups of similar service were as follows (dollars in thousands):
|
|
Years Ended December 31, |
|||||||||||||||
|---|---|---|---|---|---|---|---|---|---|---|---|---|---|---|---|---|
|
|
2001 |
(1) |
2002 |
(1) |
2003 |
(1) |
||||||||||
| Marketing services | $ | 570,977 | 79 | % | $ | 651,568 | 68 | % | $ | 1,199,733 | 74 | % | ||||
| Fees | 119,090 | 17 | % | 207,941 | 22 | % | 298,192 | 18 | % | |||||||
| Listings | 27,355 | 4 | % | 93,558 | 10 | % | 127,172 | 8 | % | |||||||
| Total revenues | $ | 717,422 | 100 | % | $ | 953,067 | 100 | % | $ | 1,625,097 | 100 | % | ||||
Marketing Services Revenue. Marketing services revenue for the year ended December 31, 2003 increased by approximately $548 million, or 84 percent as compared to the prior year. The increase was partly due to approximately $279 million of incremental revenue contribution from our 2003 acquisitions. The remainder of the increase was due to growth in the balance of our global legacy marketing services revenue across the entire Yahoo! network, including revenues from our relationship with Overture prior to the acquisition, which occurred in the fourth quarter of 2003. Including the effects of the Overture acquisition, the combined number of impressions and click-throughs increased by approximately 75 percent as compared to 2002, while the combined average price yield per impression and click-through delivered increased by approximately 7 percent. Approximately half of the increase in volume was attributed to Overture, whereas the change in price yield was not materially affected. The
29
increase in legacy volume primarily resulted from the addition of smaller-sized advertising units to certain of our properties, which increased the number of ads per page and inventory available for sale, as well as from an overall increase in total page views. The increase in legacy average price per unit primarily resulted from an overall increase in the price achieved for our network inventory. Marketing services revenue for the year ended December 31, 2002 increased by approximately $81 million, or 14 percent as compared to the prior year. The increase was due to increased revenue of approximately $131 million realized through our worldwide pay-for-performance search services and transactions revenue of approximately $38 million or 117 percent compared to the prior year. The increases were partially offset by a decrease in barter revenues of approximately $36 million, and a decrease of approximately $52 million in renewals of previous advertising arrangements. The number of impressions and click-throughs delivered under advertising arrangements in 2002 increased by approximately 95 percent on a combined basis as compared to 2001, while the average price yield per impression and click-through delivered, also on a combined basis, declined approximately 40 percent for the same period. During the period, our focus remained on obtaining overall advertising dollars rather than maximizing price per unit.
For the year ended December 31, 2003, over 110,000 direct and indirect customers advertised on the Yahoo! network, compared to more than 85,000 during 2002 and more than 53,000 in 2001.
Fees Revenue. Fees revenue in 2003 increased approximately $90 million, or 43 percent, as compared to 2002. Approximately $100 million was associated with an increase in the number of paying users for our fee-based services, which were approximately 4.9 million at December 31, 2003 compared to approximately 2.2 million at December 31, 2002. Average revenue per paying user per month declined from approximately $7 per user per month in 2002 to approximately $5 per user per month in 2003 as a result of faster subscriber growth in some of the lower priced offerings, and the introduction of lower priced fee-based products offered in 2003. As the volume of users who subscribe to lower-priced products increases and as we continue to introduce products at lower average prices, we expect the average revenue per paying user to decrease in 2004 as compared to 2003. The increase in revenues as a result of the increase in paying users was partially offset by an approximate $11 million decline in our enterprise revenue business as a result of our reduced Yahoo! Portal Solutions and Broadcast Solutions efforts during the year. For the year ended December 31, 2002, fees revenue increased approximately $89 million, or 75 percent, as compared to the prior year. The increases were attributable to an increase in the number of paying users for our fee-based services, which were approximately 2.2 million at December 31, 2002 compared to approximately 0.4 million at December 31, 2001. Average revenue per paying user per month declined from approximately $22 per user per month to approximately $7 per user per month as a result of the introduction of new, lower-priced consumer fee-based products, which weren't offered in the previous year, as compared with a mix weighted toward higher priced services in 2001.
Listings Revenue. For the year ended December 31, 2003, listings revenue increased approximately $34 million, or 36 percent, as compared to the prior year, primarily from our Search & Marketplace listings. For the year ended December 31, 2002, listings revenue increased approximately $66 million, or 242 percent, as compared to the prior year, approximately $65 million of which was associated with acquisitions completed in 2002.
Overall, we currently expect total combined revenues for marketing services, fees, and listings to increase in absolute dollars for 2004 compared to 2003.
Costs and Expenses: Primary operating costs and expenses were as follows (dollars in thousands):
|
|
Years Ended December 31, |
|||||||||||||||
|---|---|---|---|---|---|---|---|---|---|---|---|---|---|---|---|---|
|
|
2001 |
(1) |
2002 |
(1) |
2003 |
(1) |
||||||||||
| Cost of revenues | $ | 157,001 | 22 | % | $ | 162,881 | 17 | % | $ | 358,103 | 22 | % | ||||
| Sales and marketing | 383,854 | 54 | % | 429,968 | 45 | % | 530,613 | 33 | % | |||||||
| Product development | 121,475 | 17 | % | 141,766 | 15 | % | 207,285 | 13 | % | |||||||
| General and administrative | 77,960 | 11 | % | 100,676 | 11 | % | 157,027 | 10 | % | |||||||
| Stock compensation expense | 9,096 | 1 | % | 8,402 | 1 | % | 22,029 | 1 | % | |||||||
| Amortization of intangibles | 64,085 | 9 | % | 21,186 | 2 | % | 54,374 | 3 | % | |||||||
Cost of Revenues. Cost of revenues consists of traffic acquisition costs ("TAC") and other expenses associated with the production and usage of the Yahoo! network.
30
Traffic Acquisition Costs. Traffic acquisition costs consist of payments made to our affiliates that have integrated our pay-for-performance search service into their sites. We enter into agreements of varying durations with affiliates that integrate our pay-for-performance search service into their sites. There are generally three economic structures of the affiliate agreements: fixed payments based on a guaranteed minimum amount of traffic delivered, which often carry reciprocal performance guarantees from the affiliate, variable payments based on a percentage of our revenue or based on a certain metric, such as number of searches or paid clicks, or a combination of the two. We expense traffic acquisition costs under two methods; agreements with fixed payments are expensed pro-rata over the term the fixed payment covers, and agreements based on a percentage of revenue, number of paid introductions, number of searches, or other metric are expensed based on the volume of the underlying activity or revenue multiplied by the agreed-upon price or rate.
Other cost of revenues. Other cost of revenues consist of fees paid to third parties for content included on our online media properties, Internet connection charges, equipment depreciation, technology license fees and compensation related expenses.
Cost of revenues for the year ended December 31, 2003 increased approximately $195 million, or 120 percent, as compared to the prior year. This reflects approximately $182 million of incremental cost of revenue related to acquisitions completed in 2003, of which, approximately $153 million related to traffic acquisition costs. The remainder of the increase represented increased search serving, royalties and other content-related costs, as well as increased costs for growing network usage and premium services. Cost of revenues for the year ended December 31, 2002 increased approximately $6 million, or four percent, as compared to the prior year. This reflects approximately $7 million of additional expense due to our 2002 acquisitions, approximately $12 million associated with increased royalties and other content-related costs, as well as increased costs for growing network usage and premium services. The increase in 2002 was partially offset by savings of approximately $13 million from more favorable bandwidth pricing and more efficient bandwidth utilization during 2002.
Cost of revenues was 22 percent, 17 percent, and 22 percent of revenues in 2003, 2002, and 2001, respectively. Cost of revenues as a percentage of revenues does not directly correlate to revenues as many of our service offerings are free.
We currently anticipate that cost of revenues will continue to increase in absolute dollars in 2004 compared to 2003, as network usage is expected to increase and we expect to incur costs relating to introduction of additional content for new and enhanced services. In addition, we believe we will incur higher costs, including TAC, in 2004 as compared to 2003, due to acquisitions made in 2003.
Sales and Marketing. Sales and marketing expenses consist primarily of advertising and other marketing related expenses, compensation related expenses, sales commissions and travel costs.
Sales and marketing expenses for the year ended December 31, 2003, increased approximately $101 million, or 23 percent, as compared to the prior year. Sales and marketing expenses increased by approximately $37 million due to incremental costs related to acquisitions completed in 2003. The remainder of the increase was due to approximately $43 million of increased compensation related and professional services expenses and approximately $21 million in increased advertising spending. Sales and marketing expenses for the year ended December 31, 2002, increased approximately $46 million, or 12 percent, as compared to the prior year. Sales and marketing expenses increased by approximately $57 million due to incremental costs related to our 2002 acquisitions, and approximately $22 million due to increased compensation related expenses, but was partially offset by approximately $34 million in savings from our overall effort to manage discretionary costs and a decrease in barter related expenses. Sales and marketing expenses in 2003, 2002 and 2001 as a percentage of revenues were 33 percent, 45 percent and 54 percent, respectively, and decreased as a result of the overall increase in revenues, and savings as a result of our overall effort to manage discretionary costs.
We currently anticipate that sales and marketing expenses will increase in absolute dollars in 2004 compared to 2003, as the company continues to grow and we will incur incremental costs in 2004 related to acquisitions made in 2003.
Product Development. Product development expenses consist primarily of compensation related expenses incurred for enhancements to and maintenance of the Yahoo! network, classification and organization of listings within Yahoo!
31
properties, research and development expenses, and other operating costs.
Product development expenses for the year ended December 31, 2003, increased approximately $66 million, or 46 percent, as compared to the prior year. Product development expenses increased by approximately $35 million due to incremental costs related to acquisitions completed in 2003. The remainder of the increase was due to approximately $38 million of increases in our total compensation expense related to engineers that develop and enhance properties and services throughout the Yahoo! network. Product development expenses for the year ended December 31, 2002, increased approximately $20 million, or 17 percent, as compared to the prior year. Product development expenses increased by approximately $12 million due to incremental costs related to our 2002 acquisitions, as well as overall increases of approximately $7 million in our total compensation expense related to engineers that develop and enhance properties and services throughout the Yahoo! network. Product development expenses in 2003, 2002 and 2001 as a percentage of revenues were 13 percent, 15 percent and 17 percent, respectively, and decreased as a result of the overall increase in revenues, and savings as a result of our overall effort to manage discretionary costs.
We believe that continued investments in product development are required to remain competitive, and we will incur incremental costs in 2004 related to acquisitions completed in 2003. Consequently, we currently anticipate that product development costs in absolute dollars will increase in 2004 compared to 2003.
General and Administrative. General and administrative expenses consist primarily of compensation related expenses and fees for professional services.
General and administrative expenses for the year ended December 31, 2003, increased approximately $56 million, or 56 percent, as compared to the prior year. General and administrative expenses increased by approximately $17 million due to incremental costs related to acquisitions completed in 2003. The remainder of the increase was primarily due to approximately $19 million of increases in professional services expenses and approximately $12 million of increased compensation-related expenses. General and administrative expenses for the year ended December 31, 2002, increased approximately $23 million, or 29 percent, as compared to the prior year. The increases are attributable to approximately $14 million of increases in compensation related expense and incremental general and administrative expenses, and approximately $13 million of increases in incremental costs related to our 2002 acquisitions. General and administrative expenses as a percentage of sales remained relatively consistent in 2003 compared with 2002 and 2001.
We currently believe that general and administrative expenses in absolute dollars will increase in 2004 compared to 2003, as the company continues to grow, and we expect to incur incremental costs in 2004 related to acquisitions completed in 2003.
Stock Compensation. Stock compensation expense relates to the amortization of the intrinsic value of Yahoo! stock options issued in connection with acquisitions we have completed and other equity-based awards. This expense is being recorded using an accelerated amortization method.
Stock compensation expense for the year ended December 31, 2003, was approximately $22 million, an increase of approximately $14 million, or 162 percent, as compared to the prior year. Stock compensation expense increased in connection with the acquisitions completed in 2003. Stock compensation expense for the year ended December 31, 2002, was approximately $8 million, compared to approximately $9 million for the year ended December 31, 2001. Stock compensation expense is allocated as follows (in thousands):
|
|
Years Ended December 31, |
||||||||
|---|---|---|---|---|---|---|---|---|---|
|
|
2001 |
2002 |
2003 |
||||||
| Sales and marketing | $ | 3,090 | $ | 1,424 | $ | 5,785 | |||
| Product development | 4,615 | 1,702 | 10,526 | ||||||
| General and administrative | 1,391 | 5,276 | 5,718 | ||||||
| Total stock compensation expense | $ | 9,096 | $ | 8,402 | $ | 22,029 | |||
We currently believe that stock compensation expenses in absolute dollars will increase in 2004 compared to 2003.
32
Amortization of Intangibles. From time to time we have purchased, and expect to continue purchasing, assets or businesses, which may result in the creation of intangible assets.
Amortization of intangibles was approximately $54 million, or three percent of revenues for the year ended December 31, 2003, an increase of approximately $33 million compared to $21 million or two percent of revenues for 2002. The year-over-year increase in amortization of intangibles was the result of completed acquisitions. Amortization of intangibles was $21 million, or two percent of revenues for the year ended December 31, 2002, a decrease of approximately $43 million compared to $64 million or nine percent of revenues for 2001 as a result of the cessation of goodwill amortization in connection with the adoption of Statement of Financial Accounting Standards No. 142 ("SFAS 142"), "Goodwill and Other Intangible Assets."
Restructuring Costs. During 2001, we announced restructuring programs to balance our investment in growth areas with the desire to modify our near-term business plan to reflect the current economic and capital market slowdown. These restructuring programs included worldwide workforce reductions, consolidation of excess facilities and other charges. As a result of these restructuring programs, we recorded restructuring costs of approximately $57 million classified as operating expenses in 2001.
Worldwide Workforce Reduction. The restructuring programs resulted in a workforce reduction of approximately 660 employees across certain business functions, operating units, and geographic regions. The worldwide workforce reductions were substantially completed within 2001. We recorded a workforce reduction charge of approximately $15 million in 2001 relating primarily to severance and fringe benefits.
Consolidation of Excess Facilities and Other Charges. We recorded a restructuring charge of approximately $42 million in 2001 relating to the consolidation of excess facilities and other charges. Of this charge, approximately $31 million was primarily for excess facilities relating to lease terminations and non-cancelable lease costs. This charge included estimated sub-lease income based on current comparable rates for leases in the respective markets. If facilities rental rates continue to decrease in these markets or if it takes longer than expected to sublease these facilities, the maximum amount the actual loss could exceed the original estimate is approximately $2 million. Property and equipment that was disposed of or removed from operations resulted in a net charge of approximately $9 million and consisted primarily of furniture and fixtures, servers, leasehold improvements, and computer equipment. We also recorded other restructuring costs of approximately $2 million relating primarily to payments for professional fees incurred with the restructuring program.
A summary of the restructuring costs is as follows (in thousands):
|
|
Workforce reduction |
Consolidation of excess facilities and other charges |
Total |
|||||||
|---|---|---|---|---|---|---|---|---|---|---|
|
|
||||||||||
| Total charge | $ | 15,137 | $ | 42,334 | $ | 57,471 | ||||
| Noncash charges | (5,411 | ) | (9,380 | ) | (14,791 | ) | ||||
| Cash payments | (5,901 | ) | (7,279 | ) | (13,180 | ) | ||||
| Restructuring accrual at December 31, 2001 | 3,825 | 25,675 | 29,500 | |||||||
| Cash payments | (3,825 | ) | (13,930 | ) | (17,755 | ) | ||||
| Restructuring accrual at December 31, 2002 | | 11,745 | 11,745 | |||||||
| Cash payments | | (4,286 | ) | (4,286 | ) | |||||
| Restructuring accrual at December 31, 2003 | $ | | $ | 7,459 | $ | 7,459 | ||||
The restructuring accrual is included on the balance sheet in accrued expenses and other current liabilities. Amounts related to the net lease expense due to the consolidation of facilities will be paid over the respective lease terms through December 2012.
Other Income, Net. Other income, net was as follows (in thousands):
|
|
Years Ended December 31, |
|||||||||
|---|---|---|---|---|---|---|---|---|---|---|
|
|
2001 |
2002 |
2003 |
|||||||
| Interest and investment income | $ | 91,931 | $ | 63,200 | $ | 47,202 | ||||
| Investment gains (losses), net | (26,623 | ) | 2,189 | (1,223 | ) | |||||
| Contract termination fees | 9,000 | 1,661 | 750 | |||||||
| Other | (1,526 | ) | 2,237 | 777 | ||||||
| Total other income, net | $ | 72,782 | $ | 69,287 | $ | 47,506 | ||||
33
Other income, net decreased approximately $22 million in 2003 compared to 2002, primarily as a result of decreased interest and investment income, as a result of reduced interest rates on investments. Interest rates decreased from an average of approximately 3.9 percent in 2002 to 2.3 percent in 2003. Other income, net decreased approximately $3 million in 2002, as compared to 2001. Interest and investment income decreased as a result of lower average investment balances and declining interest rates in 2002 as compared to 2001. Interest rates decreased from an average of approximately 5.6 percent in 2001 to 3.9 percent in 2002. In addition, the Company recorded $9 million of income in 2001 related to early termination of a long-term advertising contract, whereby the customer terminated the remaining portion of its original agreement and agreed to pay the Company a negotiated termination fee to settle the commitment. The Company did not provide the advertising related to the cancelled commitment, and therefore recorded the termination fee as other income. These decreases were partially offset by gains of approximately $2 million on investments in 2002, compared to losses of approximately $27 million on investments in 2001.
Other income, net in future periods may fluctuate as a result of changes in our average investment balances held, changes in market rates or the sale of investments, and investment impairments.
Earnings in Equity Interests. Earnings in equity interests was approximately $48 million for the year ended December 31, 2003 compared to approximately $22 million in 2002 and approximately $4 million in 2001, as a result of our investment in Yahoo! Japan. See Note 8 "Joint Ventures" in the Financial Statements for Yahoo! Japan's condensed financial information.
Minority Interests in Operations of Consolidated Subsidiaries. Minority interests in operations of consolidated subsidiaries represents the minority partners' percentage share of income or losses from such subsidiaries in which we hold a majority ownership interest, but less than 100 percent, and consolidate the subsidiaries' results in our financial statements.
Minority interests in income from operations of consolidated subsidiaries was approximately $6 million, $2 million, and $1 million for 2003, 2002, and 2001, respectively. The change from 2002 to 2003 was due to income in Europe in 2003, compared to losses in 2002, and increased income in Korea. The change from 2001 to 2002 was due to increased income in Korea and reduced losses in Europe. See Note 8 "Joint Ventures."
Income Taxes. The provision for income taxes for 2003, 2002 and 2001 differs from the amount computed by applying the statutory federal rate principally due to foreign losses for which no tax benefit was provided, nondeductible stock-based compensation charges, tax credits, increased valuation allowance related to impairment write-downs of equity investments, and nondeductible costs related to acquisitions.
The increase in the provision for income taxes in 2003 from 2002 of approximately $76 million was primarily a result of increases in Federal and State income taxes, driven by higher pretax income in 2003 compared to 2002. This increase included approximately $9 million of valuation allowance for 2003 compared to approximately $7 million for 2002. The change in valuation allowance from 2002 to 2003 was driven by an increase of foreign losses for which no tax benefit was provided for 2003 as compared to 2002. The effective tax rate for 2003 was 38 percent compared to 40 percent in 2002. The increase in the provision for income taxes in 2002 from 2001 of approximately $60 million was primarily a result of increases in Federal and State income taxes, driven by pretax income for 2002 compared to pretax loss in 2001. This increase was partially offset by non-deductible acquisition related charges in 2001 that did not occur in 2002, which had a tax effect of approximately $20 million, as well as approximately $7 million of increase in the valuation allowance for 2002 compared to approximately $24 million of increases for 2001. The change in valuation allowance from 2001 to 2002 was driven by a significant reduction in impairment write-downs and foreign losses not benefited for 2002 as compared to 2001. The effective tax rate for 2002 was 40 percent compared to a benefit of 13 percent in 2001.
Business Segment Results
We manage our business geographically. Our primary areas of measurement and decision-making are the United States and International. Management relies on an internal management reporting process that provides revenue and segment operating income (loss) before depreciation and amortization for making financial decisions and allocating resources. Segment operating income (loss) before depreciation and amortization, previously referred to as "Segment EBITDA," includes income (loss) from operations before
34
depreciation, amortization of intangible assets and amortization of stock compensation expense. Management believes that segment operating income (loss) before depreciation and amortization is an appropriate measure of evaluating the operational performance of the Company's segments. However, this measure should be considered in addition to, not as a substitute for, or superior to, income (loss) from operations or other measures of financial performance prepared in accordance with generally accepted accounting principles.
Summarized information by segment for 2001, 2002, and 2003, as excerpted from the internal management reports, is as follows (dollars in thousands):
|
|
Years Ended December 31, |
||||||||||||||||
|---|---|---|---|---|---|---|---|---|---|---|---|---|---|---|---|---|---|
|
|
2001 |
(1) |
2002 |
(1) |
2003 |
(1) |
|||||||||||
| Revenues by segment: | |||||||||||||||||
| United States | $ | 594,332 | 83% | $ | 806,598 | 85% | $ | 1,355,153 | 83% | ||||||||
| International | 123,090 | 17% | 146,469 | 15% | 269,944 | 17% | |||||||||||
| Total revenues | $ | 717,422 | 100% | $ | 953,067 | 100% | $ | 1,625,097 | 100% | ||||||||
Segment operating income (loss) before depreciation and amortization: |
|||||||||||||||||
| United States | $ | 16,611 | $ | 212,721 | $ | 441,372 | |||||||||||
| International | (35,210 | ) | (6,742 | ) | 36,011 | ||||||||||||
| Total segment operating income (loss) before depreciation and amortization | (18,599 | ) | 205,979 | 477,383 | |||||||||||||
Corporate and unallocated operating costs and expenses: |
|||||||||||||||||
| Depreciation and amortization | (130,575 | ) | (109,389 | ) | (159,688 | ) | |||||||||||
| Stock compensation expense | (9,096 | ) | (8,402 | ) | (22,029 | ) | |||||||||||
| Income (loss) from operations | $ | (158,270 | ) | $ | 88,188 | $ | 295,666 | ||||||||||
Revenue is attributed to individual countries according to the international online property that generated the revenue. No single foreign country accounted for more than 10 percent of revenues in 2003, 2002, and 2001.
United States. United States revenues in 2003 increased approximately $549 million, or 68 percent in absolute dollars primarily due to approximately $226 million of incremental revenue contribution from acquisitions completed in 2003, as well as growth in the legacy properties on the Yahoo! network. United States segment operating income before depreciation and amortization increased approximately $229 million, or 107 percent from 2002 to 2003 primarily as a result of the increase in revenues, as well as continued efforts to control discretionary spending. United States revenues in 2002 increased $212 million, or 36 percent, as well as increased as a percentage of revenues primarily due to increased revenue from our search and directory and personals properties, as well as revenue from 2002 acquisitions. United States segment operating income before depreciation and amortization increased approximately $196 million, or 1181 percent from 2001 to 2002 as a result of the increase in revenues.
International. International revenues in 2003 increased approximately $123 million, or 84 percent, primarily due to approximately $53 million of incremental revenue contribution from acquisitions completed in 2003, increased growth in the legacy properties on the Yahoo! network, and the strengthening of the Asian and European markets in which we operate. International segment operating income (loss) before depreciation and amortization increased approximately $43 million from 2002 to 2003, primarily due to the increase in revenues and continued efforts to control discretionary spending. International revenues in 2002 increased approximately $23 million, or 19 percent, primarily due to the strengthening of the Asian markets in which we operate, and increases in Yahoo! Enterprise Solutions and transactions revenue, partially offset by a soft advertising market in Europe. International segment operating income (loss) before depreciation and amortization increased approximately $28 million from 2001 to 2002, primarily due to the non-recurrence of the 2001 restructuring programs and a reduction in discretionary spending.
Acquisitions
Inktomi Corporation
On March 19, 2003, we completed the acquisition of Inktomi, a provider of Web search and paid inclusion services on the Internet. The acquisition combined our global audience and Inktomi's search technology to allow us to create a more relevant, comprehensive and higher quality search offering on the Web. These factors contributed to a purchase price in excess of the fair value of the Inktomi net tangible and intangible assets acquired, and as
35
a result, we have recorded approximately $217 million of goodwill in connection with this transaction.
The total estimated purchase price of approximately $290 million consisted of approximately $273 million in cash consideration, approximately $14 million related to approximately one million stock options exchanged, and direct transaction costs of approximately $3 million. The $273 million of total cash consideration less cash acquired of approximately $45 million resulted in a net cash outlay of approximately $228 million. The value of the stock options was determined using the Black-Scholes option valuation model.
The preliminary allocation of the purchase price to the assets acquired and liabilities assumed based on the estimated fair values was as follows (in thousands):
| Cash acquired | $ | 44,610 | |||
| Other tangible assets acquired | 27,537 | ||||
| Amortizable intangible assets | |||||
| Existing technology and patents | 25,900 | ||||
| Customer contracts and related relationships | 23,500 | ||||
| Goodwill | 217,119 | ||||
| Total assets acquired | 338,666 | ||||
Liabilities assumed |
(50,347 |
) |
|||
| Deferred stock-based compensation | 1,287 | ||||
| Total | $ | 289,606 | |||
Amortizable intangible assets consist of customer-related intangible assets and developed technology with useful lives not exceeding five years. A preliminary estimate of approximately $217 million has been allocated to goodwill. Goodwill represents the excess of the purchase price over the fair value of the net tangible and intangible assets acquired, and is not deductible for tax purposes. Goodwill will not be amortized and will be tested for impairment, at least annually. The preliminary purchase price allocation for Inktomi is subject to revision as more detailed analysis is completed and additional information on the fair value of assets and liabilities becomes available. Any change in the fair value of the net assets of Inktomi will change the amount of the purchase price allocable to goodwill. Liabilities assumed included approximately $23 million of restructuring costs associated with the acquisition, approximately $6 million of which related to workforce reduction and the remainder related to excess facilities. As of December 31, 2003, approximately $17 million remains related to excess facilities. This amount includes estimated sub-lease income based on current comparable rates for leases in the respective markets. If facilities rental rates continue to decrease in these markets or if it takes longer than expected to sublease these facilities, the maximum amount the actual loss could exceed the original estimate is approximately $2 million.
Overture
On October 7, 2003, Yahoo! completed the acquisition of Overture, a provider of commercial search services on the Internet, including pay-for-performance search services. Yahoo! believes that the combined assets will further position it as a leader in the Internet advertising sector. Together, the two companies will be able to provide a diversified suite of integrated marketing solutions, including branding, paid placement, graphical ads, text-links, multimedia, and contextual advertising. These factors contributed to a purchase price in excess of the fair market value of the net tangible and intangible assets acquired from Overture, and as a result, the Company has recorded approximately $1.2 billion of goodwill in connection with this transaction. See Note 12 "Segments" for information related to revenues generated from the Company's agreement with Overture.
Under the terms of the acquisition agreement, each outstanding share of Overture was exchanged for 0.6108 shares of Yahoo! common stock, representing approximately 40 million shares valued at approximately $1.3 billion, and $4.75 in cash, which amounts to approximately $309 million in aggregate cash, and together with approximately $136 million related to approximately 10 million stock options exchanged and direct transaction costs of approximately $10 million resulted in an aggregate purchase price of approximately $1.7 billion. The $309 million of total cash consideration less cash acquired of approximately $161 million resulted in a net cash outlay of approximately $148 million. The value of the common stock was determined based on the average market price of the common stock over the 5-day period surrounding the date the acquisition was announced in July 2003. The value of the stock options was determined using the Black-Scholes option valuation model.
36
The preliminary allocation of the purchase price to the assets acquired and liabilities assumed based on the estimated fair values was as follows (in thousands):
| Cash acquired | $ | 160,673 | |||
| Other tangible assets acquired | 218,308 | ||||
| Amortizable intangible assets | |||||
| Existing technology and patents | 134,300 | ||||
| Affiliate and advertiser contracts and related relationships | 202,300 | ||||
| Trade name, trademark, and domain name | 17,300 | ||||
| Goodwill | 1,166,620 | ||||
| Total assets acquired | 1,899,501 | ||||
Liabilities assumed |
(240,952 |
) |
|||
| Deferred stock-based compensation | 74,588 | ||||
| Total | $ | 1,733,137 | |||
A preliminary estimate of approximately $354 million has been allocated to amortizable intangible assets consisting of existing technology, patents, affiliate and advertiser contracts and related relationships, trade names, trademarks and domain names with useful lives not exceeding five years.
Other tangible assets acquired of approximately $218 million includes long-term prepaid traffic acquisition costs paid by Overture to Yahoo! of approximately $30 million. Liabilities assumed of approximately $241 million includes a current liability for traffic acquisition costs owed by Overture to Yahoo! of approximately $28 million.
A preliminary estimate of $1.2 billion has been allocated to goodwill. Goodwill represents the excess of the purchase price over the fair value of the net tangible and amortizable intangible assets acquired, and is not deductible for tax purposes. Goodwill will not be amortized and will be tested for impairment, at least annually. The preliminary purchase price allocation for Overture is subject to revision as more detailed analysis is completed and additional information on the fair value of Overture's assets and liabilities becomes available. Any change in the fair value of the net assets of Overture will change the amount of the purchase price allocable to goodwill.
Liabilities assumed included approximately $26 million of restructuring costs associated with the acquisition, approximately $18 million of which related to workforce reduction and approximately $8 million related to excess facilities. As of December 31, 2003, approximately $6 million remains related to remaining severance costs and approximately $7 million related to excess facilities.
See Note 6 "Acquisitions" in the Financial Statements for further discussion of acquisitions that we have made in 2003, 2002, and 2001.
Related Party Transactions
SOFTBANK Corp., including its consolidated affiliates ("SOFTBANK"), was approximately a four percent stockholder at December 31, 2003. We have joint ventures with SOFTBANK in France, Germany, Japan, Korea and the United Kingdom to establish and manage versions of the Yahoo! Internet Guide for those countries. A Managing Partner of a SOFTBANK affiliate is also a member of our Board of Directors. Revenues from SOFTBANK accounted for less than one percent of revenues for the year ended December 31, 2003 and approximately one percent of revenues for the years ended December 31, 2002 and 2001. We believe contracted prices are comparable to those with our other similarly situated customers.
The Company and other third parties are limited partners in Softbank Capital Partners LP ("Softbank Capital"), a venture capital fund for which a SOFTBANK affiliate is the General Partner. The Company initially committed to a total investment of $30 million in the fund, and subsequently committed to invest an additional $6 million. To date, the total investment by the Company in Softbank Capital is approximately $34 million. Pursuant to the Partnership Agreement, the Company invested on the same terms and on the same basis as all other limited partners.
See Item 13 of this Form 10-K "Certain Relationships and Related Transactions," Note 7 "Related Party Transactions" and Note 8 "Joint Ventures" in the Financial Statements for further information related to transactions with related parties.
Critical Accounting Estimates
Our discussion and analysis of our financial condition and results of operations is based upon our consolidated financial statements, which have been prepared in accordance with accounting principles generally accepted in the United States. The preparation of these financial statements requires us to make estimates and judgments that affect the reported amounts of assets, liabilities, revenues and expenses, and related disclosure of contingent assets
37
and liabilities. On an on-going basis, we evaluate our estimates, including those related to uncollectible receivables, investment values, intangible assets, income taxes, restructuring costs and contingencies. We base our estimates on historical experience and on various other assumptions that are believed to be reasonable under the circumstances, the results of which form the basis for making judgments about the carrying values of assets and liabilities that are not readily apparent from other sources. Actual results may differ from these estimates under different assumptions or conditions.
We believe the following critical accounting estimates are affected by more significant judgments used in the preparation of our consolidated financial statements: revenue recognition; valuation allowances, specifically the allowance for doubtful accounts and deferred tax assets; accounting for investments in private and publicly-traded securities; and goodwill and other intangible asset impairment.
Revenue recognition. Our revenues are primarily generated from the sale of rich media advertisements (banner and other media advertisements), sponsorship, and text-link advertisements, including pay-for-performance search advertisements, paid inclusion and algorithmic searches, transactions revenue, and revenue generated from a variety of consumer and business fee and listings-based services. In accordance with generally accepted accounting principles in the United States, the recognition of these revenues is partly based on our assessment of the probability of collection of the resulting accounts receivable balance. As a result, the timing or amount of revenue recognition may have been different if different assessments of the probability of collection of accounts receivable had been made at the time the transactions were recorded in revenue.
Valuation Allowances. We maintain allowances for doubtful accounts for estimated losses resulting from the inability of our customers to make required payments. If the financial condition of our customers were to deteriorate, resulting in an impairment of their ability to make payments, additional allowances may be required.
We record a valuation allowance to reduce our deferred tax assets to the amount that is more likely than not to be realized. While we have considered future taxable income and ongoing prudent and feasible tax planning strategies in assessing the need for the valuation allowance, in the event we were to determine that we would be able to realize our deferred tax assets in the future in excess of its net recorded amount, an adjustment to the valuation allowance would likely increase stockholders' equity as substantially all of our net operating losses result from employee stock option deductions.
Accounting for investments in private and publicly-traded securities. We hold equity interests in companies, some of which are publicly traded and have highly volatile share prices. We record an investment impairment charge when we believe an investment has experienced a decline in value that is judged to be other than temporary. We monitor our investments for impairment by considering current factors including economic environment, market conditions and the operational performance and other specific factors relating to the business underlying the investment. Future adverse changes in these factors could result in losses or an inability to recover the carrying value of the investments that may not be reflected in an investment's current carrying value, thereby possibly requiring an impairment charge in the future. We recorded approximately $8 million of impairments on the carrying value of equity securities during 2003.
Goodwill and Other Intangible Assets. Our long-lived assets include goodwill and other intangible assets. Statement of Financial Accounting Standards No. 142 "Goodwill and Other Intangible Assets" ("SFAS 142") requires that goodwill be tested for impairment at the reporting unit level (operating segment or one level below an operating segment) on an annual basis and between annual tests in certain circumstances. Application of the goodwill impairment test requires judgment, including the identification of reporting units, assigning assets and liabilities to reporting units, assigning goodwill to reporting units, and determining the fair value of each reporting unit. Significant judgments required to estimate the fair value of reporting units include estimating future cash flows, determining appropriate discount rates and other assumptions. Changes in these estimates and assumptions could materially affect the determination of fair value for each reporting unit.
Effective January 1, 2002, we adopted SFAS 142 and performed a transitional test of our goodwill and intangible assets. Due to, among other things, the overall softening of the global economy and the related decline in international advertising, the Company recorded a goodwill impairment loss of $64 million, which was recorded during the first quarter of 2002 as a cumulative effect of an
38
accounting change in the Company's consolidated financial statements. The fair value of the reporting unit giving rise to the transitional impairment loss was estimated using the expected present value of future cash flows. Any further impairment losses recorded in the future could have a material adverse impact on our financial conditions and results of operations.
Statement of Financial Accounting Standards No. 144 "Accounting for the Impairment or Disposal of Long-Lived Assets" ("SFAS 144"), requires that we record an impairment charge on finite-lived intangibles or long-lived assets to be held and used when we determine that the carrying value of intangible assets and long-lived assets may not be recoverable. Based on the existence of one or more indicators of impairment, we measure any impairment of intangibles or long-lived assets based on a projected discounted cash flow method using a discount rate determined by our management to be commensurate with the risk inherent in our business model. Our estimates of cash flows require significant judgment based on our historical results and anticipated results and are subject to many factors.
The Company performed its annual assessment of goodwill and other intangible assets in 2002 and 2003, and concluded that there were no additional impairments.
Recent Accounting Pronouncements
In January 2003, the Financial Accounting Standards Board ("FASB") issued Interpretation No. 46 ("FIN 46") "Consolidation of Variable Interest Entities." Until this interpretation, a company generally included another entity in its consolidated financial statements only if it controlled the entity through voting interests. FIN 46 requires a variable interest entity, as defined, to be consolidated by a company if that company is subject to a majority of the risk of loss from the variable interest entity's activities or entitled to receive a majority of the entity's residual returns. Certain provisions of FIN 46 were deferred until the period ending after March 15, 2004. The adoption of FIN 46 for provisions effective during 2003 did not have a material impact on the Company's financial position, cash flows or results of operations.
In April 2003, the FASB issued SFAS No. 149, "Amendment of Statement 133 on Derivative Instruments and Hedging Activities" ("SFAS 149"), which amends SFAS 133 for certain decisions made by the FASB Derivatives Implementation Group. In particular, SFAS 149: (1) clarifies under what circumstances a contract with an initial net investment meets the characteristic of a derivative, (2) clarifies when a derivative contains a financing component, (3) amends the definition of an underlying to conform it to language used in FASB Interpretation No. 45 "Guarantor's Accounting and Disclosure Requirements for Guarantees, Including Indirect Guarantees of Indebtedness of Others," and (4) amends certain other existing pronouncements. This Statement is effective for contracts entered into or modified after June 30, 2003, and for hedging relationships designated after June 30, 2003. In addition, most provisions of SFAS 149 are to be applied prospectively. The adoption of SFAS 149 did not have a material impact on the Company's financial position, cash flows or results of operations.
In May 2003, the FASB issued SFAS No. 150, "Accounting for Certain Financial Instruments with Characteristics of Both Liabilities and Equity" ("SFAS 150"). SFAS 150 changes the accounting for certain financial instruments that under previous guidance issuers could account for as equity. It requires that those instruments be classified as liabilities in balance sheets. The guidance in SFAS 150 is generally effective for all financial instruments entered into or modified after May 31, 2003, and otherwise is effective on July 1, 2003. The adoption of SFAS 150 did not have a material impact on the Company's financial position, cash flows or results of operations.
Liquidity and Capital Resources
In summary, our cash flows were (in thousands):
|
|
Years Ended December 31, |
|||||||||
|---|---|---|---|---|---|---|---|---|---|---|
|
|
2001 |
2002 |
2003 |
|||||||
| Net cash provided by operating activities | $ | 106,850 | $ | 302,448 | $ | 428,144 | ||||
| Net cash used in investing activities | (207,173 | ) | (345,854 | ) | (1,121,589 | ) | ||||
| Net cash provided by (used in) financing activities | 18,290 | (21,810 | ) | 1,086,326 | ||||||
We invest excess cash predominantly in debt instruments that are highly liquid, of high-quality investment grade, and predominantly have maturities of less than two years with the intent to make such funds readily available for operating purposes, including expansion of operations and
39
potential acquisitions or other transactions. As of December 31, 2003, we had cash, cash equivalents, and investments in marketable debt securities totaling approximately $2.6 billion compared to approximately $1.5 billion as of both December 31, 2002 and 2001.
Cash provided by operating activities of $428 million for 2003 primarily consists of net income of $238 million adjusted for certain non-cash items of $276 million, including depreciation, amortization, tax benefits from stock options, cumulative effect of accounting change, earnings in equity interests, (gains) losses and impairments from investments, minority interests in operations of consolidated subsidiaries, restructuring costs, stock compensation expense and other non-cash items, partially offset by approximately $86 million of changes in working capital and other activities. Working capital changes included an increase in accounts receivable balances of approximately $122 million, reflecting increases in accounts receivable related to both our legacy business and to acquisitions completed during 2003. The days sales outstanding metric ("DSO") remained relatively flat in 2003 compared to 2002. Our customer profile is increasingly trending toward a higher mix of advertising agency business, which traditionally carries longer payment terms, and therefore we believe that DSO may increase in 2004 compared to 2003. Deferred revenue balances also increased approximately $33 million in 2003 compared to 2002, which reflects growth in deferred revenue related to both the legacy Yahoo! business and to acquisitions completed in 2003. The increase in cash provided by operating activities from 2002 to 2003 was primarily the result of higher net income, which resulted from higher revenues and continued cost control efforts. Cash provided by operating activities in 2002 of approximately $302 million consisted primarily of net income of approximately $43 million adjusted for non-cash items of approximately $221 million and approximately $38 million provided by working capital and other activities. The increase from 2001 to 2002 was primarily a result of net income in 2002 compared to net loss in 2001. Cash provided by operating activities in 2001 of approximately $107 million consisted primarily of a net loss of approximately $93 million adjusted for non-cash items of approximately $185 million and approximately $15 million provided by working capital and other activities.
Cash used in investing activities in 2003 of approximately $1.1 billion was primarily attributable to purchases (net of sales and maturities) of investments in marketable securities during the year of approximately $628 million, cash used in acquisitions and purchases of other investments (net of cash acquired) of $377 million, and capital expenditures totaling approximately $117 million. Capital expenditures have generally comprised purchases of computer hardware, software, server equipment and furniture and fixtures, and are expected to range from $160 million to $190 million in 2004 as we invest in expansion of our network and capabilities. Cash used in investing activities increased from 2002 to 2003 primarily as a result of the net purchases of marketable securities related to higher cash balances available for investing, as well as more cash used for acquisitions in 2003 compared to 2002. Cash used in investing activities in 2002 of approximately $346 million was primarily attributable to cash used in acquisitions and purchases of other investments (net of cash acquired) of approximately $196 million, purchases (net of sales and maturities) of investments in marketable securities during the year of approximately $98 million, and capital expenditures totaling approximately $52 million. Cash used in investing activities increased from 2001 to 2002 primarily as a result of increased cash used for acquisitions in 2002 compared to 2001, as well as net purchases of investments in 2002, compared to net proceeds from investments in 2001. Cash used in investing activities in 2001 of approximately $207 million was primarily attributable to cash used to secure restricted investments related to our leased facilities of approximately $229 million, capital expenditures totaling approximately $86 million and cash used in acquisitions and purchases of other investments (net) of approximately $21 million, partially offset by proceeds from sales and maturities (net of purchases) of investments in marketable securities during the year of approximately $129 million.
Cash provided by financing activities in 2003 of $1.1 billion was primarily due to proceeds from issuance of debt of $733 million and proceeds from the issuance of common stock pursuant to stock option exercises of $353 million. The debt matures in April 2008, unless converted into Yahoo! common stock at a conversion price of $41.00 per share, subject to adjustment upon the occurrence of certain events. Upon conversion, Yahoo! has the right to deliver cash in lieu of common stock. See Note 10 "Long-Term Debt" in the Financial Statements for further information related to the issuance of debt.
40
Cash provided by financing activities will be used for general corporate purposes, including potential future acquisitions or other transactions. Cash used in financing activities in 2002 of $22 million was primarily due to the repurchase of common stock of $100 million, offset by proceeds from the issuance of common stock pursuant to stock option exercises of $78 million. Cash provided by financing activities in 2001 of $18 million was primarily due to proceeds from the issuance of common stock pursuant to stock option exercises of $84 million, offset by common stock repurchases of $60 million and other financing activities of $6 million. See Note 11 "Stockholders' Equity" in the Financial Statements for further information related to the Company's repurchase of common stock.
Operating Leases
During 1999, we entered into agreements for the development of an office complex in Sunnyvale, California to serve as our headquarters. Upon substantial completion of the construction in 2001, approximately $259 million was funded for the complex in connection with the lease financing arrangement, and at December 31, 2001 such amount had been classified as restricted long-term investments. During July 2002, the Company exercised its right, pursuant to the master lease agreement to acquire the complex for approximately $259 million, which was funded by the restricted long-term investments.
We have entered into various non-cancelable operating lease agreements for our other offices throughout the United States and for our international subsidiaries for original lease periods ranging from six months to 15 years and expiring between 2004 and 2018.
In addition, we have entered into various sublease arrangements associated with our excess facilities under the 2001 restructuring programs. Such subleases have terms extending through 2006 and amounts estimated to be received have been included in determining the restructuring accrual.
Net lease commitments as of December 31, 2003 can be summarized as follows (in millions):
|
Years ending December 31, |
Gross lease commitments |
Sublease income |
Net lease commitments |
||||||
|---|---|---|---|---|---|---|---|---|---|
| 2004 | $ | 43 | $ | (7 | ) | $ | 36 | ||
| 2005 | 34 | (4 | ) | 30 | |||||
| 2006 | 25 | (3 | ) | 22 | |||||
| 2007 | 21 | | 21 | ||||||
| 2008 | 16 | | 16 | ||||||
| Due after 5 years | 104 | | 104 | ||||||
| Total net lease commitments | $ | 243 | $ | (14 | ) | $ | 229 | ||
Other Commitments
In the ordinary course of business, we enter into various arrangements with vendors and other business partners, principally for marketing, bandwidth and content arrangements. There are no material commitments for these arrangements extending beyond 2004.
In connection with our commercial agreements, we provide indemnifications of varying scope and terms to customers, business partners and other parties with respect to certain matters, including, but not limited to, losses arising out of our breach of such agreements and out of intellectual property infringement claims made by third parties. In addition, we have entered into indemnification agreements with our directors and certain of our officers that will require us, among other things, to indemnify them against certain liabilities that may arise by reason of their status or service as directors or officers. We maintain director and officer insurance, which may cover certain liabilities arising from our obligation to indemnify our directors and officers in certain circumstances. The indemnification provided by us to our officers and directors does not have a stipulated maximum, therefore we are not able to develop a reasonable estimate of the maximum liabilities. To date, we have not incurred material costs as a result of such obligations and have not accrued any liabilities related to such indemnification obligations in our financial statements.
We continue to increase capital expenditures and operating lease commitments, which is consistent with our increased staffing and operational expansion, and we anticipate that this will continue in the future as business conditions merit. Additionally, we will continue to evaluate possible acquisitions of, or investments in businesses, products, and technologies that are complementary to our
41
business, which may require the use of cash. Management believes existing cash and investments will be sufficient to meet operating requirements for at least the next twelve months; however, we may sell additional equity or debt securities or obtain credit facilities to further enhance our liquidity position beyond 2004. The sale of additional securities could result in additional dilution to our stockholders.
On April 21, 2003, Overture completed its purchase of the Web Search unit of Fast Search and Transfer ASA, a Norway based developer of search and real-time filtering technologies, for $70 million in cash, plus a contingent earn-out payment of up to $30 million over three years based on specified operating criteria. The earn-out payment is not included in the table above.
On January 2, 2004, we completed our acquisition of 3721 Network Software Company Limited, a China-based software development company. Under the terms of the acquisition, we have agreed to pay a total of approximately $120 million in cash over two years, subject to certain performance conditions. In January 2004, approximately $50 million of the total commitment was paid. The remaining $70 million is a contingent earn-out payment over the two-year period ending December 31, 2005. The earn-out payment is not included in the table below.
Contractual Obligations. Contractual obligations at December 31, 2003 are as follows (in millions):
|
|
Payments due by period |
|||||||||||||||
|---|---|---|---|---|---|---|---|---|---|---|---|---|---|---|---|---|
|
|
Total |
Less than 1 year |
1-3 years |
3-5 years |
More than 5 years |
|||||||||||
|
|
||||||||||||||||
| Long-term debt (1) | $ | 750 | $ | | $ | | $ | 750 | $ | | ||||||
| Operating lease obligations, net of sublease income | 229 | 36 | 52 | 37 | 104 | |||||||||||
| Affiliate commitments (2) | 92 | 74 | 17 | 1 | | |||||||||||
| Noncancelable purchase obligations | 42 | 28 | 14 | | | |||||||||||
| Total contractual obligations | $ | 1,113 | $ | 138 | $ | 83 | $ | 788 | $ | 104 | ||||||
At December 31, 2003 and 2002, we did not have any relationships with unconsolidated entities or financial partnerships, such as entities often referred to as structured finance or special purpose entities, which would have been established for the purpose of facilitating off-balance sheet arrangements or other contractually narrow or limited purposes. As such, we are not exposed to any financing, liquidity, market or credit risk that could arise if we had engaged in such relationships.
Item 7a. Quantitative and Qualitative Disclosures about Market Risk
We are exposed to the impact of interest rate changes, foreign currency fluctuations, and changes in the market values of our investments.
Interest Rate Risk. Our exposure to market rate risk for changes in interest rates relates primarily to our investment portfolio. We have not used derivative financial instruments to hedge our investment portfolio. We invest excess cash in debt instruments of the U.S. Government and its agencies, and in high-quality corporate issuers and, by policy, limit the amount of credit exposure to any one issuer. We protect and preserve invested funds by limiting default, market and reinvestment risk.
Investments in both fixed rate and floating rate interest earning instruments carry a degree of interest rate risk. Fixed rate securities may have their fair market value adversely impacted due to a rise in interest rates, while floating rate securities may produce less income than expected if interest rates fall. Due in part to these factors, our future investment income may fall short of expectations due to changes in interest rates or we may suffer losses in principal if forced to sell securities which have declined in market value due to changes in interest rates. As of December 31, 2003, we had investments in debt securities with maturities between three months and one year of approximately $596 million. Such investments had a weighted-average yield of approximately 2.12 percent. Investments in debt securities with maturities between one and five years of approximately $1.3 billion had a weighted average yield of approximately 2.37 percent. A
42
hypothetical 100 basis point increase in interest rates would result in approximately $25 million decrease (approximately one percent) in the fair value of our available-for-sale securities at December 31, 2003.
The fair market value of our zero coupon senior convertible notes is subject to interest rate risk. Generally, the fair market value of fixed interest rate debt will increase as interest rates fall and decrease as interest rates rise. The interest changes affect the fair market value but do not impact our financial position, cash flows, or results of operations. As of December 31, 2003, the fair value of the zero coupon senior convertible notes was approximately $966 million based on quoted market prices.
Foreign Currency Risk. International revenues from our foreign subsidiaries accounted for approximately 17 percent of total revenues during 2003. International sales are made mostly from our foreign sales subsidiaries in their respective countries and are typically denominated in the local currency of each country. These subsidiaries also incur most of their expenses in the local currency. Accordingly, all foreign subsidiaries use the local currency as their functional currency.
Our international business is subject to risks, including, but not limited to differing economic conditions, changes in political climate, differing tax structures, other regulations and restrictions, and foreign exchange rate volatility when compared to the United States. Accordingly, our future results could be materially adversely impacted by changes in these or other factors.
Our exposure to foreign exchange rate fluctuations arises in part from intercompany accounts in which costs incurred in the United States are charged to our foreign sales subsidiaries. These intercompany accounts are typically denominated in the functional currency of the foreign subsidiary. We are also exposed to foreign exchange rate fluctuations as the financial statements of foreign subsidiaries are translated into U.S. dollars in consolidation. As exchange rates vary, these results, when translated, may vary from expectations and adversely impact overall expected profitability. The effect of foreign exchange rate fluctuations for 2003 was not material.
Investment Risk. We have invested in equity instruments of privately-held companies for business and strategic purposes. These investments are included in other long-term assets and are accounted for under the cost method when ownership is less than 20 percent and we do not have the ability to exercise significant influence over operations. Since our initial investment, certain of these investments in privately-held companies have become marketable equity securities upon the investees completing initial public offerings. Such investments are subject to significant fluctuations in fair market value due to the volatility of the stock market and are recorded as long-term investments. For these investments in public and privately-held companies, our policy is to monitor these investments for impairment by considering current factors including economic environment, market conditions and operational performance and other specific factors relating to the business underlying the investment, and record reductions in carrying value when necessary. An impairment in the carrying value of our privately held investments of 5 percent would result in a decrease in the carrying value of our privately held investments of approximately $2 million.
The primary objective of our investment activities is to preserve principal while at the same time maximizing yields without significantly increasing risk. To achieve this objective, we maintain our portfolio of cash equivalents, short-term and long-term investments in a variety of securities, including both government and corporate obligations and money market funds. As of December 31, 2003 the net unrealized gains on these investments were not material.
We are exposed to market risk as it relates to changes in the market value of our investments. We invest in equity instruments of public companies, certain of which may be classified as derivatives, for business and strategic purposes and have classified these securities as available-for-sale. These available-for-sale equity investments are subject to significant fluctuations in fair value due to the volatility of the stock market and the industries in which these companies participate. We have realized gains and losses from both the sale of investments, as well as mergers and acquisitions of companies in which we have invested. As of December 31, 2003, we had available-for-sale equity investments with a fair value of approximately $4 million and a cost basis of approximately $4 million. The net unrealized gains have been recorded net of deferred taxes as a separate component of stockholders' equity and gains on derivatives of approximately $1 million have been recorded in other income on the statement of operations. Our objective in managing exposure to stock market fluctuations is to minimize the impact of stock market declines to earnings and cash flows. However, continued market volatility, as well as mergers and acquisitions, have the potential to have a material non-cash impact on our operating results in future periods.
43
Item 8. Financial Statements and Supplementary Data
|
|
Page |
||
|---|---|---|---|
| Index To Consolidated Financial Statements | |||
Consolidated Financial Statements: |
|||
|
Report of Independent Auditors |
45 |
||
|
Consolidated Statements of Operations for each of the three years in the period ended December 31, 2003 |
46 |
||
|
Consolidated Balance Sheets at December 31, 2002 and 2003 |
47 |
||
|
Consolidated Statements of Cash Flows for each of the three years in the period ended December 31, 2003 |
48 |
||
|
Consolidated Statements of Stockholders' Equity for each of the three years in the period ended December 31, 2003 |
50 |
||
|
Notes to Consolidated Financial Statements |
51 |
||
Financial Statement Schedules: |
|||
|
II Valuation and Qualifying Accounts for each of the three years in the period ended December 31, 2003 |
74 |
||
|
All other schedules are omitted because they are not applicable or the required information is shown in the Consolidated Financial Statements or Notes thereto. |
|||
Supplementary Financial Data: |
|||
|
Selected Quarterly Financial Data (unaudited) for the two years ended December 31, 2003 |
75 |
||
44
Report of Independent Auditors
To the Board of Directors and Stockholders of Yahoo! Inc.:
In our opinion, the consolidated financial statements listed in the accompanying index present fairly, in all material respects, the financial position of Yahoo! Inc. and its subsidiaries at December 31, 2002 and 2003, and the results of their operations and their cash flows for each of the three years in the period ended December 31, 2003 in conformity with accounting principles generally accepted in the United States of America. In addition, in our opinion, the financial statement schedule listed in the accompanying index presents fairly, in all material respects, the information set forth therein when read in conjunction with the related consolidated financial statements. These financial statements and financial statement schedule are the responsibility of the Company's management; our responsibility is to express an opinion on these financial statements and financial statement schedule based on our audits. We conducted our audits of these statements in accordance with auditing standards generally accepted in the United States of America, which require that we plan and perform the audit to obtain reasonable assurance about whether the financial statements are free of material misstatement. An audit includes examining, on a test basis, evidence supporting the amounts and disclosures in the financial statements, assessing the accounting principles used and significant estimates made by management, and evaluating the overall financial statement presentation. We believe that our audits provide a reasonable basis for our opinion.
As discussed in Note 4 to the accompanying consolidated financial statements, effective January 1, 2002, the Company changed its method of accounting for goodwill in accordance with Statement of Financial Accounting Standards No. 142, "Goodwill and Other Intangible Assets."
/s/ PricewaterhouseCoopers LLP
San
Jose, California
February 25, 2004
45
Consolidated Statements of Operations YAHOO! INC.
(in thousands, except per share amounts)
|
|
Years Ended December 31, |
|||||||||||
|---|---|---|---|---|---|---|---|---|---|---|---|---|
|
|
2001 |
2002 |
2003 |
|||||||||
|
|
||||||||||||
| Revenues | $ | 717,422 | $ | 953,067 | $ | 1,625,097 | ||||||
| Cost of revenues | 157,001 | 162,881 | 358,103 | |||||||||
| Gross profit | 560,421 | 790,186 | 1,266,994 | |||||||||
Operating expenses: |
||||||||||||
| Sales and marketing | 383,854 | 429,968 | 530,613 | |||||||||
| Product development | 121,475 | 141,766 | 207,285 | |||||||||
| General and administrative | 77,960 | 100,676 | 157,027 | |||||||||
| Stock compensation expense(1) | 9,096 | 8,402 | 22,029 | |||||||||
| Amortization of intangibles | 64,085 | 21,186 | 54,374 | |||||||||
| Restructuring costs | 57,471 | | | |||||||||
| Acquisition-related costs | 4,750 | | | |||||||||
| Total operating expenses | 718,691 | 701,998 | 971,328 | |||||||||
Income (loss) from operations |
(158,270 |
) |
88,188 |
295,666 |
||||||||
| Other income, net | 72,782 | 69,287 | 47,506 | |||||||||
| Earnings in equity interests | 4,356 | 22,301 | 47,652 | |||||||||
| Minority interests in operations of consolidated subsidiaries | (693 | ) | (1,551 | ) | (5,921 | ) | ||||||
| Income (loss) before income taxes and cumulative effect of accounting change | (81,825 | ) | 178,225 | 384,903 | ||||||||
| Provision for income taxes | 10,963 | 71,290 | 147,024 | |||||||||
| Net income (loss) before cumulative effect of accounting change | (92,788 | ) | 106,935 | 237,879 | ||||||||
| Cumulative effect of accounting change | | (64,120 | ) | | ||||||||
Net income (loss) |
$ |
(92,788 |
) |
$ |
42,815 |
$ |
237,879 |
|||||
Net income (loss) per share basic: |
||||||||||||
| Net income (loss) per share before cumulative effect of accounting change | $ | (0.16 | ) | $ | 0.18 | $ | 0.39 | |||||
| Cumulative effect of accounting change per share | | (0.11 | ) | | ||||||||
|
Net income (loss) per share basic |
$ |
(0.16 |
) |
$ |
0.07 |
$ |
0.39 |
|||||
| Net income (loss) per share diluted: | ||||||||||||
| Net income (loss) per share before cumulative effect of accounting change | $ | (0.16 | ) | $ | 0.18 | $ | 0.37 | |||||
| Cumulative effect of accounting change per share | | (0.11 | ) | | ||||||||
| Net income (loss) per share diluted | $ | (0.16 | ) | $ | 0.07 | $ | 0.37 | |||||
| Shares used in per share calculation basic | 569,724 | 593,838 | 616,740 | |||||||||
| Shares used in per share calculation diluted | 569,724 | 610,060 | 642,081 | |||||||||
| (1)Stock compensation expense by function: | ||||||||||||
| Sales and marketing | $ | 3,090 | $ | 1,424 | $ | 5,785 | ||||||
| Product development | 4,615 | 1,702 | 10,526 | |||||||||
| General and administrative | 1,391 | 5,276 | 5,718 | |||||||||
| Total stock compensation expense | $ | 9,096 | $ | 8,402 | $ | 22,029 | ||||||
The accompanying notes are an integral part of these consolidated financial statements.
46
Consolidated Balance Sheets YAHOO! INC.
(in thousands, except par value)
|
|
December 31, |
||||||||
|---|---|---|---|---|---|---|---|---|---|
|
|
2002 |
2003 |
|||||||
|
|
|||||||||
| ASSETS | |||||||||
| Current assets: | |||||||||
| Cash and cash equivalents | $ | 310,972 | $ | 713,539 | |||||
| Short-term investments in marketable securities | 463,204 | 595,978 | |||||||
| Accounts receivable, net of allowance of $23,852 and $31,961, respectively | 113,612 | 282,415 | |||||||
| Prepaid expenses and other current assets | 82,216 | 129,777 | |||||||
| Total current assets | 970,004 | 1,721,709 | |||||||
Long-term investments in marketable securities |
763,408 |
1,261,693 |
|||||||
| Property and equipment, net | 371,272 | 449,512 | |||||||
| Goodwill | 415,225 | 1,805,561 | |||||||
| Intangible assets, net | 96,252 | 445,640 | |||||||
| Other assets | 174,020 | 247,539 | |||||||
| Total assets | $ | 2,790,181 | $ | 5,931,654 | |||||
|
LIABILITIES AND STOCKHOLDERS' EQUITY |
|||||||||
| Current liabilities: | |||||||||
| Accounts payable | $ | 18,738 | $ | 31,890 | |||||
| Accrued expenses and other current liabilities | 257,575 | 483,628 | |||||||
| Deferred revenue | 135,501 | 192,278 | |||||||
| Total current liabilities | 411,814 | 707,796 | |||||||
Long-term debt |
|
750,000 |
|||||||
| Other liabilities | 84,540 | 72,890 | |||||||
| Commitments and contingencies (Note 14) | |||||||||
| Minority interests in consolidated subsidiaries | 31,557 | 37,478 | |||||||
| Stockholders' equity: | |||||||||
| Preferred Stock, $0.001 par value; 10,000 shares authorized; none issued or outstanding | | | |||||||
| Common Stock, $0.001 par value; 5,000,000 shares authorized; 594,860 and 660,704 issued and outstanding, respectively | 611 | 678 | |||||||
| Additional paid-in capital | 2,430,222 | 4,288,816 | |||||||
| Treasury stock | (159,988 | ) | (159,988 | ) | |||||
| Retained earnings (accumulated deficit) | (7,493 | ) | 230,386 | ||||||
| Accumulated other comprehensive income (loss) | (1,082 | ) | 3,598 | ||||||
| Total stockholders' equity | 2,262,270 | 4,363,490 | |||||||
| Total liabilities and stockholders' equity | $ | 2,790,181 | $ | 5,931,654 | |||||
The accompanying notes are an integral part of these consolidated financial statements.
47
Consolidated Statements of Cash Flows YAHOO! INC.
(in thousands)
|
|
Years Ended December 31, |
||||||||||||
|---|---|---|---|---|---|---|---|---|---|---|---|---|---|
|
|
2001 |
2002 |
2003 |
||||||||||
|
|
|||||||||||||
| CASH FLOWS FROM OPERATING ACTIVITIES: | |||||||||||||
| Net income (loss) | $ | (92,788 | ) | $ | 42,815 | $ | 237,879 | ||||||
| Adjustments to reconcile net income (loss) to net cash provided by operating activities: | |||||||||||||
| Depreciation and amortization | 130,575 | 109,389 | 159,688 | ||||||||||
| Tax benefits from stock options | 2,003 | 60,406 | 124,852 | ||||||||||
| Cumulative effect of accounting change | | 64,120 | | ||||||||||
| Earnings in equity interests | (4,356 | ) | (22,301 | ) | (47,652 | ) | |||||||
| Noncash (gains) losses and impairments from investments | 30,430 | (2,422 | ) | 6,140 | |||||||||
| Minority interests in operations of consolidated subsidiaries | 693 | 1,551 | 5,921 | ||||||||||
| Noncash restructuring costs | 14,791 | | | ||||||||||
| Stock compensation expense | 9,096 | 8,402 | 22,029 | ||||||||||
| Other non-cash charges | 1,993 | 2,313 | 4,907 | ||||||||||
| Changes in assets and liabilities, net of effects of acquisitions: | |||||||||||||
| Accounts receivable, net | 27,628 | (30,798 | ) | (122,220 | ) | ||||||||
| Prepaid expenses and other assets | (9,003 | ) | 29,555 | 16,835 | |||||||||
| Accounts payable | (27,202 | ) | 4,507 | (12,889 | ) | ||||||||
| Accrued expenses and other liabilities | 31,571 | (9,904 | ) | (640 | ) | ||||||||
| Current deferred revenue | (8,581 | ) | 14,815 | 33,294 | |||||||||
| Long-term deferred revenue | | 30,000 | | ||||||||||
| Net cash provided by operating activities | 106,850 | 302,448 | 428,144 | ||||||||||
| CASH FLOWS FROM INVESTING ACTIVITIES: | |||||||||||||
| Acquisition of property and equipment | (86,211 | ) | (51,553 | ) | (117,329 | ) | |||||||
| Purchases of marketable securities | (1,200,623 | ) | (1,165,711 | ) | (1,916,800 | ) | |||||||
| Proceeds from sales and maturities of marketable securities | 1,329,076 | 1,067,540 | 1,289,202 | ||||||||||
| Increase in restricted cash and investments, net | (228,662 | ) | | | |||||||||
| Acquisitions, net of cash acquired | (19,188 | ) | (189,168 | ) | (376,236 | ) | |||||||
| Purchases of other investments | (13,075 | ) | (7,649 | ) | (3,747 | ) | |||||||
| Proceeds from the sales of other investments | 11,510 | 687 | 3,321 | ||||||||||
| Net cash used in investing activities | (207,173 | ) | (345,854 | ) | (1,121,589 | ) | |||||||
| CASH FLOWS FROM FINANCING ACTIVITIES: | |||||||||||||
| Proceeds from issuance of debt, net | | | 733,125 | ||||||||||
| Proceeds from issuance of common stock, net | 83,875 | 78,190 | 353,201 | ||||||||||
| Repurchase of common stock | (59,988 | ) | (100,000 | ) | | ||||||||
| Other | (5,597 | ) | | | |||||||||
| Net cash provided by (used in) financing activities | 18,290 | (21,810 | ) | 1,086,326 | |||||||||
| Effect of exchange rate changes on cash and cash equivalents | (2,212 | ) | 3,556 | 9,686 | |||||||||
| Net change in cash and cash equivalents | (84,245 | ) | (61,660 | ) | 402,567 | ||||||||
| Cash and cash equivalents at beginning of year | 456,877 | 372,632 | 310,972 | ||||||||||
| Cash and cash equivalents at end of year | $ | 372,632 | $ | 310,972 | $ | 713,539 | |||||||
48
Consolidated Statements of Cash Flows YAHOO! INC. (Continued)
(in thousands)
Supplemental schedule of investing activities:
During the year ended December 31, 2002, the Company acquired property and equipment for approximately $259 million, which was funded through restricted long-term investments. See Note 14 "Commitments and Contingencies" for further information.
Acquisition related activities (in thousands):
|
|
Years ended December 31, |
|||||||||
|---|---|---|---|---|---|---|---|---|---|---|
|
|
2001 |
2002 |
2003 |
|||||||
|
|
||||||||||
| Cash paid for acquisitions | $ | 29,660 | $ | 242,452 | $ | 581,519 | ||||
| Cash acquired in acquisitions | (10,472 | ) | (53,284 | ) | (205,283 | ) | ||||
| $ | 19,188 | $ | 189,168 | $ | 376,236 | |||||
| Common stock and common stock options issued in connection with acquisitions |
$ | 133,757 | $ | 225,528 | $ | 1,428,259 | ||||
During the years ended December 31, 2001, 2002 and 2003, the Company issued approximately 2 million, 12 million, and 40 million shares of common stock, respectively, in connection with acquisitions. See Note 6 "Acquisitions" for further information.
The accompanying notes are an integral part of these consolidated financial statements.
49
Consolidated Statements of Stockholders' Equity YAHOO! INC.
(in thousands)
|
|
Years Ended December 31, |
|||||||||||
|---|---|---|---|---|---|---|---|---|---|---|---|---|
|
|
2001 |
2002 |
2003 |
|||||||||
|
|
||||||||||||
| Common Stock | ||||||||||||
| Balance, beginning of year | $ | 562 | $ | 581 | $ | 611 | ||||||
| Common stock issued | 19 | 30 | 67 | |||||||||
| Balance, end of year | 581 | 611 | 678 | |||||||||
|
Additional paid-in capital |
||||||||||||
| Balance, beginning of year | 1,830,526 | 2,067,410 | 2,430,222 | |||||||||
| Common stock issued | 225,181 | 303,689 | 1,792,025 | |||||||||
| Stock compensation expense | 9,096 | 8,402 | 22,029 | |||||||||
| Tax benefits from stock options | 1,159 | 54,648 | 120,358 | |||||||||
| Deferred stock-based compensation | (2,491 | ) | (3,927 | ) | (72,311 | ) | ||||||
| Other | 3,939 | | (3,507 | ) | ||||||||
| Balance, end of year | 2,067,410 | 2,430,222 | 4,288,816 | |||||||||
|
Treasury stock |
||||||||||||
| Balance, beginning of year | | (59,988 | ) | (159,988 | ) | |||||||
| Repurchase of common stock | (59,988 | ) | (100,000 | ) | | |||||||
| Balance, end of year | (59,988 | ) | (159,988 | ) | (159,988 | ) | ||||||
|
Retained earnings (accumulated deficit) |
||||||||||||
| Balance, beginning of year | 42,480 | (50,308 | ) | (7,493 | ) | |||||||
| Net income (loss) | (92,788 | ) | 42,815 | 237,879 | ||||||||
| Balance, end of year | (50,308 | ) | (7,493 | ) | 230,386 | |||||||
|
Accumulated other comprehensive income (loss) |
||||||||||||
| Balance, beginning of year | 23,346 | 9,322 | (1,082 | ) | ||||||||
| Net unrealized losses on securities | (10,622 | ) | (8,636 | ) | (6,705 | ) | ||||||
| Foreign currency translation adjustment | (3,402 | ) | (1,768 | ) | 11,385 | |||||||
| Balance, end of year | 9,322 | (1,082 | ) | 3,598 | ||||||||
| Total stockholders' equity | $ | 1,967,017 | $ | 2,262,270 | $ | 4,363,490 | ||||||
|
Other comprehensive income (loss) |
||||||||||||
| Net income (loss) | $ | (92,788 | ) | $ | 42,815 | $ | 237,879 | |||||
| Other comprehensive income (loss): | ||||||||||||
| Net unrealized losses on securities | (10,622 | ) | (8,636 | ) | (6,705 | ) | ||||||
| Foreign currency translation adjustment | (3,402 | ) | (1,768 | ) | 11,385 | |||||||
| Comprehensive income (loss) | $ | (106,812 | ) | $ | 32,411 | $ | 242,559 | |||||
|
|
Number of Shares |
|||||||||||
| Common Stock | ||||||||||||
| Balance, beginning of year | 561,651 | 575,520 | 594,860 | |||||||||
| Common stock issued | 19,253 | 30,414 | 65,844 | |||||||||
| Repurchase of common stock | (5,384 | ) | (11,074 | ) | | |||||||
| Balance, end of year | 575,520 | 594,860 | 660,704 | |||||||||
The accompanying notes are an integral part of these consolidated financial statements.
50
Notes to Consolidated Financial Statements YAHOO! INC.
Note 1 THE COMPANY AND SUMMARY OF SIGNIFICANT ACCOUNTING POLICIES
The Company. Yahoo! Inc. ("Yahoo!" or the "Company") is a leading provider of comprehensive online products and services to consumers and businesses worldwide. The Company, a Delaware corporation, commenced operations in 1995.
Principles of Consolidation. The consolidated financial statements include the accounts of Yahoo! and its majority-owned subsidiaries. All significant intercompany accounts and transactions have been eliminated. Investments in entities in which the Company can exercise significant influence, but are less than majority owned and not otherwise controlled by the Company, are accounted for under the equity method and are included in other assets on the balance sheet. The Company has included the results of operations of acquired companies from the date of acquisition. See Note 6 "Acquisitions."
Reclassifications. Certain prior year balances have been reclassified to conform to the current year presentation.
Revenue Recognition. The Company's revenues are derived principally from services, which include marketing services, fees, and listings.
The Company recognizes revenue on arrangements in accordance with Securities and Exchange Commission Staff Accounting Bulletin No. 104 "Revenue Recognition," ("SAB 104") and Emerging Issues Task Force ("EITF") Issue 00-21, "Revenue Arrangements with Multiple Deliverables." In all cases, revenue is recognized only when the price is fixed or determinable, persuasive evidence of an arrangement exists, the service is performed, and collectibility of the resulting receivable is reasonably assured.
Marketing services revenue is primarily generated from the sale of rich media advertisements (banner and other media advertisements), sponsorship and text-link advertisements, (including pay-for-performance search advertisements), paid inclusion, algorithmic searches and transactions revenue. Banner advertising agreements typically range from one week to three years. The Company recognizes marketing services revenue related to banner advertisements as "impressions" are delivered by the Company. "Impressions" are defined as the number of times that an advertisement appears in pages viewed by users of the Yahoo! network. Sponsorship advertising agreements have longer terms than banner advertising agreements, typically ranging from three months to three years, and often involve multiple element arrangements (arrangements with more than one deliverable) that may include placement on specific properties, exclusivity and content integration. Sponsorship advertisement revenue is recognized as "impressions" are delivered or ratably over the contract period, where applicable. Text-link and hypertext link advertisements, including pay-for-performance search advertisements or results, are recognized in the period in which the "click-throughs" occur. "Click-throughs" are defined as the number of times a user clicks on an advertisement or search result. Per-query search fees are recognized based on the query volume in the period, and revenue from customers who pay a fixed fee to be included in the Web search index are recognized over the term of the agreement. Transactions revenue includes service fees for facilitating transactions through the Yahoo! network, principally from the Company's commerce properties. Transactions revenue is recognized when there is evidence that the qualifying transactions have occurred.
Revenues from pay-for-performance search and rich media advertisements from the Company's agreement with Overture Services, Inc. ("Overture") are included in marketing services for the period from January 1, 2003 through October 7, 2003, the date the Company acquired Overture, and for the years ended December 31, 2002 and 2001. Revenues from Overture for the period from January 1, 2003 through October 7, 2003 amounted to 12 percent of total revenues for the year ended December 31, 2003. The results of operations of Overture are included in the Company's consolidated statements of operations since the completion of the acquisition on October 7, 2003. Revenues from Overture amounted to 14 percent of total revenues for the year ended December 31, 2002. No one customer accounted for 10 percent or more of total revenues during 2001.
51
The Company has agreements with various affiliates, networks of Web properties that have integrated the Company's search service into their sites, to provide pay-for-performance search results. The Company pays affiliates based on click-throughs on these listings. In accordance with EITF Issue No. 99-19, "Reporting Revenue Gross as a Principal Versus Net as an Agent," the revenue derived from pay-for-performance search results related to traffic supplied by affiliates are reported gross of the payment to affiliates. This revenue is reported gross primarily due to the fact that the Company is the primary obligor to the customers of the pay-for-performance search services.
Periodically, the Company engages in barter transactions for marketing services. Barter revenue is recognized over the periods in which the Company completes its obligations under the arrangement. The Company recognizes revenue on barter arrangements in accordance with EITF Issue No. 99-17, "Accounting for Advertising Barter Transactions," which requires advertising barter transactions to be valued based on similar cash transactions that have occurred within six months prior to the barter transaction, and also Accounting Principles Board No. 29 ("APB 29") "Accounting for Nonmonetary Transactions," which requires nonmonetary transactions to be based on the fair values involved, similar to monetary transactions. Barter revenues represented 7 percent, 2 percent and 1 percent of total revenues for 2001, 2002 and 2003, respectively. During 2001, 2002 and 2003, the Company delivered approximately 1.6 billion, 3.5 billion, and 4.3 billion impressions, respectively, under advertising barter arrangements where fair value was not determinable under EITF 99-17 and, accordingly, revenue was not recognized.
Fees revenue consists of revenues generated from a variety of consumer and business fee-based services, including SBC Yahoo! DSL and Dial, Yahoo! Personals, Small Business Services, Yahoo! Mail and Yahoo! Enterprise Solutions, including Yahoo! Portal Solutions. With the exception of Yahoo! Portal Solutions, revenue is recognized in the month in which the services are performed, provided that no significant Company obligations remain and collection of the resulting receivable is reasonably assured. Revenue from Yahoo! Portal Solutions consists of software license and service revenues, which are principally platform and maintenance services. Yahoo! Portal Solutions revenue is recognized in accordance with Statement of Position No. 97-2, "Software Revenue Recognition" and Statement of Position 98-9, "Modification of SOP No. 97-2 with Respect to Certain Transactions." License revenue is recognized when persuasive evidence of an arrangement exists, delivery of the license has occurred, the fee is fixed or determinable, and collection is probable. License revenue from Portal Solutions was not material to the Company as it represented less than one percent of total revenue for all periods presented. Platform services are sold as a subscription and are recognized ratably over the subscription period. Platform services are priced based on the specific content or service purchased by the customer. These services are optional and renewable annually at fixed renewal rates. Maintenance is generally sold under annual contracts with fixed renewal rates. Maintenance revenue is recognized ratably over the contract period. Yahoo! Portal Solutions revenues have represented less than 10 percent of total revenues in all periods presented.
Listings revenue consists of revenues generated from a variety of consumer and business listings-based services, including access to the HotJobs database and classifieds such as Yahoo! Autos, Yahoo! Real Estate and other search services. Revenue is recognized in the month in which the services are performed, provided that no significant Company obligations remain and collection of the resulting receivable is reasonably assured.
Deferred revenue primarily comprises contractual billings in excess of recognized revenue and payments received in advance of revenue recognition.
Traffic Acquisition Costs. The Company enters into agreements of varying duration with affiliates that integrate the Company's pay-for-performance search service into their sites. There are generally three economic structures of the affiliate agreements: fixed payments based on a guaranteed minimum amount of traffic delivered, which often carry reciprocal performance guarantees from the affiliate, variable payments based on a percentage of the Company's revenue or based on a certain metric, such as number of searches or paid clicks, or a combination of the two.
The Company expenses, as cost of revenues, traffic acquisition costs under two methods; agreements with fixed payments are expensed pro-rata over the term the fixed payment covers, and agreements based on a percentage of revenue, number of paid introductions, number of
52
searches, or other metric are expensed based on the volume of the underlying activity or revenue multiplied by the agreed-upon price or rate.
Cash and Cash Equivalents, Short and Long-Term Investments. The Company invests its excess cash in debt instruments of the U.S. Government and its agencies, and in high-quality corporate issuers. All highly liquid investments with an original maturity of three months or less are considered cash equivalents. Investments with maturities of less than twelve months from the balance sheet date are considered short-term investments. Investments with maturities greater than twelve months from the balance sheet date are considered long-term investments.
The Company's marketable securities are classified as available-for-sale and are reported at fair value, with unrealized gains and losses, net of tax, recorded in other comprehensive income (loss). Realized gains or losses and declines in value judged to be other than temporary, if any, on available-for-sale securities are reported in other income, net. The Company reviews the securities for impairments considering current factors including the economic environment, market conditions and the operational performance and other specific factors relating to the business underlying the securities. The Company records impairment charges equal to the amount that the carrying value of its available-for-sale securities exceeds the estimated fair market value of the securities as of the evaluation date. The fair value for publicly held securities is determined based on quoted market prices as of the evaluation date. In computing realized gains and losses on available-for-sale securities, the Company determines cost based on amounts paid, including direct costs such as commissions, to acquire the security using the specific identification method. The Company had net unrealized gains on its marketable debt and equity securities of approximately $32 million, $18 million and $8 million, net of tax of approximately $13 million, $7 million and $3 million, at December 31, 2001, 2002, and 2003, respectively. Realized gains on marketable debt and equity securities were not material to the consolidated statements of operations for the years ended December 31, 2001, 2002 and 2003.
The Company has investments in equity instruments of privately-held companies. These investments are included in other long-term assets and are generally accounted for under the cost method, as the Company does not have the ability to exercise significant influence over operations. The Company monitors its investments for impairment by considering current factors including economic environment, market conditions and operational performance and other specific factors relating to the business underlying the investment, and records reductions in carrying values when necessary. The fair value for privately held securities is estimated using the best available information as of the evaluation date, including the quoted market prices of comparable public companies, recent financing rounds of the investee and other investee specific information, in accordance with Accounting Principles Board Opinion No. 18, "The Equity Method of Accounting for Investments in Common Stock."
The Company accounts for derivatives under Statement of Financial Accounting Standards No. 133 ("SFAS 133"), "Accounting for Derivative Instruments and Hedging Activities." SFAS 133 establishes methods of accounting for derivative financial instruments and hedging activities related to those instruments as well as other hedging activities. The derivatives held by the Company comprise warrants to purchase equity instruments in other public and private companies at specified prices over original terms varying from 2.5 to 10 years. These warrants are held for business and strategic purposes. During 2001, 2002 and 2003, the realized and unrealized gains on derivatives recorded in other income, net were not material to the consolidated results of operations.
Concentration of Risk. Financial instruments that potentially subject the Company to significant concentration of credit risk consist primarily of cash, cash equivalents, investments, and accounts receivable. As of December 31, 2003, substantially all of the Company's cash, cash equivalents, and investments were managed by four financial institutions. Accounts receivable are typically unsecured and are derived from revenue earned from customers primarily located in the United States. The Company performs ongoing credit evaluations of its customers and maintains allowances for potential credit losses. Historically, such losses have been within management's expectations. As of December 31, 2002 and 2003, no one customer accounted for 10 percent or more of the accounts receivable balance.
Product Development. Product development costs consist primarily of payroll and related expenses incurred for enhancements to and maintenance of the Company's network, classification and organization of listings within Yahoo! properties, research and development expenses,
53
amortization of capitalized Website development costs, and other operating costs.
Internal Use Software and Website Development Costs. The Company has capitalized certain internal use software and Website development costs totaling $11 million and $11 million during 2002 and 2003, respectively. The estimated useful life of costs capitalized is evaluated for each specific project and ranges from one to three years. During 2001, 2002 and 2003, the amortization of capitalized costs totaled approximately $5 million, $9 million and $9 million, respectively. Capitalized internal use software and Website development costs are included in property and equipment, net.
Advertising Costs. Advertising production costs are recorded as expense the first time an advertisement appears. All other advertising costs are expensed as incurred. Advertising expense, including barter advertising, totaled approximately $113 million, $94 million, and $115 million for 2001, 2002, and 2003, respectively.
Benefit Plan. The Company maintains a 401(k) Profit Sharing Plan (the "401(k) Plan") for its full-time employees. The 401(k) Plan allows employees of the Company to contribute up to the Internal Revenue Code prescribed maximum amount. Each participant in the 401(k) Plan may elect to contribute from one percent to 17 percent of his or her annual compensation to the 401(k) Plan. The Company matches employee contributions at a rate of 25 percent. Employee contributions are fully vested, whereas vesting in matching Company contributions occurs at a rate of 33 percent per year of employment. During 2001, 2002, and 2003, the Company's contributions amounted to approximately $3 million, $3 million, and $5 million, respectively.
Depreciation and Amortization. Buildings are stated at cost and depreciated using the straight-line method over the estimated useful lives of 25 years. Leasehold improvements, computers and equipment, and furniture and fixtures are stated at cost and depreciated using the straight-line method over the estimated useful lives of the assets, generally two to five years.
Goodwill and other intangible assets are carried at cost less accumulated amortization. Intangible assets are generally amortized on a straight-line basis over the economic lives of the respective assets, generally three to seven years. Effective January 1, 2002, the Company adopted Statement of Financial Accounting Standards No. 142 ("SFAS 142"), "Goodwill and Other Intangible Assets." In accordance with SFAS 142, the Company ceased amortizing goodwill and performed a transitional test of its goodwill as of January 1, 2002. See Note 4 "Goodwill." SFAS 142 requires that goodwill be tested for impairment at the reporting unit level (operating segment or one level below an operating segment) on an annual basis and between annual tests in certain circumstances. The performance of the test involves a two-step process. The first step of the impairment test involves comparing the fair value of the Company's reporting units with the reporting unit's carrying amount, including goodwill. The Company generally determines the fair value of its reporting units using the expected present value of future cash flows, giving consideration to the market comparable approach. If the carrying amount of the Company's reporting units exceeds the reporting unit's fair value, the Company performs the second step of the goodwill impairment test to determine the amount of impairment loss. The second step of the goodwill impairment test involves comparing the implied fair value of the Company's reporting unit's goodwill with the carrying amount of that goodwill.
Long-Lived Assets. Long-lived assets and certain identifiable intangible assets to be held and used are reviewed for impairment whenever events or changes in circumstances indicate that the carrying amount of such assets may not be recoverable. Determination of recoverability is based on an estimate of undiscounted future cash flows resulting from the use of the asset and its eventual disposition. Measurement of any impairment loss for long-lived assets and certain identifiable intangible assets that management expects to hold and use is based on the amount the carrying value exceeds the fair value of the asset.
54
Other Income, net. Other income, net was as follows (in thousands):
|
|
Years Ended December 31, |
|||||||||
|---|---|---|---|---|---|---|---|---|---|---|
|
|
2001 |
2002 |
2003 |
|||||||
|
|
||||||||||
| Interest and investment income | $ | 91,931 | $ | 63,200 | $ | 47,202 | ||||
| Investment gains (losses), net | (26,623 | ) | 2,189 | (1,223 | ) | |||||
| Contract termination fees | 9,000 | 1,661 | 750 | |||||||
| Other | (1,526 | ) | 2,237 | 777 | ||||||
| Total other income, net | $ | 72,782 | $ | 69,287 | $ | 47,506 | ||||
Investment gains (losses), net include realized investment gains, realized investment losses, realized and unrealized gains on derivatives and impairment charges related to declines in values of publicly traded securities and securities of privately held companies judged to be other than temporary.
Investment losses in 2001 were approximately $27 million, of which approximately $13 million related to investment impairments on publicly traded securities and $25 million related to investment impairments on privately held securities, offset by a gain of $5 million related to the sale of certain equity investments and approximately $5 million of gains on derivatives related to equity instruments of other companies. Investment gains were approximately $9 million in 2002, offset by impairment charges on privately held securities of $6 million. Investment losses in 2003 included approximately $8 million related to investment impairments on privately held securities, offset by gains of approximately $7 million related to the sale of certain equity investments.
Income Taxes. Deferred income taxes are determined based on the differences between the financial reporting and tax basis of assets and liabilities and are measured using the currently enacted tax rates and laws. The provision for income taxes comprises the Company's current tax liability and change in deferred tax assets and liabilities. A valuation allowance is provided for the amount of deferred tax assets that, based on available evidence, are not expected to be realized.
Foreign Currency. The functional currency of the Company's international subsidiaries is the local currency. The financial statements of these subsidiaries are translated to United States dollars using period-end rates of exchange for assets and liabilities, and average rates of exchange for the year for revenues and expenses. Translation gains (losses) are recorded in accumulated other comprehensive income (loss) as a component of stockholders' equity. Net gains and losses resulting from foreign exchange transactions are included in other income, net and were not significant during the periods presented.
Basic and Diluted Net Income (Loss) per Share. Basic net income (loss) per share is computed using the weighted average number of common shares outstanding during the period. Diluted net income (loss) per share is computed using the weighted average number of common and, if dilutive, potential common shares outstanding during the period. Potential common shares consist of the incremental common shares issuable upon the exercise of stock options and warrants (using the treasury stock method). For 2001, potential common shares of approximately 27 million shares were not included in the computation because they were antidilutive. For 2002 and 2003, potential common shares of 16 million and 25 million, respectively, were included in the computation and were related to shares issuable upon the exercise of stock options. For the year ended December 31, 2003, approximately 18 million common shares issuable under the terms of the zero coupon senior convertible notes that the Company issued in April 2003 have not been included in potential common shares as the conversion of the notes is subject to certain contingencies that were not met as of December 31, 2003. See Note 10 "Long-Term Debt" for additional information related to the zero coupon senior convertible notes.
Stock-Based Compensation. The Company measures compensation expense for its stock-based employee compensation plans using the intrinsic value method. If the fair value based method had been applied in measuring stock compensation expense, the pro forma effect on net income
55
(loss) and net income (loss) per share would have been as follows (in thousands, except per share amounts):
|
|
Years Ended December 31, |
||||||||||
|---|---|---|---|---|---|---|---|---|---|---|---|
|
|
2001 |
2002 |
2003 |
||||||||
|
|
|||||||||||
| Net income (loss): | |||||||||||
| As reported | $ | (92,788 | ) | $ | 42,815 | $ | 237,879 | ||||
| Add: Stock compensation expense included in reported net income (loss), net of related tax effects | 9,096 | 5,041 | 12,987 | ||||||||
| Less: Stock compensation expense determined under fair value based method for all awards, net of related tax effects | (899,503 | ) | (487,959 | ) | (216,025 | ) | |||||
| Pro forma net income (loss) | $ | (983,195 | ) | $ | (440,103 | ) | $ | 34,841 | |||
| Net income (loss) per share: | |||||||||||
| As reported basic | $ | (0.16 | ) | $ | 0.07 | $ | 0.39 | ||||
| Pro forma basic | $ | (1.73 | ) | $ | (0.74 | ) | $ | 0.06 | |||
|
As reported diluted |
$ |
(0.16 |
) |
$ |
0.07 |
$ |
0.37 |
||||
| Pro forma diluted | $ | (1.73 | ) | $ | (0.74 | ) | $ | 0.05 | |||
Diluted and pro forma diluted net loss per share for the year ended December 31, 2001 is computed excluding potential common shares of 27 million shares, as their effect is anti-dilutive. Pro forma diluted net loss per share for the year ended December 31, 2002 is computed excluding potential common shares of 16 million shares, as their effect is anti-dilutive.
See Note 11 "Stockholders' Equity" for the assumptions and methodology used to determine the fair value of stock-based compensation.
Use of Estimates. The preparation of consolidated financial statements in conformity with generally accepted accounting principles requires management to make estimates and assumptions that affect the reported amounts of assets and liabilities, disclosure of contingent assets and liabilities at the date of the financial statements, and the reported amounts of revenues and expenses during the reported period. On an on-going basis, the Company evaluates its estimates, including those related to uncollectible receivables, investment values, goodwill and intangible assets, income taxes, restructuring costs and contingencies. The Company bases its estimates on historical experience and on various other assumptions that are believed to be reasonable under the circumstances, the results of which form the basis for making judgments about the carrying values of assets and liabilities that are not readily apparent from other sources. Actual results may differ from these estimates under different assumptions or conditions.
Comprehensive Income (Loss). Comprehensive income (loss) as defined, includes all changes in equity (net assets) during a period from non-owner sources. Accumulated other comprehensive income (loss), as presented on the accompanying consolidated balance sheets, consists of the net unrealized gains and losses on available-for-sale securities, net of tax, and the cumulative foreign currency translation adjustment.
Recent Accounting Pronouncements
In January 2003, the Financial Accounting Standards Board ("FASB") issued Interpretation No. 46 ("FIN 46") "Consolidation of Variable Interest Entities." Until this interpretation, a company generally included another entity in its consolidated financial statements only if it controlled the entity through voting interests. FIN 46 requires a variable interest entity, as defined, to be consolidated by a company if that company is subject to a majority of the risk of loss from the variable interest entity's activities or entitled to receive a majority of the entity's residual returns. Certain provisions of FIN 46 were deferred until the period ending after March 15, 2004. The adoption of FIN 46 for provisions effective during 2003 did not have a material impact on the Company's financial position, cash flows or results of operations.
In April 2003, the FASB issued SFAS 149, "Amendment of Statement 133 on Derivative Instruments and Hedging Activities" ("SFAS 149"), which amends SFAS 133 for certain decisions made by the FASB Derivatives Implementation Group. In particular, SFAS 149: (1) clarifies under what circumstances a contract with an initial net investment meets the characteristic of a derivative, (2) clarifies when a derivative contains a financing component, (3) amends the definition of an underlying to conform it to language used in FASB Interpretation No. 45
56
"Guarantor's Accounting and Disclosure Requirements for Guarantees, Including Indirect Guarantees of Indebtedness of Others," and (4) amends certain other existing pronouncements. This Statement is effective for contracts entered into or modified after June 30, 2003, and for hedging relationships designated after June 30, 2003. In addition, most provisions of SFAS 149 are to be applied prospectively. The adoption of SFAS 149 did not have a material impact on the Company's financial position, cash flows or results of operations.
In May 2003, the FASB issued SFAS No. 150, "Accounting for Certain Financial Instruments with Characteristics of Both Liabilities and Equity" ("SFAS 150"). SFAS 150 changes the accounting for certain financial instruments that under previous guidance issuers could account for as equity. It requires that those instruments be classified as liabilities in balance sheets. The guidance in SFAS 150 is generally effective for all financial instruments entered into or modified after May 31, 2003, and otherwise is effective on July 1, 2003. The adoption of SFAS 150 did not have a material impact on the Company's financial position, cash flows or results of operations.
Note 2 BALANCE SHEET COMPONENTS
The following table summarizes the balance sheet components (in thousands):
|
|
December 31, |
||||||||
|---|---|---|---|---|---|---|---|---|---|
|
|
2002 |
2003 |
|||||||
|
|
|||||||||
| Property and equipment, net: | |||||||||
| Land | $ | 51,561 | $ | 51,061 | |||||
| Buildings | 191,183 | 191,183 | |||||||
| Leasehold improvements | 42,607 | 52,833 | |||||||
| Computers and equipment | 245,742 | 416,266 | |||||||
| Furniture and fixtures | 45,645 | 50,973 | |||||||
| 576,738 | 762,316 | ||||||||
| Less: accumulated depreciation | (205,466 | ) | (312,804 | ) | |||||
| Total property and equipment, net | $ | 371,272 | $ | 449,512 | |||||
| Other assets: | |||||||||
| Investment in Yahoo! Japan (Note 8) | $ | 103,331 | $ | 152,831 | |||||
| Investments in privately-held companies | 47,468 | 38,105 | |||||||
| Other | 23,221 | 56,603 | |||||||
| Total other assets | $ | 174,020 | $ | 247,539 | |||||
| Accrued expenses and other current liabilities: | |||||||||
| Accrued compensation and related expenses | $ | 76,379 | $ | 128,339 | |||||
| Accrued content, connect, traffic acquisition and other costs | 39,478 | 138,550 | |||||||
| Accrued sales and marketing related expenses | 46,424 | 48,418 | |||||||
| Accrued professional service expenses | 20,628 | 24,391 | |||||||
| Accrued restructuring costs | 11,745 | 7,459 | |||||||
| Accrued acquisition-related costs | 5,909 | 38,967 | |||||||
| Accrued taxes payable | 17,901 | 32,725 | |||||||
| Other | 39,111 | 64,779 | |||||||
| Total accrued expenses and other current liabilities | $ | 257,575 | $ | 483,628 | |||||
| Other liabilities: | |||||||||
| Deferred tax liabilities (Note 13) | $ | 54,540 | $ | 72,374 | |||||
| Long-term deferred revenue | 30,000 | | |||||||
| Other | | 516 | |||||||
| Total other liabilities | $ | 84,540 | $ | 72,890 | |||||
As of December 31, 2002, long-term deferred revenue of $30 million represented cash payments received in advance of revenue recognized related to the Company's agreement with Overture, its pay-for-performance search provider, which was acquired in 2003. The amount was eliminated in consolidation at acquisition date. See Note 6 "Acquisitions."
57
Note 3 INVESTMENTS
The following tables summarize the Company's investments in available-for-sale securities (in thousands):
|
|
December 31, 2002 |
|||||||||||
|---|---|---|---|---|---|---|---|---|---|---|---|---|
|
|
Gross Amortized Costs |
Gross Unrealized Gains |
Gross Unrealized Losses |
Estimated Fair Value |
||||||||
|
|
||||||||||||
| U.S. Government and agencies | $ | 329,486 | $ | 2,025 | $ | (22 | ) | $ | 331,489 | |||
| Municipal bonds | 45,945 | | | 45,945 | ||||||||
| Corporate debt securities | 829,093 | 17,018 | (479 | ) | 845,632 | |||||||
| Corporate equity securities | 4,211 | 639 | (1,304 | ) | 3,546 | |||||||
| Total investments in available-for-sale securities | $ | 1,208,735 | $ | 19,682 | $ | (1,805 | ) | $ | 1,226,612 | |||
|
|
December 31, 2003 |
|||||||||||
|---|---|---|---|---|---|---|---|---|---|---|---|---|
|
|
Gross Amortized Costs |
Gross Unrealized Gains |
Gross Unrealized Losses |
Estimated Fair Value |
||||||||
|
|
||||||||||||
| U.S. Government and agencies | $ | 720,933 | $ | 1,044 | $ | (2,526 | ) | $ | 719,451 | |||
| Municipal bonds | 169,815 | | (5 | ) | 169,810 | |||||||
| Corporate debt securities | 955,418 | 10,229 | (2,232 | ) | 963,415 | |||||||
| Corporate equity securities | 4,053 | 942 | | 4,995 | ||||||||
| Total investments in available-for-sale securities | $ | 1,850,219 | $ | 12,215 | $ | (4,763 | ) | $ | 1,857,671 | |||
The contractual maturities of available-for-sale debt securities are as follows (in thousands):
|
|
December 31, |
|||||
|---|---|---|---|---|---|---|
|
|
2002 |
2003 |
||||
|
|
||||||
| Due within one year | $ | 463,204 | $ | 595,978 | ||
| Due after one year through five years | 759,862 | 1,256,698 | ||||
| Total available-for-sale debt securities | $ | 1,223,066 | $ | 1,852,676 | ||
Note 4 GOODWILL
The changes in the carrying amount of goodwill for the years ended December 31, 2002 and 2003 are as follows (in thousands):
|
|
United States |
International |
Total |
|||||||
|---|---|---|---|---|---|---|---|---|---|---|
|
|
||||||||||
| Balance as of January 1, 2002 | $ | 47,590 | $ | 145,397 | $ | 192,987 | ||||
| Acquisitions and other (1) | 279,492 | 6,866 | 286,358 | |||||||
| Cumulative effect of accounting change | | (64,120 | ) | (64,120 | ) | |||||
| Balance as of December 31, 2002 | 327,082 | 88,143 | 415,225 | |||||||
| Acquisitions and other(1) | 1,383,916 | 6,420 | 1,390,336 | |||||||
| Balance as of December 31, 2003 | $ | 1,710,998 | $ | 94,563 | $ | 1,805,561 | ||||
The Company performed a transitional impairment test of its goodwill and intangible assets as of January 1, 2002. Due to, among other things, the overall softening of the global economy and the related decline in international advertising, the Company recorded a transitional goodwill impairment loss of approximately $64 million, which was recorded during the first quarter of 2002 as a cumulative effect of an accounting change in the Company's Consolidated Statements of Operations. The fair value of the reporting unit giving rise to the transitional impairment loss was estimated using the expected present value of future cash flows and market valuation approach.
Due to the adoption of SFAS 142 on January 1, 2002, the Company ceased amortizing goodwill. Had SFAS 142 been in effect during the year ended December 31, 2001 the Company would not have recorded goodwill amortization expense of approximately $56 million. The following table summarizes net income (loss) adjusted to exclude goodwill amortization expense, and the related tax effect,
58
that is no longer subject to amortization (in thousands, except per share amounts):
|
|
Years Ended December 31, |
|||||||||
|---|---|---|---|---|---|---|---|---|---|---|
|
|
2001 |
2002 |
2003 |
|||||||
|
|
||||||||||
| Reported net income (loss) | $ | (92,788 | ) | $ | 42,815 | $ | 237,879 | |||
| Goodwill amortization, net of tax | 55,850 | | | |||||||
| Adjusted net income (loss) | $ | (36,938 | ) | $ | 42,815 | $ | 237,879 | |||
Net income (loss) per share: |
||||||||||
| Basic as reported | $ | (0.16 | ) | $ | 0.07 | $ | 0.39 | |||
| Basic adjusted | $ | (0.06 | ) | $ | 0.07 | $ | 0.39 | |||
| Diluted as reported | $ | (0.16 | ) | $ | 0.07 | $ | 0.37 | |||
| Diluted adjusted | $ | (0.06 | ) | $ | 0.07 | $ | 0.37 | |||
The Company performed its annual assessment of goodwill in 2002 and 2003, and concluded that there were no additional impairments.
Note 5 INTANGIBLE ASSETS, NET
The following table summarizes the Company's intangible assets, net (in thousands):
|
|
December 31, 2002 |
|||||||||
|---|---|---|---|---|---|---|---|---|---|---|
|
|
Gross carrying amount |
Accumulated amortization |
Net |
|||||||
|
|
||||||||||
| Trademark, trade name and domain name | $ | 57,100 | $ | (8,206 | ) | $ | 48,894 | |||
| Customer, affiliate, and advertiser related relationships | 52,730 | (14,125 | ) | 38,605 | ||||||
| Developed technology and patents | 8,700 | (1,539 | ) | 7,161 | ||||||
| Content and other | 4,950 | (3,358 | ) | 1,592 | ||||||
| Total intangible assets, net | $ | 123,480 | $ | (27,228 | ) | $ | 96,252 | |||
|
|
December 31, 2003 |
||||||||
|---|---|---|---|---|---|---|---|---|---|
|
|
Gross carrying amount |
Accumulated amortization |
Net |
||||||
|
|
|||||||||
| Trademark, trade name and domain name | $ | 74,400 | $ | (17,570 | ) | $ | 56,830 | ||
| Customer, affiliate, and advertiser related relationships | 276,855 | (43,465 | ) | 233,390 | |||||
| Developed technology and patents | 168,900 | (13,480 | ) | 155,420 | |||||
| Total intangible assets, net | $ | 520,155 | $ | (74,515 | ) | $ | 445,640 | ||
The intangible assets are all amortizable and have original estimated useful lives as follows: Trademark, trade name and domain name four to seven years; Customer, affiliate, and advertiser related relationships two to seven years; Developed technology and patents three to five years; Content and other two to three years. The Company recognized amortization expense on intangible assets of approximately $64 million, $21 million and $54 million for the years ended December 31, 2001, 2002, and 2003, respectively. Based on the current amount of intangibles subject to amortization, the estimated amortization expense for each of the succeeding five years is as follows: 2004: $116 million; 2005: $111 million; 2006: $104 million; 2007: $75 million, and 2008: $37 million.
59
Note 6 ACQUISITIONS
The following table summarizes the acquisitions completed during 2001, 2002 and 2003 that were accounted for under the purchase method of accounting (in millions):
|
|
Purchase Price |
Goodwill |
Other Intangibles |
|||||||
|---|---|---|---|---|---|---|---|---|---|---|
|
|
||||||||||
| 2001 | ||||||||||
| Kimo.com | $ | 157 | $ | 135 | $ | 19 | ||||
| Other acquisitions | $ | 32 | $ | 30 | $ | 9 | ||||
| 2002 | ||||||||||
| Hotjobs | $ | 439 | $ | 282 | $ | 99 | ||||
| Other acquisitions | $ | 13 | $ | 7 | $ | 1 | ||||
| 2003 | ||||||||||
| Inktomi | $ | 290 | $ | 217 | $ | 49 | ||||
| Overture | $ | 1,733 | $ | 1,167 | $ | 354 | ||||
Kimo.com. In January 2001, the Company completed the acquisition of Kimo.com, a Taiwanese Internet communications and media company, through the issuance of approximately 2 million shares of Yahoo! Common Stock for a total purchase price of $157 million. The purchase price was allocated to the assets acquired, principally goodwill and other intangibles of $154 million, which are being amortized on a straight-line basis between two and four years, and liabilities assumed based on their estimated fair values at the date of acquisition. The amortization of goodwill ceased upon the adoption of SFAS 142.
HotJobs. In February 2002, the Company completed the acquisition of HotJobs, a recruiting solutions company, which became part of its listings properties and generates revenue primarily through listings and subscription fees for access to the HotJobs' database. Through this acquisition, the Company gained a meaningful presence in the online segment of the recruiting marketplace. This is consistent with the Company's strategy of building a diversified global business and providing solutions for consumers and business partners. These factors contributed to a purchase price in excess of fair market value of the HotJobs' net tangible and intangible assets acquired, and as a result, the Company has recorded goodwill in connection with the transaction.
The total purchase price of approximately $439 million consisted of $192 million in Yahoo! common stock, representing approximately 12 million shares, $206 million in cash consideration, $34 million related to approximately 4 million stock options exchanged and direct transaction costs of $7 million. The $206 million of total cash consideration less cash acquired of approximately $53 million resulted in a net cash outlay of approximately $153 million. The value of the common stock was determined based on the average market price of Yahoo! common stock over the 5-day period surrounding the date the terms of the exchange offer were finalized in February 2002. The value of the stock options was determined using the Black-Scholes option valuation model.
The allocation of the purchase price to the assets acquired and liabilities assumed based on the fair values was as follows (in thousands):
| Cash acquired | $ | 53,284 | |||
| Other tangible assets acquired | 48,359 | ||||
| Amortizable intangible assets | |||||
| Existing technology and patents | 53,300 | ||||
| Customer contracts and related relationships | 36,600 | ||||
| Trade name, trademark, and domain name | 8,700 | ||||
| Goodwill | 282,264 | ||||
| Total assets acquired | 482,507 | ||||
Liabilities assumed |
(47,343 |
) |
|||
| Deferred stock-based compensation | 3,928 | ||||
| Total | $ | 439,092 | |||
Amortizable intangible assets acquired have estimated useful lives as follows: Tradename, trademark and domain name seven years; Customer contracts five to seven years; Developed technology three to five years. Goodwill of $282 million represents the excess of the purchase price over the fair value of the net tangible and intangible assets acquired, and is not deductible for tax purposes.
Inktomi. On March 19, 2003, Yahoo! completed the acquisition of Inktomi, a provider of Web search and paid inclusion services on the Internet. The acquisition combined Yahoo!'s global audience and Inktomi's search technology to allow the Company to create a more relevant, comprehensive and higher quality search offering on the Web. These factors contributed to a purchase price in excess of the fair value of the Inktomi net tangible and intangible assets acquired, and as a result, the Company has recorded goodwill in connection with this transaction.
60
The total estimated purchase price of approximately $290 million consisted of approximately $273 million in cash consideration, approximately $14 million related to one million stock options exchanged, and direct transaction costs of approximately $3 million. The $273 million of total cash consideration less cash acquired of approximately $45 million resulted in a net cash outlay of approximately $228 million. The value of the stock options was determined using the Black-Scholes option valuation model.
The preliminary allocation of the purchase price to the assets acquired and liabilities assumed based on the estimated fair values was as follows (in thousands):
| Cash acquired | $ | 44,610 | |||
| Other tangible assets acquired | 27,537 | ||||
| Amortizable intangible assets | |||||
| Existing technology and patents | 25,900 | ||||
| Customer contracts and related relationships | 23,500 | ||||
| Goodwill | 217,119 | ||||
| Total assets acquired | 338,666 | ||||
Liabilities assumed |
(50,347 |
) |
|||
| Deferred stock-based compensation | 1,287 | ||||
| Total | $ | 289,606 | |||
Amortizable intangible assets consist of customer-related intangible assets and developed technology with useful lives not exceeding five years. A preliminary estimate of $217 million has been allocated to goodwill. Goodwill represents the excess of the purchase price over the fair value of the net tangible and intangible assets acquired, and is not deductible for tax purposes. Goodwill will not be amortized and will be tested for impairment, at least annually. The preliminary purchase price allocation for Inktomi is subject to revision as more detailed analysis is completed and additional information on the fair value of assets and liabilities becomes available. Any change in the fair value of the net assets of Inktomi will change the amount of the purchase price allocable to goodwill. Liabilities assumed included approximately $23 million of restructuring costs associated with the acquisition, approximately $6 million of which related to workforce reduction and the remainder related to excess facilities. As of December 31, 2003, approximately $17 million remains related to excess facilities. This amount includes estimated sub-lease income based on current comparable rates for leases in the respective markets. If facilities rental rates continue to decrease in these markets or if it takes longer than expected to sublease these facilities, the maximum amount the actual loss could exceed the original estimate is approximately $2 million.
Overture. On October 7, 2003, Yahoo! completed the acquisition of Overture, a provider of commercial search services on the Internet including pay-for-performance search services. Yahoo! believes that the combined assets will further position it as a leader in the Internet advertising sector. Together, the two companies will be able to provide a diversified suite of integrated marketing solutions, including branding, paid placement, graphical ads, text-links, multimedia, and contextual advertising. These factors contributed to a purchase price in excess of the fair market value of the net tangible and intangible assets acquired from Overture, and as a result, the Company has recorded goodwill in connection with this transaction.
Under the terms of the acquisition agreement, each outstanding share of Overture was exchanged for 0.6108 shares of Yahoo! common stock, representing approximately 40 million shares valued at approximately $1.3 billion, and $4.75 in cash, which amounts to approximately $309 million in aggregate cash, and together with approximately $136 million related to 10 million stock options exchanged and direct transaction costs of approximately $10 million resulted in an aggregate purchase price of approximately $1.7 billion. The $309 million of total cash consideration less cash acquired of approximately $161 million resulted in a net cash outlay of approximately $148 million. The value of the common stock was determined based on the average market price of the common stock over the 5-day period surrounding the date the acquisition was announced in July 2003. The value of the stock options was determined using the Black-Scholes option valuation model.
61
The preliminary allocation of the purchase price to the assets acquired and liabilities assumed based on the estimated fair values was as follows (in thousands):
| Cash acquired | $ | 160,673 | |||
| Other tangible assets acquired | 218,308 | ||||
| Amortizable intangible assets | |||||
| Existing technology and patents | 134,300 | ||||
| Affiliate and advertiser contracts and related relationships | 202,300 | ||||
| Trade name, trademark, and domain name | 17,300 | ||||
| Goodwill | 1,166,620 | ||||
| Total assets acquired | 1,899,501 | ||||
Liabilities assumed |
(240,952 |
) |
|||
| Deferred stock-based compensation | 74,588 | ||||
| Total | $ | 1,733,137 | |||
A preliminary estimate of $354 million has been allocated to amortizable intangible assets consisting of existing technology, patents, affiliate and advertiser contracts and related relationships, trade names, trademarks and domain names with useful lives not exceeding five years.
Other tangible assets acquired of approximately $218 million includes long-term prepaid traffic acquisition costs paid by Overture to Yahoo! of approximately $30 million. Liabilities assumed of approximately $241 million includes a current liability for traffic acquisition costs owed by Overture to Yahoo! of approximately $28 million.
A preliminary estimate of $1.2 billion has been allocated to goodwill. Goodwill represents the excess of the purchase price over the fair value of the net tangible and amortizable intangible assets acquired, and is not deductible for tax purposes. Goodwill will not be amortized and will be tested for impairment, at least annually. The preliminary purchase price allocation for Overture is subject to revision as more detailed analysis is completed and additional information on the fair value of Overture's assets and liabilities becomes available. Any change in the fair value of the net assets of Overture will change the amount of the purchase price allocable to goodwill.
Liabilities assumed included approximately $26 million of restructuring costs associated with the acquisition, approximately $18 million of which related to workforce reduction and approximately $8 million related to excess facilities. As of December 31, 2003, approximately $6 million remains related to remaining severance costs and approximately $7 million related to excess facilities.
The results of operations of HotJobs, Inktomi and Overture have been included in the Company's consolidated statements of operations since the completion of the acquisitions on February 12, 2002, March 19, 2003, and October 7, 2003, respectively. The following unaudited pro forma information presents a summary of the results of operations of the Company assuming the acquisitions of HotJobs, Inktomi and Overture occurred on January 1, 2002 (in thousands, except per share amounts):
|
|
Years Ended December 31, |
||||||
|---|---|---|---|---|---|---|---|
|
|
2002 |
2003 |
|||||
|
|
|||||||
| Net revenues | $ | 1,604,786 | $ | 2,257,027 | |||
| Net income (loss) | $ | (163,592 | ) | $ | 200,904 | ||
| Net income (loss) before cumulative effect of accounting change | $ | (227,712 | ) | $ | 200,904 | ||
| Net income (loss) per share basic: | |||||||
| Income (loss) per share before cumulative effect of accounting change | $ | (0.26 | ) | $ | 0.31 | ||
| Net income (loss) per share | $ | (0.36 | ) | $ | 0.31 | ||
| Net income (loss) per share diluted: | |||||||
| Income (loss) per share before cumulative effect of accounting change | $ | (0.26 | ) | $ | 0.30 | ||
| Net income (loss) per share | $ | (0.36 | ) | $ | 0.30 | ||
Results of operations for periods prior to the acquisition of the other entities acquired in 2002 were not material to the Company on either an individual or aggregate basis, and accordingly, pro forma results of operations have not been presented.
Note 7 RELATED PARTY TRANSACTIONS
At December 31, 2003, SOFTBANK Corp., including its consolidated affiliates ("SOFTBANK"), held approximately four percent of the then outstanding Common Stock of the Company. In addition, the Company has
62
joint ventures with SOFTBANK in France, Germany, Japan, Korea and the United Kingdom. A Managing Partner of a SOFTBANK affiliate is also a member of the Company's Board of Directors.
During 2001, 2002, and 2003, the Company recognized revenues of approximately $9 million, $10 million, and less than $1 million, respectively, on advertising and other arrangements with SOFTBANK. Management believes that prices on these contracts were comparable to those with other similarly situated customers of the Company.
The Company and other third parties are limited partners in Softbank Capital Partners LP ("Softbank Capital"), a venture capital fund for which a Softbank affiliate is the General Partner. The Company initially committed to a total investment of $30 million in the fund, and subsequently committed to invest an additional $6 million. To date, the total investment by the Company in Softbank Capital is approximately $34 million. Pursuant to the Partnership Agreement, the Company invested on the same terms and on the same basis as all other limited partners.
See Note 8 "Joint Ventures" for further information related to transactions involving SOFTBANK and Yahoo! Japan.
Note 8 JOINT VENTURES
Yahoo! Japan. During April 1996, the Company signed a joint venture agreement with SOFTBANK, which was amended in September 1997, whereby Yahoo! Japan Corporation ("Yahoo! Japan") was formed. The Company has a license agreement with Yahoo! Japan for specified uses of the Yahoo! brand and business model, and recorded license revenues of approximately $5 million, $8 million, $15 million for the years ended December 31, 2001, 2002 and 2003. The investment in Yahoo! Japan is being accounted for using the equity method. As of December 31, 2003, the carrying value of the investment was approximately $153 million and is recorded in other assets. The fair value of the Company's 34 percent ownership in Yahoo! Japan, based on the quoted trading price, was approximately $8.5 billion as of December 31, 2003.
Prior to and during 2001, Yahoo! Japan acquired the Company's equity interests in certain entities in Japan for total consideration of approximately $65 million, paid partially in shares of Yahoo! Japan Common Stock and partially in cash. As a result of the acquisition, the Company increased its investment in Yahoo! Japan, which resulted in approximately $41 million of goodwill to be amortized over seven years. This amortization ceased upon the adoption of SFAS 142.
The Company also records its share of the results of Yahoo! Japan one quarter in arrears within earnings in equity interests. The following table presents Yahoo! Japan's condensed financial information, as derived from the Yahoo! Japan financial statements for the twelve months ended September 30, 2001, 2002 and 2003 (in thousands):
|
|
Years ended September 30, |
|||||||||
|---|---|---|---|---|---|---|---|---|---|---|
|
|
2001 |
2002 |
2003 |
|||||||
|
|
||||||||||
| Operating data: | ||||||||||
| Revenues | $ | 164,935 | $ | 297,787 | $ | 500,091 | ||||
| Gross profit | $ | 141,403 | $ | 246,137 | $ | 462,352 | ||||
| Income from operations | $ | 59,731 | $ | 124,522 | $ | 262,393 | ||||
| Net income | $ | 34,258 | $ | 67,672 | $ | 145,720 | ||||
| Balance sheet data: | ||||||||||
| Current assets | $ | 184,385 | $ | 316,584 | ||||||
| Noncurrent assets | $ | 97,552 | $ | 206,704 | ||||||
| Current liabilities | $ | 75,949 | $ | 112,959 | ||||||
| Noncurrent liabilities | $ | 7,278 | $ | 15,795 | ||||||
There were no differences between United States and Japanese generally accepted accounting principles that materially impacted the amounts reflected in the Company's financial statements.
Yahoo! Europe. On November 1, 1996, the Company signed a joint venture agreement with a subsidiary of SOFTBANK whereby separate companies were formed in Germany, the United Kingdom, and France (collectively "Yahoo! Europe") to establish and manage versions of the Yahoo! Internet Guide for those countries, develop related online navigational services, and conduct other related business. The parties have invested a total of $6 million in proportion to their respective equity interests as of December 31, 2003. The Company has a majority share of approximately 70 percent in each of the Yahoo! Europe entities, and therefore, has consolidated their financial results. Minority interests are presented separately on the consolidated balance sheet and statement of operations.
63
Yahoo! Korea. During August 1997, the Company signed a joint venture agreement with SOFTBANK and other SOFTBANK affiliated companies whereby Yahoo! Korea was formed to develop and operate a Korean version of the Yahoo! Internet Guide, develop related Korean online navigational services, and conduct other related business. The parties originally invested a total of $1 million in proportion to their respective equity interests. During March 2000, the Company invested an additional $61 million in Yahoo! Korea. As a result, the Company recorded goodwill of approximately $20 million, to be amortized over seven years. This amortization ceased upon the adoption of SFAS 142. The Company has a majority share of approximately 67 percent in the joint venture, and therefore, has consolidated its financial results. Minority interests are presented separately on the consolidated balance sheet and statement of operations.
Note 9 RESTRUCTURING COSTS
During 2001, the Company announced restructuring programs to balance its investment in growth areas with the desire to modify its near-term business plan to reflect an economic and capital market slowdown. These restructuring programs included worldwide workforce reductions, consolidation of excess facilities and other charges. As a result of these restructuring programs, the Company recorded restructuring costs of approximately $57 million, classified as operating expenses in 2001.
Worldwide Workforce Reduction. The restructuring programs resulted in a workforce reduction of approximately 660 employees across certain business functions, operating units, and geographic regions. The worldwide workforce reductions were substantially completed within 2001. The Company recorded a workforce reduction charge of approximately $15 million in 2001 relating primarily to severance and fringe benefits.
Consolidation of Excess Facilities and Other Charges. The Company recorded a restructuring charge of approximately $42 million in 2001 relating to the consolidation of excess facilities and other charges. Of this charge, approximately $31 million was primarily for excess facilities relating to lease terminations and non-cancelable lease costs. This estimate was based on current comparable rates for leases in the respective markets. If facilities rental rates continue to decrease in these markets or if it takes longer than expected to sublease these facilities, the maximum amount the actual loss could exceed the original estimate is approximately $2 million. Property and equipment that was disposed of or removed from operations resulted in a net charge of approximately $9 million and consisted primarily of furniture and fixtures, servers, leasehold improvements, and computer equipment. The Company also recorded other restructuring costs of approximately $2 million relating primarily to payments for professional fees incurred with the restructuring program.
A summary of the restructuring costs is as follows (in thousands):
|
|
Workforce reduction |
Consolidation of excess facilities and other charges |
Total |
|||||||
|---|---|---|---|---|---|---|---|---|---|---|
|
|
||||||||||
| Total charge | $ | 15,137 | $ | 42,334 | $ | 57,471 | ||||
| Noncash charges | (5,411 | ) | (9,380 | ) | (14,791 | ) | ||||
| Cash payments | (5,901 | ) | (7,279 | ) | (13,180 | ) | ||||
| Restructuring accrual at December 31, 2001 | 3,825 | 25,675 | 29,500 | |||||||
| Cash payments | (3,825 | ) | (13,930 | ) | (17,755 | ) | ||||
| Restructuring accrual at December 31, 2002 | | 11,745 | 11,745 | |||||||
| Cash payments | | (4,286 | ) | (4,286 | ) | |||||
| Restructuring accrual at December 31, 2003 | $ | | $ | 7,459 | $ | 7,459 | ||||
The restructuring accrual is included on the balance sheet in accrued expenses and other current liabilities. Amounts related to the net lease expense due to the consolidation of facilities will be paid over the respective lease terms through December 2012.
See Note 6 "Acquisitions" for information related to acquisition-related restructuring accruals.
64
Note 10 LONG-TERM DEBT
In April 2003, the Company issued $750 million of zero coupon senior convertible notes (the "Notes") due April 2008, which resulted in net proceeds to the Company of approximately $733 million after transaction fees of approximately $17 million, which have been deferred and are included on the balance sheet in other assets. The Notes were issued at par and bear no interest. The Notes are convertible into Yahoo! common stock at a conversion price of $41.00 per share, which would result in the issuance of an aggregate of approximately 18 million shares, subject to adjustment upon the occurrence of specified events. Each $1,000 principal amount of the Notes will initially be convertible into 24.3902 shares of Yahoo! common stock prior to April 1, 2008 if the sale price of the Company's common stock issuable upon conversion of the Notes reaches a specified threshold for a defined period of time or specified corporate transactions have occurred. The specified thresholds for conversion prior to the maturity date are (1) the closing sale price of the Company's common stock for at least 20 trading days in the 30 trading-day period ending on the last trading day of the immediately preceding fiscal quarter exceeds 110 percent of the conversion price on that 30th trading day, and (2) during the period beginning January 1, 2008 through the maturity date, the closing sale price of the Company's common stock on the previous trading day was 110 percent or more of the then current conversion price. Upon conversion, Yahoo! has the right to deliver cash in lieu of common stock. The Company may be required to repurchase all of the notes following a fundamental change of the Company, such as a change of control, prior to maturity at face value. Yahoo! may not redeem the Notes prior to their maturity. As of December 31, 2003, the fair value of the Notes was approximately $966 million based on quoted market prices.
Note 11 STOCKHOLDERS' EQUITY
Stockholder Rights Plan. In March 2001, the Company adopted a Stockholder Rights Plan. Under the plan, Rights were distributed as a dividend at the rate of one Right for each share of common stock held by stockholders of record as of the close of business on March 20, 2001. The Rights Plan was not adopted in response to any effort to acquire control of the Company. The Rights will expire on March 1, 2011.
Stock Repurchase Program. In March 2001, the Company announced that its Board of Directors had authorized the Company to repurchase up to $500 million of its outstanding shares of common stock from time to time over the next two years, depending on market conditions, share price and other factors. In March 2003, the Company's Board of Directors authorized a two-year extension of the stock repurchase program, which extension authorizes the Company to repurchase up to approximately $340 million (representing the balance of the $500 million originally authorized in March 2001) of its outstanding shares of common stock from time to time over the next two years, depending on market conditions, share price and other factors. The Company may utilize equity instrument contracts to facilitate the repurchase of common stock. From March 2001 through December 31, 2003, the Company had repurchased 16,458,620 shares of common stock at an average of $9.72 per share for a total amount of approximately $160 million. Of the shares repurchased, 16,033,620 shares were purchased from SOFTBANK at an average of $9.67 per share. No shares were repurchased during the year ended December 31, 2003. Treasury stock is accounted for under the cost method.
Stock Option Plans. The Company's 1995 Stock Plan and stock option plans assumed through acquisitions are collectively referred to as the "Plans."
The Plans allow for the issuance of incentive stock options, non-statutory stock options, and stock purchase rights. Options are generally granted for a term of ten years and generally vest over a four-year period. The 1995 Stock Plan was amended in April 2002 to increase the number of shares available for issuance under the plan by an aggregate of 35 million shares to 287 million shares. The 1995 Stock Plan was amended in May 2003 to enable the Company to grant additional types of equity-based awards under the 1995 Stock Plan, including but not limited to, stock appreciation rights, indexed options, restricted stock, restricted stock units and dividend equivalents. The amendment also extended the termination date of the 1995 Stock Plan from May 2005 to May 2013. Shares available for future option grants at December 31, 2003 totaled approximately 32 million.
The 1996 Directors' Stock Option Plan (the "Directors' Plan") provides for the issuance of up to approximately 4 million non-statutory stock options to non-employee directors of the Company. Options under the Directors' Plan vest in equal monthly installments over four years for initial grants to new directors, and over four years for annual grants, with 25 percent of such options vesting on
65
the one-year anniversary of the date of grant, with the remaining options vesting in equal monthly installments over the 36-month period thereafter. The Directors' Plan was amended in April 2002 to increase the annual grant for outside Directors from 20,000 shares to 50,000 shares and to increase the number of shares available for issuance under the plan by an aggregate of 2 million shares to approximately 4 million shares. Shares available for future option grants at December 31, 2003 under the Directors' Plan totaled approximately 3 million shares.
Activity under the Company's stock option plans is summarized as follows (in thousands, except per share amounts):
|
|
Options Outstanding |
Weighted Average Exercise Price per Share |
|||
|---|---|---|---|---|---|
|
|
|||||
| Balance at December 31, 2000 | 118,325 | $ | 49.83 | ||
| Options assumed | 50 | 26.12 | |||
| Options granted | 60,211 | 18.60 | |||
| Options exercised | (15,317 | ) | 3.82 | ||
| Options canceled | (26,312 | ) | 60.45 | ||
| Balance at December 31, 2001 | 136,957 | 39.22 | |||
| Options assumed | 3,725 | 16.82 | |||
| Options granted | 28,841 | 15.29 | |||
| Options exercised | (17,409 | ) | 3.87 | ||
| Options canceled | (19,630 | ) | 47.36 | ||
| Balance at December 31, 2002 | 132,484 | 36.82 | |||
| Options assumed | 10,815 | 34.78 | |||
| Options granted | 20,606 | 35.20 | |||
| Options exercised | (24,353 | ) | 13.87 | ||
| Options canceled | (15,737 | ) | 54.27 | ||
| Balance at December 31, 2003 | 123,815 | $ | 38.63 | ||
The following table summarizes information concerning outstanding and exercisable options as of December 31, 2003 (in thousands, except years and per share amounts):
|
|
Options outstanding |
Options exercisable |
|||||||||
|---|---|---|---|---|---|---|---|---|---|---|---|
|
Range of Exercise Prices per Share |
Number Outstanding |
Average Remaining Contractual Life (in years) |
Weighted Average Exercise Price per Share |
Number Exercisable |
Weighted Average Exercise Price per Share |
||||||
| Less than $0.01 | 72 | 1.6 | $0.00 | 72 | $0.00 | ||||||
| $0.02 - $1.42 | 2,930 | 2.5 | 0.63 | 2,930 | 0.63 | ||||||
| $1.48 - $6.73 | 2,661 | 4.0 | 5.15 | 2,533 | 5.13 | ||||||
| $6.97 - $14.42 | 21,061 | 7.7 | 10.25 | 7,770 | 10.28 | ||||||
| $14.44 - $22.87 | 31,704 | 8.1 | 17.46 | 12,062 | 17.46 | ||||||
| $22.95 - $30.00 | 12,314 | 7.1 | 27.21 | 7,674 | 27.13 | ||||||
| $30.05 - $47.18 | 20,175 | 8.8 | 39.16 | 2,715 | 38.89 | ||||||
| $47.28 - $60.00 | 10,770 | 6.3 | 56.83 | 7,840 | 55.88 | ||||||
| $60.31 - $105.50 | 14,225 | 5.7 | 76.19 | 13,013 | 76.15 | ||||||
| $106.28 - $584.13 | 7,903 | 6.2 | 149.23 | 7,347 | 150.01 | ||||||
| Total | 123,815 | 7.3 | $38.63 | 63,956 | $49.26 | ||||||
Options to purchase approximately 63 million shares and 67 million shares were exercisable as of December 31, 2001 and 2002, respectively. The weighted average exercise prices per share for options exercisable as of December 31, 2001, and 2002 were $38.73 and $45.59, respectively.
66
Restricted Stock. The 1995 Stock Plan permits the granting of restricted stock either alone, or in addition to, or in tandem with other awards made by the Company. Right of repurchase on restricted stock grants generally lapses upon meeting certain performance-based milestones, or passage of time, or a combination of both. Restricted stock grants are generally measured at fair value on the date of grant based on the number of shares granted and the quoted price of our common stock. Such value is recognized as an expense over the corresponding service period. Restricted stock awards that have performance criteria are subject to variable accounting treatment. For the year ended December 31, 2003, approximately 219,000 shares of restricted stock were issued.
Employee Stock Purchase Plan. The Company has an Employee Stock Purchase Plan (the "Purchase Plan"), which provides for the issuance of a maximum of approximately 8 million shares of common stock. In February 2001, the Company amended the Purchase Plan to allow, among other things, a 24-month offering period beginning with the July 1, 2001 offering period. Eligible employees can have up to 15 percent of their earnings withheld, up to certain maximums, to be used to purchase shares of the Company's common stock at certain plan-defined dates. The price of the common stock purchased under the Purchase Plan for offering periods prior to July 1, 2001 was equal to 85 percent of the lower of the fair market value of the common stock on the commencement date of each six-month offering period or the specified purchase date. The price of the common stock purchased under the Purchase Plan for offering periods on or subsequent to July 1, 2001 will be equal to 85 percent of the lower of the fair market value of the common stock on the commencement date of each 24-month offering period or the specified purchase date. During 2001, 645,000 shares were purchased at prices from $9.25 to $16.99 per share. During 2002, 1,228,000 shares were purchased at prices from $9.25 to $12.55 per share. During 2003, 1,598,000 shares were purchased at prices from $9.25 to $21.05 per share. As of December 31, 2003, approximately 3 million shares were available under the Purchase Plan for future issuance.
Stock Based Compensation. The Company measures compensation expense for its stock-based employee compensation plans using the intrinsic value method. The Company recorded compensation expense in the amount of approximately $9 million, $8 million and $22 million, in 2001, 2002, and 2003, respectively. As of December 31, 2003, approximately $52 million remains to be amortized over the remaining vesting periods of the options and restricted stock. If the fair value based method had been applied in measuring stock compensation expense, the pro forma effect on net income (loss) and net income (loss) per share would have been as follows (in thousands, except per share amounts):
|
|
Years Ended December 31, |
||||||||||
|---|---|---|---|---|---|---|---|---|---|---|---|
|
|
2001 |
2002 |
2003 |
||||||||
|
|
|||||||||||
| Net income (loss): | |||||||||||
| As reported | $ | (92,788 | ) | $ | 42,815 | $ | 237,879 | ||||
| Add: Stock compensation expense included in reported net income (loss), net of related tax effects | 9,096 | 5,041 | 12,987 | ||||||||
| Less: Stock compensation expense determined under fair value based method for all awards, net of related tax effects | (899,503 | ) | (487,959 | ) | (216,025 | ) | |||||
| Pro forma net income (loss) | $ | (983,195 | ) | $ | (440,103 | ) | $ | 34,841 | |||
| Net income (loss) per share: | |||||||||||
| As reported basic | $ | (0.16 | ) | $ | 0.07 | $ | 0.39 | ||||
| Pro forma basic | $ | (1.73 | ) | $ | (0.74 | ) | $ | 0.06 | |||
| As reported diluted | $ | (0.16 | ) | $ | 0.07 | $ | 0.37 | ||||
| Pro forma diluted | $ | (1.73 | ) | $ | (0.74 | ) | $ | 0.05 | |||
Diluted and pro forma diluted net loss per share for the year ended December 31, 2001 is computed excluding potential common shares of 27 million shares, as their effect is anti-dilutive. Pro forma diluted net loss per share for the year ended December 31, 2002 is computed excluding potential common shares of 16 million shares, as their effect is anti-dilutive.
The weighted average fair value of options where the exercise price equaled the market price on grant date was $10.36, $9.99, and $18.43 for grants in the years ended December 31, 2001, 2002 and 2003, respectively. The weighted average fair value of options where the exercise price was greater than the market price on grant date was $9.87, $10.62, and $20.99 for grants in the years ended December 31, 2001, 2002 and 2003, respectively. The weighted average exercise price of options where the exercise price was greater than the market price on grant date was $46.48, $17.12, and $41.67 for grants in the years ended December 31, 2001, 2002, and 2003, respectively.
67
Because additional stock options are expected to be granted each year, the pro forma disclosures are not representative of pro forma effects on reported financial results for future years. The fair value of option grants is determined using the Black-Scholes option pricing model with the following weighted average assumptions:
|
|
Years Ended December 31, |
|||||
|---|---|---|---|---|---|---|
|
|
2001 |
2002 |
2003 |
|||
|
|
||||||
| Expected dividend | 0.0% | 0.0% | 0.0% | |||
| Risk-free interest rate ranges | 3.1% - 4.8% | 2.2% - 4.1% | 1.5% - 2.5% | |||
| Expected volatility (1) | 79% | 77% | 62% | |||
| Expected life (in years) | 3 | 3 | 3 | |||
The Black-Scholes option valuation model was developed for use in estimating the fair value of traded options that have no vesting restrictions and are fully transferable. In addition, option valuation models require the input of highly subjective assumptions, including the expected stock price volatility. Because the Company's options have characteristics significantly different from those of traded options, and because changes in the subjective input assumptions can materially affect the fair value estimate, in the opinion of management, the existing models do not necessarily provide a reliable single measure of the fair value of its options.
Note 12 SEGMENTS
The Company manages its business geographically. The primary areas of measurement and decision-making are the United States and International. Management relies on an internal management reporting process that provides revenue and segment operating income (loss) before depreciation and amortization for making financial decisions and allocating resources. Segment operating income (loss) before depreciation and amortization, previously referred to as "Segment EBITDA," includes income (loss) from operations before depreciation, amortization of intangible assets and amortization of stock compensation expense. Management believes that segment operating income (loss) before depreciation and amortization is an appropriate measure of evaluating the operational performance of the Company's segments. However, this measure should be considered in addition to, not as a substitute for, or superior to, income (loss) from operations or other measures of financial performance prepared in accordance with generally accepted accounting principles.
Summarized information by segment for 2001, 2002, and 2003, as excerpted from the internal management reports, is as follows (dollars in thousands):
|
|
Years Ended December 31, |
|||||||||||
|---|---|---|---|---|---|---|---|---|---|---|---|---|
|
|
2001 |
2002 |
2003 |
|||||||||
|
|
||||||||||||
| Revenues by segment: | ||||||||||||
| United States | $ | 594,332 | $ | 806,598 | $ | 1,355,153 | ||||||
| International | 123,090 | 146,469 | 269,944 | |||||||||
| Total revenues | $ | 717,422 | $ | 953,067 | $ | 1,625,097 | ||||||
| Segment operating income (loss) before depreciation and amortization: | ||||||||||||
| United States | $ | 16,611 | $ | 212,721 | $ | 441,372 | ||||||
| International | (35,210 | ) | (6,742 | ) | 36,011 | |||||||
| Total segment operating income (loss) before depreciation and amortization | (18,599 | ) | 205,979 | 477,383 | ||||||||
| Corporate and unallocated operating costs and expenses: | ||||||||||||
| Depreciation and amortization | (130,575 | ) | (109,389 | ) | (159,688 | ) | ||||||
| Stock compensation expense | (9,096 | ) | (8,402 | ) | (22,029 | ) | ||||||
| Income (loss) from operations | $ | (158,270 | ) | $ | 88,188 | $ | 295,666 | |||||
| Capital expenditures, net: | ||||||||||||
| United States | $ | 72,572 | $ | 42,193 | $ | 94,305 | ||||||
| International | 13,639 | 9,360 | 23,024 | |||||||||
| Total consolidated capital expenditures, net | $ | 86,211 | $ | 51,553 | $ | 117,329 | ||||||
|
|
December 31, |
|||||||
|---|---|---|---|---|---|---|---|---|
|
|
2002 |
2003 |
||||||
|
|
||||||||
| Long-lived assets: | ||||||||
| United States | $ | 919,667 | $ | 2,786,668 | ||||
| International | 137,102 | 161,584 | ||||||
| Total consolidated long-lived assets | $ | 1,056,769 | $ | 2,948,252 | ||||
Revenue is attributed to individual countries according to the international online property that generated the revenue. No single foreign country accounted for more than 10% of revenues in 2001, 2002, and 2003.
68
The following table presents revenues for groups of similar services (in thousands):
|
|
Years Ended December 31, |
|||||||||
|---|---|---|---|---|---|---|---|---|---|---|
|
|
2001 |
2002 |
2003 |
|||||||
|
|
||||||||||
| Marketing services | $ | 570,977 | $ | 651,568 | $ | 1,199,733 | ||||
| Fees | 119,090 | 207,941 | 298,192 | |||||||
| Listings | 27,355 | 93,558 | 127,172 | |||||||
| Total revenues | $ | 717,422 | $ | 953,067 | $ | 1,625,097 | ||||
No one customer accounted for 10 percent or more of total revenues during 2001. Revenues from the Company's agreement with Overture are included in marketing services for the years ended December 31, 2001 and 2002, and for the period from January 1, 2003 through October 7, 2003, the date the Company acquired Overture. Revenues from Overture amounted to 14 percent of total revenues for the year ended December 31, 2002. Revenues from Overture for the period from January 1, 2003 through October 7, 2003, amounted to 12 percent of total revenues for the year ended December 31, 2003.
Note 13 INCOME TAXES
The components of income (loss) before income taxes are as follows (in thousands):
|
|
Years Ended December 31, |
|||||||||
|---|---|---|---|---|---|---|---|---|---|---|
|
|
2001 |
2002 |
2003 |
|||||||
|
|
||||||||||
| United States | $ | (39,844 | ) | $ | 192,068 | $ | 364,594 | |||
| Foreign | (41,981 | ) | (13,843 | ) | 20,309 | |||||
| Income (loss) before income taxes and cumulative effect of accounting change | $ | (81,825 | ) | $ | 178,225 | $ | 384,903 | |||
The provision for income taxes is composed of the following (in thousands):
|
|
Years Ended December 31, |
|||||||||||
|---|---|---|---|---|---|---|---|---|---|---|---|---|
|
|
2001 |
2002 |
2003 |
|||||||||
|
|
||||||||||||
| Current: | ||||||||||||
| Federal | $ | 8,093 | $ | 75,077 | $ | 121,758 | ||||||
| State | 177 | 11,658 | 25,584 | |||||||||
| Foreign | 5,296 | 4,220 | 14,589 | |||||||||
| Total current | 13,566 | 90,955 | 161,931 | |||||||||
| Deferred: | ||||||||||||
| Federal | (1,297 | ) | (17,473 | ) | (13,276 | ) | ||||||
| State | (1,306 | ) | (2,192 | ) | (1,631 | ) | ||||||
| Total deferred | (2,603 | ) | (19,665 | ) | (14,907 | ) | ||||||
| Total provision for income taxes | $ | 10,963 | $ | 71,290 | $ | 147,024 | ||||||
The provision for income taxes differs from the amount computed by applying the statutory federal income tax rate as follows (in thousands):
|
|
Years Ended December 31, |
||||||||||
|---|---|---|---|---|---|---|---|---|---|---|---|
|
|
2001 |
2002 |
2003 |
||||||||
|
|
|||||||||||
| Income tax at the federal statutory rate of 35 percent | $ | (28,639 | ) | $ | 62,379 | $ | 134,716 | ||||
| State income tax, net of federal benefit | (1,034 | ) | 7,078 | 15,184 | |||||||
| Non-deductible acquisition-related charges | 20,255 | | | ||||||||
| Research tax credits | (3,900 | ) | (3,500 | ) | | ||||||
| Change in valuation allowances | 23,508 | 7,368 | 8,516 | ||||||||
| Earnings in equity interests | (3,988 | ) | (7,804 | ) | (16,676 | ) | |||||
| Other | 4,761 | 5,769 | 5,284 | ||||||||
| Total provision for income taxes | $ | 10,963 | $ | 71,290 | $ | 147,024 | |||||
Deferred income taxes reflect the tax effects of temporary differences between the carrying amounts of assets and liabilities for financial reporting purposes and the amounts used for income tax purposes. The components of
69
deferred income tax assets and liabilities are as follows (in thousands):
|
|
Years Ended December 31, |
||||||||||
|---|---|---|---|---|---|---|---|---|---|---|---|
|
|
2001 |
2002 |
2003 |
||||||||
|
|
|||||||||||
| Deferred income tax assets: | |||||||||||
| Net operating loss and credit carryforwards | $ | 1,423,323 | $ | 1,443,547 | $ | 1,538,723 | |||||
| Non-deductible reserves and expenses | 131,321 | 171,068 | 310,099 | ||||||||
| Gross deferred tax assets | 1,554,644 | 1,614,615 | 1,848,822 | ||||||||
| Valuation allowance | (1,530,838 | ) | (1,560,075 | ) | (1,659,551 | ) | |||||
| $ | 23,806 | $ | 54,540 | $ | 189,271 | ||||||
| Deferred income tax liabilities: | |||||||||||
| Unrealized investment gains | $ | (12,820 | ) | $ | (6,955 | ) | $ | (3,263 | ) | ||
| Purchased intangible assets | (10,986 | ) | (47,585 | ) | (186,008 | ) | |||||
| Gross deferred tax liabilities | $ | (23,806 | ) | $ | (54,540 | ) | $ | (189,271 | ) | ||
| Net deferred tax assets (liabilities) | $ | | $ | | $ | | |||||
As of December 31, 2003, the Company's federal and state net operating loss carryforwards for income tax purposes were approximately $3.6 billion and $2.1 billion, respectively. If not utilized, the federal net operating loss carryforwards will begin to expire in 2010, and approximately $113 million of the state net operating loss carryforwards will expire in 2004. The Company's federal and state research tax credit carryforwards for income tax purposes are approximately $85 million and $80 million, respectively. If not utilized, the federal tax credit carryforwards will begin to expire in 2010. The Company has a valuation allowance of approximately $1.7 billion as of December 31, 2003 for deferred tax assets because of uncertainty regarding their realization.
Deferred tax assets of approximately $1.4 billion as of December 31, 2003 pertain to certain net operating loss carryforwards and credit carryforwards resulting from the exercise of employee stock options. When recognized, the tax benefit of these loss and credit carryforwards are accounted for as a credit to additional paid-in capital rather than a reduction of the income tax provision. Included in deferred tax assets is approximately $100 million of acquired entity net operating losses that will adjust goodwill when recognized, and approximately $48 million of foreign net operating losses that will expire if not utilized.
Note 14 COMMITMENTS AND CONTINGENCIES
Operating Leases. During 1999, the Company entered into agreements for the development of an office complex in Sunnyvale, California to serve as its headquarters. Upon substantial completion of the construction in 2001, approximately $259 million was funded for the complex in connection with the lease financing arrangement, and at December 31, 2001 such amount had been classified as restricted long-term investments. During July 2002, the Company exercised its right, pursuant to the master lease agreement to acquire the complex for approximately $259 million, which was funded by the restricted long-term investments.
The Company has entered into various non-cancelable operating lease agreements for other offices throughout the United States, and for international subsidiaries, for original lease periods ranging from 6 months to 15 years and expiring between 2004 and 2018.
In addition, the Company has entered into various sublease arrangements associated with excess facilities under the 2001 restructuring programs. Such subleases have terms extending through 2006 and amounts estimated to be received have been included in determining the restructuring accrual.
Net lease commitments as of December 31, 2003 can be summarized as follows (in millions):
|
Years ending December 31, |
Gross lease commitments |
Sublease income |
Net lease commitments |
|||||||
|---|---|---|---|---|---|---|---|---|---|---|
| 2004 | $ | 43 | $ | (7 | ) | $ | 36 | |||
| 2005 | 34 | (4 | ) | 30 | ||||||
| 2006 | 25 | (3 | ) | 22 | ||||||
| 2007 | 21 | | 21 | |||||||
| 2008 | 16 | | 16 | |||||||
| Due after 5 years | 104 | | 104 | |||||||
| Total net lease commitments | $ | 243 | $ | (14 | ) | $ | 229 | |||
70
Rent expense under operating leases totaled approximately $19 million, $15 million, and $21 million for the years ended December 31, 2001, 2002 and 2003, respectively.
Investment in Privately-Held Company. During 2002, Yahoo! acquired an equity interest of approximately 16 percent in Sonera zed OY ("Zed"), a Finnish company and previously wholly-owned subsidiary of a publicly-held telecommunications company. Under the terms of the investment agreement, Yahoo! had call options to acquire the remaining interests not owned by Yahoo! and a put option to sell back its shares. In addition, Zed had a put option enabling Zed to require Yahoo! to acquire the remaining interests not owned by Yahoo! if Yahoo! exercised its option to buy a majority of Zed's outstanding shares. The amount of the purchase price for the remaining equity interests in Zed not held by Yahoo! under these options was not determinable at December 31, 2003 but would have been based on an operating performance based valuation of Zed. Yahoo! was not obligated to purchase additional equity in Zed unless it chose to exercise the option described above. As part of the transaction, Yahoo! agreed to provide up to 4 million Euro in additional funding to Zed. Other than this amount, Yahoo! was not obligated to guarantee any obligations of Zed or to provide any funding to Zed. Yahoo!'s investment in Zed was immaterial to its condensed consolidated balance sheet as of December 31, 2003. See Note 15 "Subsequent Events" regarding the exercise of the put arrangement and termination of the investment agreement.
Other Commitments. In the ordinary course of business, the Company enters into various arrangements with vendors and other business partners, principally for marketing, bandwidth and content arrangements. There are no material commitments for these arrangements extending beyond 2004.
In connection with Company's commercial agreements, Yahoo! provides indemnifications of varying scope and terms to customers, business partners and other parties with respect to certain matters, including, but not limited to, losses arising out of the Company's breach of such agreements and out of intellectual property infringement claims made by third parties. In addition, the Company has entered into indemnification agreements with its directors and certain of its officers that will require the Company, among other things, to indemnify them against certain liabilities that may arise by reason of their status or service as directors or officers. The Company maintains directors and officers insurance, which may cover certain liabilities arising from its obligation to indemnify its directors and officers in certain circumstances. The indemnification provided by the Company to its officers and directors does not have a stipulated maximum, therefore the Company is not able to develop a reasonable estimate of the maximum liabilities. To date, the Company has not incurred material costs as a result of such obligations and has not accrued any liabilities related to such indemnification obligations in its financial statements.
Contractual Obligations. Contractual obligations at December 31, 2003 are as follows (in millions):
|
|
Payments due by period |
|||||||||||||||
|---|---|---|---|---|---|---|---|---|---|---|---|---|---|---|---|---|
|
|
Total |
Less than 1 year |
1-3 years |
3-5 years |
More than 5 years |
|||||||||||
|
|
||||||||||||||||
| Long-term debt (1) | $ | 750 | $ | | $ | | $ | 750 | $ | | ||||||
| Operating lease obligations, net of sublease income | 229 | 36 | 52 | 37 | 104 | |||||||||||
| Affiliate commitments (2) | 92 | 74 | 17 | 1 | | |||||||||||
| Noncancelable purchase obligations | 42 | 28 | 14 | | | |||||||||||
| Total contractual obligations | $ | 1,113 | $ | 138 | $ | 83 | $ | 788 | $ | 104 | ||||||
At December 31, 2003 and 2002, the Company did not have any relationships with unconsolidated entities or financial partnerships, such as entities often referred to as structured finance or special purpose entities, which would have been established for the purpose of facilitating off-balance sheet arrangements or other contractually narrow or limited purposes. As such, the Company is not exposed to any financing, liquidity, market or credit risk that could arise if the Company had engaged in such relationships.
On April 21, 2003, Overture completed its purchase of the Web Search unit of Fast Search and Transfer ASA, a
71
Norway based developer of search and real-time filtering technologies, for $70 million in cash, plus a contingent earn-out payment of up to $30 million over three years based on specified operating criteria. The earn-out payment is not included in the table above.
See also Note 15 "Subsequent Events."
Contingencies. From time to time, third parties assert patent infringement claims against Yahoo! in the form of letters, lawsuits, and other forms of communication. Currently, the Company or its acquired subsidiaries, are engaged in several lawsuits regarding patent issues and have been notified of a number of other potential patent disputes.
In addition, from time to time the Company is subject to other legal proceedings and claims in the ordinary course of business, including claims of alleged infringement of trademarks, copyrights and other intellectual property rights, and a variety of claims arising in connection with its email, message boards, auction sites, shopping services, and other communications and community features, such as claims alleging defamation or invasion of privacy.
The Company does not believe, based on current knowledge, that any of the foregoing legal proceedings or claims are likely to have a material adverse effect on its financial position, results of operations or cash flows. However, the Company may incur substantial expenses in defending against third party claims. In the event of a determination adverse to Yahoo!, the Company may incur substantial monetary liability, and be required to change its business practices. Either of these could have a material adverse effect on the Company's financial position, results of operations or cash flows.
In October 2000, 800-JR-Cigar, Inc. filed a complaint in the United States District Court for the District of New Jersey against Overture, a wholly-owned subsidiary of the Company acquired in October 2003. In October 2002, Robert Novak, doing business as PetsWarehouse and PetsWarehouse.com, filed a complaint in the United States District Court for the Eastern District of New York against Overture. In August 2003, Accor filed a complaint in the Nanterre District Court in France against Overture and Overture S.A.R.L., Overture's wholly-owned subsidiary in France. The plaintiffs in each of these cases claim, among other things, that they have trademark rights in certain search terms and that Overture violates these rights by allowing its advertisers to bid on these search terms. The complaints seek injunctive relief and damages. Overture has also been named as a defendant in several other trade name infringement actions filed in Los Angeles, California in which plaintiffs made similar claims. The Company and Overture believe that Overture has meritorious defenses to liability and damages in each of these lawsuits and are contesting them vigorously.
On May 24, 2001, Arista Records, Inc., Bad Boy Records, BMG Music d/b/a The RCA Records Label, Capitol Records, Inc., Virgin Records America, Inc., Sony Music Entertainment Inc., UMG Recordings, Inc., Interscope Records, Motown Record Company, L.P., and Zomba Recording Corporation filed a lawsuit alleging copyright infringement against LAUNCH Media, Inc. ("LAUNCH") in the United States District Court for the Southern District of New York. After the lawsuit was commenced, Yahoo! entered into an agreement to acquire LAUNCH. In June 2001, LAUNCH settled the LAUNCH litigation as to UMG Recordings, Inc. Yahoo!'s acquisition of LAUNCH closed in August 2001, and since that time LAUNCH has been a wholly owned subsidiary of Yahoo!. The plaintiffs allege, among other things, that the consumer-influenced portion of LAUNCH's LAUNCHcast service is "interactive" within the meaning of Section 114 of the Copyright Act and therefore does not qualify for the compulsory license provided for by the Copyright Act. The Complaint seeks declaratory and injunctive relief and damages for the alleged infringement. Yahoo! and LAUNCH do not believe that LAUNCH has infringed any rights of plaintiffs and intend to vigorously contest the lawsuit. The lawsuit is still in the preliminary, discovery phase and the Company does not believe it is feasible to predict or determine the outcome or resolution of the LAUNCH litigation. The range of possible resolutions of the LAUNCH litigation could include judgments against the Company or settlements that could require substantial payments by the Company, which could have a material adverse impact on the Company's financial position, results of operations or cash flows. An estimate of the potential loss, if any, or range of loss that could arise from the LAUNCH litigation cannot be made at this time. In January 2003, LAUNCH settled the LAUNCH litigation as to Sony Music Entertainment, Inc. In October 2003, LAUNCH settled the litigation as to Capitol Records, Inc. and Virgin Records America, Inc. Accordingly, BMG Music d/b/a/ The RCA Records Label is the sole remaining plaintiff in this proceeding as of October 2003.
72
On July 12, 2001, the first of several purported securities class action lawsuits was filed in the United States District Court, Southern District of New York against certain underwriters involved in Overture's initial public offering, Overture, and certain of Overture's current and former officers and directors. The Court consolidated the cases against Overture into case number 01 Civ. 6339. Plaintiffs allege, among other things, violations of the Securities Act of 1933 and the Securities Exchange Act of 1934 involving undisclosed compensation to the underwriters, and improper practices by the underwriters, and seek unspecified damages. Similar complaints were filed in the same court against numerous public companies that conducted initial public offerings of their common stock since the mid-1990s. All of these lawsuits were consolidated for pretrial purposes before Judge Shira Scheindlin. On April 19, 2002, plaintiffs filed an amended complaint, alleging Rule 10b-5 claims of fraud. On July 15, 2002, the issuers filed a motion to dismiss for failure to comply with applicable pleading standards. On October 8, 2002, the Court entered an Order of Dismissal as to all of the individual defendants in the Overture IPO litigation, without prejudice. On February 19, 2003, the Court denied the motion to dismiss the Rule 10b-5 claims against certain defendants, including Overture. Settlement discussions relating to this case on behalf of the named defendants have occurred over the last several months, resulting in a final settlement memorandum of understanding with the plaintiffs in the case and Overture's insurance carriers. A proposal has been made for the settlement and release of claims against the issuer defendants, including Overture. The settlement is subject to a number of conditions, including approval of the proposed settling parties and the court. If the settlement does not occur, and litigation against Overture continues, the Company and Overture believe that Overture has meritorious defenses to liability and damages and intend to defend the case vigorously.
Note 15 SUBSEQUENT EVENTS
3721 Network Software Company Limited. On January 2, 2004, the Company completed the acquisition of 3721 Network Software Company Limited, a China-based software development company. Under the terms of the acquisition, the Company has agreed to pay a total of approximately $120 million in cash over two years, subject to certain performance conditions. In January 2004, approximately $50 million of the total commitment was paid. The remaining $70 million is a contingent earn-out payment over the two-year period ending December 31, 2005.
Sale of Investment in Privately-Held Company. In January 2004, the Company exercised its put option to sell back all of its shares of Zed to Sonera. There was no material impact to the Company's balance sheet, statement of operations or cash flows as a result of this transaction. As a result of the exercise of the put option, Yahoo! no longer has an investment in Zed and the Zed investment agreement has been terminated. See Note 14 "Commitments and Contingencies."
Legal Proceedings. On or about February 4, 2004, a shareholder derivative action was filed in the Court of Chancery of the State of Delaware in and for New Castle County, against the Company (as nominal defendant) and certain of its current and former officers and directors (the "Derivative Defendants"). Two similar shareholder derivative actions were filed in the California Superior Court for the County of San Mateo on February 13, 2004. The complaints generally allege breaches of fiduciary duties by the Derivative Defendants related to the alleged purchase of shares in initial public offerings or the alleged acquiescence in such conduct. The complaints seek unspecified monetary damages and other relief purportedly on behalf of the Company from the Derivative Defendants. The Company understands the Derivative Defendants deny any impropriety and intend to defend the lawsuits vigorously. The Company does not believe that the ultimate costs to resolve these matters will have a material adverse effect on its financial condition, results of operations or cash flows. In addition, the Company believes there are procedural defects to permitting these complaints to proceed on its behalf.
73
Schedule IIValuation and Qualifying Accounts
Years Ended December 31, 2001 2002 and 2003
(in thousands)
|
|
Balance at Beginning of Year |
Charged to Costs and Expenses |
Write-Offs Net of Recoveries |
Balance at End of Year |
|||||||||
|---|---|---|---|---|---|---|---|---|---|---|---|---|---|
|
|
|||||||||||||
| Allowance for Doubtful Accounts | |||||||||||||
| 2001 | $ | 15,437 | $ | 11,370 | $ | 6,812 | $ | 19,995 | |||||
| 2002 | $ | 19,995 | $ | 10,229 | $ | 6,372 | $ | 23,852 | |||||
| 2003 | $ | 23,852 | $ | 10,625 | $ | 2,516 | $ | 31,961 | |||||
74
Selected Quarterly Financial Data
(unaudited) (in thousands, except per share amounts)
|
|
Quarters Ended |
|||||||||||||||||||||||
|---|---|---|---|---|---|---|---|---|---|---|---|---|---|---|---|---|---|---|---|---|---|---|---|---|
|
|
March 31, 2002 |
June 30, 2002 |
September 30, 2002 |
December 31, 2002 |
March 31, 2003 |
June 30, 2003 |
September 30, 2003 |
December 31, 2003 |
||||||||||||||||
|
|
||||||||||||||||||||||||
| Revenues | $ | 192,665 | $ | 225,792 | $ | 248,823 | $ | 285,787 | $ | 282,948 | $ | 321,406 | $ | 356,821 | $ | 663,922 | ||||||||
Gross profit |
154,844 |
184,084 |
207,790 |
243,468 |
239,816 |
274,564 |
309,534 |
443,080 |
||||||||||||||||
Net income before cumulative effect of accounting change |
10,475 |
21,394 |
28,857 |
46,209 |
46,703 |
50,828 |
65,329 |
75,019 |
||||||||||||||||
| Cumulative effect of accounting change | (64,120 | ) | | | | | | | | |||||||||||||||
| Net income (loss) | $ | (53,645 | ) | $ | 21,394 | $ | 28,857 | $ | 46,209 | $ | 46,703 | $ | 50,828 | $ | 65,329 | $ | 75,019 | |||||||
| Net income per share before cumulative effect of accounting change basic | $ | 0.02 | $ | 0.04 | $ | 0.05 | $ | 0.08 | $ | 0.08 | $ | 0.08 | $ | 0.11 | $ | 0.11 | ||||||||
| Cumulative effect of accounting change per share basic | (0.11 | ) | | | | | | | | |||||||||||||||
| Net income (loss) per share basic | $ | (0.09 | ) | $ | 0.04 | $ | 0.05 | $ | 0.08 | $ | 0.08 | $ | 0.08 | $ | 0.11 | $ | 0.11 | |||||||
| Net income per share before cumulative effect of accounting change diluted | $ | 0.02 | $ | 0.03 | $ | 0.05 | $ | 0.08 | $ | 0.08 | $ | 0.08 | $ | 0.10 | $ | 0.11 | ||||||||
| Cumulative effect of accounting change per share diluted | (0.11 | ) | | | | | | | | |||||||||||||||
| Net income (loss) per share diluted | $ | (0.09 | ) | $ | 0.03 | $ | 0.05 | $ | 0.08 | $ | 0.08 | $ | 0.08 | $ | 0.10 | $ | 0.11 | |||||||
| Shares used in per share calculation basic | 586,878 | 598,740 | 596,743 | 592,992 | 596,642 | 604,018 | 610,697 | 655,602 | ||||||||||||||||
| Shares used in per share calculation diluted | 610,020 | 615,542 | 607,134 | 607,544 | 615,788 | 628,577 | 637,444 | 686,514 | ||||||||||||||||
75
Item 9. Changes in and Disagreements with Accountants on Accounting and Financial Disclosure
None.
Item 9A. Controls and Procedures
Disclosure Controls and Procedures. The Company's management, with the participation of the Company's Chief Executive Officer and Chief Financial Officer, has evaluated the effectiveness of the Company's disclosure controls and procedures (as such term is defined in Rules 13a-15(e) and 15d-15(e) under the Securities Exchange Act of 1934, as amended (the "Exchange Act")) as of the end of the period covered by this report. Based on such evaluation, the Company's Chief Executive Officer and Chief Financial Officer have concluded that, as of the end of such period, the Company's disclosure controls and procedures are effective in recording, processing, summarizing and reporting, on a timely basis, information required to be disclosed by the Company in the reports that it files or submits under the Exchange Act.
Internal Control Over Financial Reporting. There have not been any changes in the Company's internal control over financial reporting (as such term is defined in Rules 13a-15(f) and 15d-15(f) under the Exchange Act) during the most recent fiscal quarter that have materially affected, or are reasonably likely to materially affect, the Company's internal control over financial reporting.
Item 10. Directors and Executive Officers of the Registrant
The information required by this item relating to our directors and nominees, and compliance with Section 16(a) of the Securities Exchange Act of 1934 is incorporated by reference from Yahoo!'s Proxy Statement for its 2004 Annual Meeting of Stockholders to be filed with the SEC within 120 days after the end of the fiscal year ended December 31, 2003.
The following sets forth certain information with respect to the other executive officers of Yahoo!:
Michael Callahan (age 35), has served as Senior Vice President, General Counsel and Secretary since September 2003. Prior to that, Mr. Callahan served as Deputy General Counsel and Assistant Secretary from June 2001 to September 2003, Associate General Counsel from July 2000 to June 2001, Senior Corporate Counsel from March 2000 to July 2000 and Corporate Counsel from December 1999 to March 2000. Prior to joining Yahoo! in December 1999, Mr. Callahan served as Manager, Business Development and Corporate Counsel for Electronics for Imaging Inc. from January 1999 to November 1999. Prior to that, Mr. Callahan was associated with the law firm of Skadden, Arps, Slate, Meagher & Flom LLP.
Susan Decker (age 41), has served as Yahoo!'s Chief Financial Officer since June 2000 and as Executive Vice President, Finance and Administration since January 2002. Prior to that, Ms. Decker served as Senior Vice President, Finance and Administration from June 2000 to January 2002. From August 1986 to May 2000, Ms. Decker held several positions for Donaldson, Lufkin & Jenrette, including Director of Global Research from 1998 to 2000. Prior to 1998, she was a Publishing & Advertising Equity Securities Analyst for 12 years.
David Filo (age 37), Chief Yahoo! and a founder of Yahoo!, has served as an officer of Yahoo! since March 1995, and served as a director of Yahoo! from its founding through February 1996. Mr. Filo reports to Chairman and Chief Executive Officer, Terry Semel. He is involved in guiding Yahoo!'s vision, is involved in many key aspects of the business at a strategic and operational level, and is a stalwart of the Company's employee culture and morale. Mr. Filo co-developed Yahoo! in 1994 while working towards his Ph.D. in electrical engineering at Stanford University, and co-founded Yahoo! in 1995.
Farzad Nazem (age 42), has served as Executive Vice President and Chief Technology Officer since January 2002. Prior to that, from February 2001 to January 2002, Mr. Nazem served as Senior Vice President, Communications and Technical Services and Chief Technology Officer. From January 1998 to February 2001, Mr. Nazem served as Chief Technology Officer. Prior to that, he served as Yahoo!'s Senior Vice President, Product Development and Site Operations from March 1996 to January 1998. From 1985 to 1996, Mr. Nazem held a
76
number of technical and executive management positions at Oracle Corporation, including Vice President of Oracle's Media and Web Server Division and member of the Product Division Management Committee.
Daniel Rosensweig (age 42), has served as Chief Operating Officer since April 2002. Prior to joining Yahoo!, Mr. Rosensweig was President of CNET Networks from October 2000. Prior to that, Mr. Rosensweig served as Chief Executive Officer of ZDNet, Inc. from January 1999 and President of ZDNet, Inc. from 1997 to July 2000. Mr. Rosensweig served as President of Ziff-Davis Internet Publishing Group from 1996 to 1997.
We have adopted a code of ethics that applies to our chief executive officer, chief financial officer and controller. This code of ethics is posted on our Website located at www.yahoo.com. The code of ethics may be found as follows: From our main Web page, first click on "Company Info" at the bottom of the page and then on "Investor Relations." Next click on "Corporate Governance." Finally, click on "Code of Ethics." We intend to satisfy the disclosure requirement under Item 10 of Form 8-K regarding an amendment to, or waiver from, a provision of this code of ethics by posting such information on our Website, at the address and location specified above.
Item 11. Executive Compensation
Incorporated by reference from Yahoo!'s Proxy Statement for its 2004 Annual Meeting of Stockholders to be filed with the SEC within 120 days after the end of the fiscal year ended December 31, 2003.
Item 12. Security Ownership of Certain Beneficial Owners and Management and Related Stockholder Matters
Incorporated by reference Yahoo!'s Proxy Statement for its 2004 Annual Meeting of Stockholders to be filed with the SEC within 120 days after the end of the fiscal year ended December 31, 2003.
Item 13. Certain Relationships and Related Transactions
Incorporated by reference from Yahoo!'s Proxy Statement for its 2004 Annual Meeting of Stockholders to be filed with the SEC within 120 days after the end of the fiscal year ended December 31, 2003.
Item 14. Principal Accounting Fees and Services
Incorporated by reference from Yahoo!'s Proxy Statement for its 2004 Annual Meeting of Stockholders to be filed with the SEC within 120 days after the end of the fiscal year ended December 31, 2003.
Item 15. Exhibits, Financial Statement Schedules, and Reports on Form 8-K
77
|
Exhibit Number |
Description |
|
|---|---|---|
| 2.1 | Agreement and Plan of Merger dated as of June 27, 2000 by and among the Registrant, Hermes Acquisition Corporation and eGroups, Inc. (Filed as Exhibit 2.8 to the Registrant's Quarterly Report on Form 10-Q for the quarter ended June 30, 2000 [the June 30, 2000 10-Q] and incorporated herein by reference.) | |
| 2.2 | Agreement and Plan of Merger, dated as of December 27, 2001 by and among the Registrant, HJ Acquisition Corp. and HotJobs.com, Ltd. (Filed as Exhibit 2.1 to the Registrant's Current Report on Form 8-K filed on December 27, 2001 and incorporated herein by reference.) | |
| 2.3 | Agreement and Plan of Merger dated as of December 22, 2002 by and among the Registrant, December 2002 Acquisition Corp. and Inktomi Corporation (Filed as Exhibit 2.1 to the Registrant's Current Report on Form 8-K filed on January 8, 2003 and incorporated herein by reference.) | |
| 2.4 | Agreement and Plan of Merger dated as of July 14, 2003 by and among the Registrant, July 2003 Merger Corp. and Overture Services, Inc (Filed as Exhibit 2.1 to the Registrant's Current Report on Form 8-K filed on July 17, 2003 and incorporated herein by reference). | |
| 3.1 | Amended and Restated Certificate of Incorporation of Registrant (Filed as Exhibit 3.1 to the June 30, 2000 10-Q and incorporated herein by reference.) | |
| 3.2 | Amended Bylaws of Registrant (Filed as Exhibit 4.9 to the Registrant's Registration Statement on Form S-8 filed on March 5, 2002 [the March 5, 2002 Form S-8] and incorporated herein by reference.) | |
| 4.1 | Form of Senior Indenture (Filed as Exhibit 4.1 to the Registrant's Registration Statement on Form S-3, Registration No. 333-46458, filed September 22, 2000 [the September 22, 2000 Form S-3] and incorporated herein by reference.) | |
| 4.2 | Form of Subordinated Indenture (Filed as Exhibit 4.2 to the September 22, 2000 Form S-3 and incorporated herein by reference.) | |
| 4.3** | Form of Senior Note | |
| 4.4** | Form of Subordinated Note | |
| 4.5** | Form of Certificate of Designation for Preferred Stock (together with Preferred Stock certificate) | |
| 4.6 | Form of Deposit Agreement (together with Depository Receipt) (Filed as Exhibit 4.6 to the September 22, 2000 Form S-3 and incorporated herein by reference.) | |
| 4.7** | Form of Warrant Agreement (together with form of Warrant Certificate) | |
| 4.8 | Rights Agreement, dated as of March 15, 2001, between the Registrant and Equiserve Trust Company, N.A., as Rights Agent, including the form of Rights Certificate as Exhibit B and the summary of Rights to Purchase Preferred Stock as Exhibit C (Filed as Exhibit 4.1 to the Registrant's Current Report on Form 8-K, filed March 19, 2001 and incorporated herein by reference.) | |
| 4.9 | Indenture, dated as of April 9, 2003 by and between the Registrant and U. S. Bank National Association (Filed as Exhibit 4.1 to the Registrant's Current Report on Form 8-K filed on April 10, 2003 [the April 10, 2003 Form 8-K] and incorporated herein by reference.) | |
| 4.10 | Registration Rights Agreement, dated as of April 9, 2003 among the Registrant and Credit Suisse First Boston LLC (Filed as Exhibit 4.2 to the April 10, 2003 Form 8-K and incorporated herein by reference.) | |
| 10.1 | Form of Indemnification Agreement with certain of the Registrant's officers and directors (Filed as Exhibit 10.1 to the Registrant's Annual Report on Form 10-K for the year ended December 31, 1999 and incorporated herein by reference.) | |
78
| 10.2* | 1995 Stock Plan, as amended and form agreements thereunder. | |
| 10.3 | Form of Management Continuity Agreement with certain of the Registrant's Executive Officers (Filed as Exhibit 10.3 to the Registrant's Registration Statement on Form SB-2, Registration No. 333-2142-LA, declared effective on April 11, 1996 [the SB-2 Registration Statement] and incorporated herein by reference.) | |
| 10.4 | Second Amended and Restated Investor Rights Agreement dated March 12, 1996 between the Registrant and certain shareholders (Filed as Exhibit 10.9 to the SB-2 Registration Statement and incorporated herein by reference.) | |
| 10.5 | Amended and Restated 1996 Employee Stock Purchase Plan and form of subscription agreement (Filed as Exhibit 10.8 to the Registrant's Annual Report on Form 10-K for the year ended December 31, 2000 and incorporated herein by reference.) | |
| 10.6 | 1996 Directors' Stock Option Plan, as amended (filed as Exhibit 4.2 to the June 6, 2002 S-8 and incorporated herein by reference) and form of option agreement (Filed as Exhibit 10.21 to the SB-2 Registration Statement and incorporated herein by reference.) | |
| 10.7 | Joint Venture Agreement dated April 1, 1996 by and between the Registrant and SOFTBANK Corporation (Filed as Exhibit 10.7 to the Registrant's Annual Report on Form 10-K for the year ended December 31, 2002 and incorporated herein by reference.) | |
| 10.8 | Yahoo! Japan License Agreement dated April 1, 1996 by and between the Registrant and Yahoo! Japan Corporation (Filed as Exhibit 10.43 to Amendment No. 3 to the Registrant's Registration Statement on Form S-3 filed on December 23, 2002 [the December 23, 2002 Form S-3] and incorporated herein by reference.) | |
| 10.9 | Joint Venture Agreement dated November 1, 1996 by and between the Registrant and SB Holdings (Europe) Ltd. (Filed as Exhibit 10.9 to the Registrant's Annual Report on Form 10-K for the year ended December 31, 2002 and incorporated herein by reference.) | |
| 10.10 | Joint Venture Agreement dated August 31, 1997 between the Registrant, SOFTBANK Korea Corporation, SOFTBANK Corporation, and Yahoo! Japan Corporation (Filed as Exhibit 10.1 to the Registrant's Quarterly Report on Form 10-Q for the quarter ended September 30, 1997 and incorporated herein by reference) | |
| 10.11 | Amendment Agreement dated September 17, 1997 by and between Registrant and SOFTBANK Corporation (Filed as Exhibit 10.11 to the Registrant's Annual Report on Form 10-K for the year ended December 31, 2002 and incorporated herein by reference.) | |
| 10.12 | Amendment to Yahoo! Japan License Agreement dated September 17, 1997 by and between the Registrant and Yahoo! Japan Corporation (Filed as Exhibit 10.43 to the December 23, 2002 Form S-3 and incorporated herein by reference.) | |
| 10.13 | Services Agreement dated November 30, 1997 by and between Yahoo! Korea Corporation and SOFTBANK Korea Corporation (Filed as Exhibit 10.42 to the December 23, 2002 Form S-3 and incorporated herein by reference.) | |
| 10.14 | Yahoo! Korea License Agreement dated November 30, 1997 by and between the Registrant, Yahoo! Korea Corporation, and Yahoo! Japan Corporation (Filed as Exhibit 10.41 to the December 23, 2002 Form S-3 and incorporated herein by reference.) | |
| 10.15 | Amendment to Second Amended and Restated Investor Rights Agreement dated July 7, 1998 among the Registrant, SOFTBANK Holdings Inc., Sequoia Capital VI and Sequoia Technology Partners VI (Filed as Exhibit 10.2 to the Registrant's Quarterly Report on Form 10-Q for the quarter ended September 30, 1998 and incorporated herein by reference.) | |
79
| 10.16 | Employment Letter, dated as of March 19, 2001, between the Registrant and Gregory Coleman (Filed as Exhibit 10.36 to the Registrant's Quarterly Report on Form 10-Q for the quarter ended March 31, 2001 and incorporated herein by reference.) | |
| 10.17 | Employment Letter, dated as of April 16, 2001, between the Registrant and Terry S. Semel (Filed as Exhibit 10.39 to the Registrant's Quarterly Report on Form 10-Q for the quarter ended June 30, 2001 [the June 30, 2001 10-Q] and incorporated herein by reference.) | |
| 10.18 | Stock Purchase Agreement, dated as of April 16, 2001, between the Registrant and Terry S. Semel (Filed as Exhibit 10.40 to the June 30, 2001 10-Q and incorporated herein by reference.) | |
| 10.19 | Consent and Resale Agreement dated as of March 25, 2002, between the Registrant and SOFTBANK Corp. (Filed as Exhibit 10.40 to the Registrant's Quarterly Report on Form 10-Q for the quarter ended March 31, 2002 and incorporated herein by reference.) | |
| 10.20 | Employment agreement between Registrant and Daniel Rosensweig dated April 23, 2002 (Filed as Exhibit 10.41 to the Registrant's Quarterly Report on Form 10-Q for the quarter ended June 30, 2002 [the June 30, 2002 10-Q] and incorporated herein by reference.) | |
| 10.21 | Recourse Promissory Note executed by Daniel Rosensweig for the benefit of Registrant (Filed as Exhibit 10.42 to the June 30, 2002 10-Q and incorporated herein by reference.) | |
| 10.22 | Yahoo! Key Executive New Hire Retention Plan (Filed as Exhibit 10.43 to the June 30, 2002 10-Q and incorporated herein by reference.) | |
| 10.23 | Key Executive New Hire Retention Agreement between the Registrant and Daniel Rosensweig (Filed as Exhibit 10.44 to the June 30, 2002 10-Q and incorporated herein by reference.) | |
| 10.24 | Stock Purchase Agreement, dated as of August 28, 2002 between the Registrant and SOFTBANK America, Inc. (Filed as Exhibit 10.45 to the Registrant's Quarterly Report on Form 10-Q for the quarter ended September 30, 2002 [the September 30, 2002 10-Q] and incorporated herein by reference.) | |
| 10.25 | Registration Rights Agreement, dated as of August 28, 2002 between Registrant and Acqua Wellington Private Placement Fund Ltd. and Acqua Wellington Opportunity I Limited. (Filed as Exhibit 10.46 to the September 30, 2002 10-Q and incorporated herein by reference.) | |
| 10.26 | Hosting Services Agreement, dated September 26, 2001, by and between the Registrant and eGroups K.K (Filed as Exhibit 10.44 to the December 23, 2003 Form S-3 and incorporated herein by reference.) | |
| 10.27 | Overture Search Services Agreement, dated May 1, 2002 by and between the Registrant and Overture Services, Inc. (Filed as Exhibit 10.27 to the Registrant's Annual Report on Form 10-K for the year ended December 31, 2002 and incorporated herein by reference.) | |
| 10.28 | First Addendum to Overture Search Services Agreement, dated October 1, 2002 by and between Registrant and Overture Services, Inc. (Filed as Exhibit 10.28 to the Registrant's Annual Report on Form 10-K for the year ended December 31, 2002 and incorporated herein by reference.) | |
| 10.29 | Second Addendum to Overture Search Services Agreement, dated January 13, 2003 by and between the Registrant and Overture Services, Inc. (Filed as Exhibit 10.29 to the Registrant's Annual Report on Form 10-K for the year ended December 31, 2002 and incorporated herein by reference.) | |
| 10.30 | HotJobs.com, Ltd. 1999 Stock Option/Stock Issuance Plan (Filed as Exhibit 4.1 to the March 5, 2002 Form S-8 and incorporated herein by reference.) | |
| 10.31 | HotJobs.com, Ltd. 1999 Stock Option/Stock Issuance Plan Amendment No. 1 (Filed as Exhibit 4.2 to the March 5, 2002 Form S-8 and incorporated herein by reference.) | |
| 10.32 | HotJobs.com, Ltd. 2000 Stock Option Plan (Filed as Exhibit 4.3 to the March 5, 2002 Form S-8 and incorporated herein by reference.) | |
80
| 10.33 | HotJobs.com, Ltd. Stock Award Plan (Filed as Exhibit 4.4 to the March 5, 2002 Form S-8 and incorporated herein by reference.) | |
| 10.34 | Resumix, Inc. 1998 Equity Incentive Plan (Filed as Exhibit 4.5 to the March 5, 2002 Form S-8 and incorporated herein by reference.) | |
| 10.35 | Resumix, Inc. 2000 Stock Option Plan (Filed as Exhibit 4.7 to the March 5, 2002 Form S-8 and incorporated herein by reference.) | |
| 10.36 | Employment Letter, dated as of March 20, 2003 between the Registrant and Gregory Coleman. (Filed as Exhibit 10.36 to the Registrant's Quarterly Report on Form 10-Q for the quarter ended March 31, 2003 and incorporated herein by reference.) | |
| 10.37 | Third Addendum to Overture Search Services Agreement, dated April 25, 2003 by and between the Registrant and Overture Services, Inc. (Filed as Exhibit 10.37 to the Registrant's Quarterly Report on Form 10-Q for the quarter ended June 30, 2003 and incorporated herein by reference.) | |
| 21.1* | List of Subsidiaries | |
| 23.1* | Consent of Independent Accountants | |
| 24.1 | Power of Attorney (see the signature page of this Annual Report on Form 10-K) | |
| 31* | Certificates of Chief Executive Officer and Chief Financial Officer pursuant to Securities Exchange Act Rules 13a-14(a) and 15d-14(a) as Adopted Pursuant to Section 302 of the Sarbanes-Oxley Act of 2002 dated February 27, 2004. | |
| 32* | Certificate of Chief Executive Officer and Chief Financial Officer pursuant to section 18 U.S.C. section 1350 dated February 27, 2004. |
On October 8, 2003, the Registrant filed a Current Report on Form 8-K announcing the Registrant's financial results for the quarterly period ended September 30, 2003.
On October 10, 2003, the Registrant filed an amended Current Report on Form 8-K/A announcing that it had completed its acquisition of Overture Services, Inc. and attaching as exhibits a press release and certain financial information relating to the Registrant.
On November 21, 2003 the Registrant filed a Current Report on Form 8-K attaching as an exhibit a press release announcing that Yahoo! Holdings (Hong Kong) Limited, a wholly-owned subsidiary of the Registrant, had entered into a definitive agreement to acquire 3721 Network Software Company Limited.
81
Pursuant to the requirements of Section 13 or 15(d) of the Securities Exchange Act of 1934, the Registrant has duly caused the report to be signed on its behalf by the undersigned, thereunto duly authorized, on the 27th day of February, 2004.
| YAHOO! INC. | ||||
By: |
/s/ SUSAN DECKER Susan Decker Executive Vice President, Finance and Administration, and Chief Financial Officer |
|||
KNOW ALL PERSONS BY THESE PRESENTS, that each person whose signature appears below constitutes and appoints Terry Semel and Susan Decker, his/her attorneys-in-fact, each with the power of substitution, for him/her in any and all capacities, to sign any amendments to this Report on Form 10-K, and to file the same, with Exhibits thereto and other documents in connection therewith with the Securities and Exchange Commission, hereby ratifying and confirming all that each of said attorneys-in-fact, or substitute or substitutes may do or cause to be done by virtue hereof.
Pursuant to the requirements of the Securities Exchange Act of 1934, this report has been signed below by the following persons on behalf of the Registrant and in the capacities and on the dates indicated:
|
Signature |
Title |
Date |
||
|---|---|---|---|---|
|
|
||||
|
/s/ TERRY SEMEL Terry Semel |
Chairman and Chief Executive Officer (Principal Executive Officer) | February 27, 2004 | ||
|
/s/ SUSAN DECKER Susan Decker |
Executive Vice President, Finance and Administration, and Chief Financial Officer (Principal Financial Officer) |
February 27, 2004 |
||
|
/s/ PATRICIA CUTHBERT Patricia Cuthbert |
Vice President and Corporate Controller (Principal Accounting Officer) |
February 27, 2004 |
||
82
|
/s/ ROY BOSTOCK Roy Bostock |
Director |
February 27, 2004 |
||
|
/s/ RONALD W. BURKLE Ronald W. Burkle |
Director |
February 27, 2004 |
||
|
/s/ ERIC HIPPEAU Eric Hippeau |
Director |
February 27, 2004 |
||
|
/s/ ARTHUR KERN Arthur Kern |
Director |
February 27, 2004 |
||
|
/s/ ROBERT KOTICK Robert Kotick |
Director |
February 27, 2004 |
||
|
/s/ EDWARD KOZEL Edward Kozel |
Director |
February 27, 2004 |
||
|
/s/ GARY WILSON Gary Wilson |
Director |
February 27, 2004 |
||
|
/s/ JERRY YANG Jerry Yang |
Director |
February 27, 2004 |
83
|
Exhibit Number |
Description |
|
|---|---|---|
| 2.1 | Agreement and Plan of Merger dated as of June 27, 2000 by and among the Registrant, Hermes Acquisition Corporation and eGroups, Inc. (Filed as Exhibit 2.8 to the Registrant's Quarterly Report on Form 10-Q for the quarter ended June 30, 2000 [the June 30, 2000 10-Q] and incorporated herein by reference.) | |
| 2.2 | Agreement and Plan of Merger, dated as of December 27, 2001 by and among the Registrant, HJ Acquisition Corp. and HotJobs.com, Ltd. (Filed as Exhibit 2.1 to the Registrant's Current Report on Form 8-K filed on December 27, 2001 and incorporated herein by reference.) | |
| 2.3 | Agreement and Plan of Merger dated as of December 22, 2002 by and among the Registrant, December 2002 Acquisition Corp. and Inktomi Corporation (Filed as Exhibit 2.1 to the Registrant's Current Report on Form 8-K filed on January 8, 2003 and incorporated herein by reference.) | |
| 2.4 | Agreement and Plan of Merger dated as of July 14, 2003 by and among the Registrant, July 2003 Merger Corp. and Overture Services, Inc (Filed as Exhibit 2.1 to the Registrant's Current Report on Form 8-K filed on July 17, 2003 and incorporated herein by reference). | |
| 3.1 | Amended and Restated Certificate of Incorporation of Registrant (Filed as Exhibit 3.1 to the June 30, 2000 10-Q and incorporated herein by reference.) | |
| 3.2 | Amended Bylaws of Registrant (Filed as Exhibit 4.9 to the Registrant's Registration Statement on Form S-8 filed on March 5, 2002 [the March 5, 2002 Form S-8] and incorporated herein by reference.) | |
| 4.1 | Form of Senior Indenture (Filed as Exhibit 4.1 to the Registrant's Registration Statement on Form S-3, Registration No. 333-46458, filed September 22, 2000 [the September 22, 2000 Form S-3] and incorporated herein by reference.) | |
| 4.2 | Form of Subordinated Indenture (Filed as Exhibit 4.2 to the September 22, 2000 Form S-3 and incorporated herein by reference.) | |
| 4.3** | Form of Senior Note | |
| 4.4** | Form of Subordinated Note | |
| 4.5** | Form of Certificate of Designation for Preferred Stock (together with Preferred Stock certificate) | |
| 4.6 | Form of Deposit Agreement (together with Depository Receipt) (Filed as Exhibit 4.6 to the September 22, 2000 Form S-3 and incorporated herein by reference.) | |
| 4.7** | Form of Warrant Agreement (together with form of Warrant Certificate) | |
| 4.8 | Rights Agreement, dated as of March 15, 2001, between the Registrant and Equiserve Trust Company, N.A., as Rights Agent, including the form of Rights Certificate as Exhibit B and the summary of Rights to Purchase Preferred Stock as Exhibit C (Filed as Exhibit 4.1 to the Registrant's Current Report on Form 8-K, filed March 19, 2001 and incorporated herein by reference.) | |
| 4.9 | Indenture, dated as of April 9, 2003 by and between the Registrant and U. S. Bank National Association (Filed as Exhibit 4.1 to the Registrant's Current Report on Form 8-K filed on April 10, 2003 [the April 10, 2003 Form 8-K] and incorporated herein by reference.) | |
| 4.10 | Registration Rights Agreement, dated as of April 9, 2003 among the Registrant and Credit Suisse First Boston LLC (Filed as Exhibit 4.2 to the April 10, 2003 Form 8-K and incorporated herein by reference.) | |
| 10.1 | Form of Indemnification Agreement with certain of the Registrant's officers and directors (Filed as Exhibit 10.1 to the Registrant's Annual Report on Form 10-K for the year ended December 31, 1999 and incorporated herein by reference.) | |
| 10.2* | 1995 Stock Plan, as amended and form agreements thereunder. | |
| 10.3 | Form of Management Continuity Agreement with certain of the Registrant's Executive Officers (Filed as Exhibit 10.3 to the Registrant's Registration Statement on Form SB-2, Registration No. 333-2142-LA, declared effective on April 11, 1996 [the SB-2 Registration Statement] and incorporated herein by reference.) | |
| 10.4 | Second Amended and Restated Investor Rights Agreement dated March 12, 1996 between the Registrant and certain shareholders (Filed as Exhibit 10.9 to the SB-2 Registration Statement and incorporated herein by reference.) | |
| 10.5 | Amended and Restated 1996 Employee Stock Purchase Plan and form of subscription agreement (Filed as Exhibit 10.8 to the Registrant's Annual Report on Form 10-K for the year ended December 31, 2000 and incorporated herein by reference.) | |
| 10.6 | 1996 Directors' Stock Option Plan, as amended (filed as Exhibit 4.2 to the June 6, 2002 S-8 and incorporated herein by reference) and form of option agreement (Filed as Exhibit 10.21 to the SB-2 Registration Statement and incorporated herein by reference.) | |
| 10.7 | Joint Venture Agreement dated April 1, 1996 by and between the Registrant and SOFTBANK Corporation (Filed as Exhibit 10.7 to the Registrant's Annual Report on Form 10-K for the year ended December 31, 2002 and incorporated herein by reference.) | |
| 10.8 | Yahoo! Japan License Agreement dated April 1, 1996 by and between the Registrant and Yahoo! Japan Corporation (Filed as Exhibit 10.43 to Amendment No. 3 to the Registrant's Registration Statement on Form S-3 filed on December 23, 2002 [the December 23, 2002 Form S-3] and incorporated herein by reference.) | |
| 10.9 | Joint Venture Agreement dated November 1, 1996 by and between the Registrant and SB Holdings (Europe) Ltd. (Filed as Exhibit 10.9 to the Registrant's Annual Report on Form 10-K for the year ended December 31, 2002 and incorporated herein by reference.) | |
| 10.10 | Joint Venture Agreement dated August 31, 1997 between the Registrant, SOFTBANK Korea Corporation, SOFTBANK Corporation, and Yahoo! Japan Corporation (Filed as Exhibit 10.1 to the Registrant's Quarterly Report on Form 10-Q for the quarter ended September 30, 1997 and incorporated herein by reference) | |
| 10.11 | Amendment Agreement dated September 17, 1997 by and between Registrant and SOFTBANK Corporation (Filed as Exhibit 10.11 to the Registrant's Annual Report on Form 10-K for the year ended December 31, 2002 and incorporated herein by reference.) | |
| 10.12 | Amendment to Yahoo! Japan License Agreement dated September 17, 1997 by and between the Registrant and Yahoo! Japan Corporation (Filed as Exhibit 10.43 to the December 23, 2002 Form S-3 and incorporated herein by reference.) | |
| 10.13 | Services Agreement dated November 30, 1997 by and between Yahoo! Korea Corporation and SOFTBANK Korea Corporation (Filed as Exhibit 10.42 to the December 23, 2002 Form S-3 and incorporated herein by reference.) | |
| 10.14 | Yahoo! Korea License Agreement dated November 30, 1997 by and between the Registrant, Yahoo! Korea Corporation, and Yahoo! Japan Corporation (Filed as Exhibit 10.41 to the December 23, 2002 Form S-3 and incorporated herein by reference.) | |
| 10.15 | Amendment to Second Amended and Restated Investor Rights Agreement dated July 7, 1998 among the Registrant, SOFTBANK Holdings Inc., Sequoia Capital VI and Sequoia Technology Partners VI (Filed as Exhibit 10.2 to the Registrant's Quarterly Report on Form 10-Q for the quarter ended September 30, 1998 and incorporated herein by reference.) | |
| 10.16 | Employment Letter, dated as of March 19, 2001, between the Registrant and Gregory Coleman (Filed as Exhibit 10.36 to the Registrant's Quarterly Report on Form 10-Q for the quarter ended March 31, 2001 and incorporated herein by reference.) | |
| 10.17 | Employment Letter, dated as of April 16, 2001, between the Registrant and Terry S. Semel (Filed as Exhibit 10.39 to the Registrant's Quarterly Report on Form 10-Q for the quarter ended June 30, 2001 [the June 30, 2001 10-Q] and incorporated herein by reference.) | |
| 10.18 | Stock Purchase Agreement, dated as of April 16, 2001, between the Registrant and Terry S. Semel (Filed as Exhibit 10.40 to the June 30, 2001 10-Q and incorporated herein by reference.) | |
| 10.19 | Consent and Resale Agreement dated as of March 25, 2002, between the Registrant and SOFTBANK Corp. (Filed as Exhibit 10.40 to the Registrant's Quarterly Report on Form 10-Q for the quarter ended March 31, 2002 and incorporated herein by reference.) | |
| 10.20 | Employment agreement between Registrant and Daniel Rosensweig dated April 23, 2002 (Filed as Exhibit 10.41 to the Registrant's Quarterly Report on Form 10-Q for the quarter ended June 30, 2002 [the June 30, 2002 10-Q] and incorporated herein by reference.) | |
| 10.21 | Recourse Promissory Note executed by Daniel Rosensweig for the benefit of Registrant (Filed as Exhibit 10.42 to the June 30, 2002 10-Q and incorporated herein by reference.) | |
| 10.22 | Yahoo! Key Executive New Hire Retention Plan (Filed as Exhibit 10.43 to the June 30, 2002 10-Q and incorporated herein by reference.) | |
| 10.23 | Key Executive New Hire Retention Agreement between the Registrant and Daniel Rosensweig (Filed as Exhibit 10.44 to the June 30, 2002 10-Q and incorporated herein by reference.) | |
| 10.24 | Stock Purchase Agreement, dated as of August 28, 2002 between the Registrant and SOFTBANK America, Inc. (Filed as Exhibit 10.45 to the Registrant's Quarterly Report on Form 10-Q for the quarter ended September 30, 2002 [the September 30, 2002 10-Q] and incorporated herein by reference.) | |
| 10.25 | Registration Rights Agreement, dated as of August 28, 2002 between Registrant and Acqua Wellington Private Placement Fund Ltd. and Acqua Wellington Opportunity I Limited. (Filed as Exhibit 10.46 to the September 30, 2002 10-Q and incorporated herein by reference.) | |
| 10.26 | Hosting Services Agreement, dated September 26, 2001, by and between the Registrant and eGroups K.K (Filed as Exhibit 10.44 to the December 23, 2003 Form S-3 and incorporated herein by reference.) | |
| 10.27 | Overture Search Services Agreement, dated May 1, 2002 by and between the Registrant and Overture Services, Inc. (Filed as Exhibit 10.27 to the Registrant's Annual Report on Form 10-K for the year ended December 31, 2002 and incorporated herein by reference.) | |
| 10.28 | First Addendum to Overture Search Services Agreement, dated October 1, 2002 by and between Registrant and Overture Services, Inc. (Filed as Exhibit 10.28 to the Registrant's Annual Report on Form 10-K for the year ended December 31, 2002 and incorporated herein by reference.) | |
| 10.29 | Second Addendum to Overture Search Services Agreement, dated January 13, 2003 by and between the Registrant and Overture Services, Inc. (Filed as Exhibit 10.29 to the Registrant's Annual Report on Form 10-K for the year ended December 31, 2002 and incorporated herein by reference.) | |
| 10.30 | HotJobs.com, Ltd. 1999 Stock Option/Stock Issuance Plan (Filed as Exhibit 4.1 to the March 5, 2002 Form S-8 and incorporated herein by reference.) | |
| 10.31 | HotJobs.com, Ltd. 1999 Stock Option/Stock Issuance Plan Amendment No. 1 (Filed as Exhibit 4.2 to the March 5, 2002 Form S-8 and incorporated herein by reference.) | |
| 10.32 | HotJobs.com, Ltd. 2000 Stock Option Plan (Filed as Exhibit 4.3 to the March 5, 2002 Form S-8 and incorporated herein by reference.) | |
| 10.33 | HotJobs.com, Ltd. Stock Award Plan (Filed as Exhibit 4.4 to the March 5, 2002 Form S-8 and incorporated herein by reference.) | |
| 10.34 | Resumix, Inc. 1998 Equity Incentive Plan (Filed as Exhibit 4.5 to the March 5, 2002 Form S-8 and incorporated herein by reference.) | |
| 10.35 | Resumix, Inc. 2000 Stock Option Plan (Filed as Exhibit 4.7 to the March 5, 2002 Form S-8 and incorporated herein by reference.) | |
| 10.36 | Employment Letter, dated as of March 20, 2003 between the Registrant and Gregory Coleman. (Filed as Exhibit 10.36 to the Registrant's Quarterly Report on Form 10-Q for the quarter ended March 31, 2003 and incorporated herein by reference.) | |
| 10.37 | Third Addendum to Overture Search Services Agreement, dated April 25, 2003 by and between the Registrant and Overture Services, Inc. (Filed as Exhibit 10.37 to the Registrant's Quarterly Report on Form 10-Q for the quarter ended June 30, 2003 and incorporated herein by reference.) | |
| 21.1* | List of Subsidiaries | |
| 23.1* | Consent of Independent Accountants | |
| 24.1 | Power of Attorney (see the signature page of this Annual Report on Form 10-K) | |
| 31* | Certificates of Chief Executive Officer and Chief Financial Officer pursuant to Securities Exchange Act Rules 13a-14(a) and 15d-14(a) as Adopted Pursuant to Section 302 of the Sarbanes-Oxley Act of 2002 dated February 27, 2004. | |
| 32* | Certificate of Chief Executive Officer and Chief Financial Officer pursuant to section 18 U.S.C. section 1350 dated February 27, 2004. |
