Document
UNITED STATES
SECURITIES AND EXCHANGE COMMISSION
WASHINGTON, D.C. 20549
FORM 10-K
ANNUAL REPORT PURSUANT TO SECTION 13 OR 15(d) OF
THE SECURITIES EXCHANGE ACT OF 1934
For the fiscal year ended December 31, 2017
Commission file number 1-9924
Citigroup Inc.
(Exact name of registrant as specified in its charter)
|
|
|
|
|
Delaware
(State or other jurisdiction of incorporation or organization)
|
|
52-1568099
(I.R.S. Employer Identification No.)
|
|
388 Greenwich Street, New York, NY
(Address of principal executive offices)
|
|
10013
(Zip code)
|
|
(212) 559-1000
(Registrant's telephone number, including area code)
|
Securities registered pursuant to Section 12(b) of the Act: See Exhibit 99.01
Securities registered pursuant to Section 12(g) of the Act: none
Indicate by check mark if the registrant is a well-known seasoned issuer, as defined in Rule 405 of the Securities Act. Yes o No x
Indicate by check mark if the registrant is not required to file reports pursuant to Section 13 or Section 15(d) of the Act. Yes o No x
Indicate by check mark whether the registrant (1) has filed all reports required to be filed by Section 13 or 15(d) of the Securities Exchange Act of 1934 during the preceding 12 months (or for such shorter period that the registrant was required to file such reports), and (2) has been subject to such filing requirements for the past 90 days. Yes x No o
Indicate by check mark whether the registrant has submitted electronically and posted on its corporate web site, if any, every Interactive Data File required to be submitted and posted pursuant to Rule 405 of Regulation S-T (§232.405 of this chapter) during the preceding 12 months (or for such shorter period that the registrant was required to submit and post such files). Yes x No o
Indicate by check mark if disclosure of delinquent filers pursuant to Item 405 of Regulation S-K (§229.405 of this chapter) is not contained herein, and will not be contained, to the best of registrant’s knowledge, in definitive proxy or information statements incorporated by reference in Part III of this Form 10-K or any amendment to this Form 10-K. x
Indicate by check mark whether the registrant is a large accelerated filer, an accelerated filer, a non-accelerated filer, or a smaller reporting company. See the definitions of "large accelerated filer," "accelerated filer" and "smaller reporting company" in Rule 12b-2 of the Exchange Act.
|
|
|
|
|
|
|
|
Large accelerated filer x
|
|
Accelerated filer o
|
|
Non-accelerated filer o
(Do not check if a smaller reporting company)
|
|
Smaller reporting company o
|
If an emerging growth company, indicate by check mark if the registrant has elected not to use the extended transition period for complying with any new or revised financial accounting standards provided pursuant to Section 13(a) of the Exchange Act. Yes o
Indicate by check mark whether the registrant is a shell company (as defined in Rule 12b-2 of the Exchange Act). Yes o No x
The aggregate market value of Citigroup Inc. common stock held by non-affiliates of Citigroup Inc. on June 30, 2017 was approximately $123.0 billion.
Number of shares of Citigroup Inc. common stock outstanding on January 31, 2018: 2,570,065,748
Documents Incorporated by Reference: Portions of the registrant’s proxy statement for the annual meeting of stockholders scheduled to be held on April 24, 2018, are incorporated by reference in this Form 10-K in response to Items 10, 11, 12, 13 and 14 of Part III.
Available on the web at www.citigroup.com
FORM 10-K CROSS-REFERENCE INDEX
|
|
|
|
|
|
|
|
|
Item Number |
Page |
|
|
|
|
Part I |
|
|
|
|
|
1. |
|
Business |
4–30, 121–125, |
|
|
|
128, 153, |
|
|
|
303–304 |
|
|
|
|
1A. |
|
Risk Factors |
56–64 |
|
|
|
|
1B. |
|
Unresolved Staff Comments |
Not Applicable |
|
|
|
|
2. |
|
Properties |
303–304 |
|
|
|
|
3. |
|
Legal Proceedings—See Note 27 to the Consolidated Financial Statements |
283–290 |
|
|
|
|
4. |
|
Mine Safety Disclosures |
Not Applicable |
|
|
|
|
Part II |
|
|
|
|
|
5. |
|
Market for Registrant’s Common Equity, Related Stockholder Matters and Issuer Purchases of Equity Securities |
136–137, 157–159, 305–306 |
|
|
|
|
6. |
|
Selected Financial Data |
10–11 |
|
|
|
|
7. |
|
Management’s Discussion and Analysis of Financial Condition and Results of Operations |
6–32, 66–120 |
|
|
|
|
7A. |
|
Quantitative and Qualitative Disclosures About Market Risk |
66–120, 154–156, 178–215, 222–275 |
|
|
|
|
8. |
|
Financial Statements and Supplementary Data |
132–302 |
|
|
|
|
9. |
|
Changes in and Disagreements with Accountants on Accounting and Financial Disclosure |
Not Applicable |
|
|
|
|
9A. |
|
Controls and Procedures |
126–127 |
|
|
|
|
9B. |
|
Other Information |
Not Applicable |
|
|
|
|
|
|
|
|
|
|
|
|
|
|
|
|
|
|
|
|
|
|
|
|
|
Part III |
|
|
|
|
|
10. |
|
Directors, Executive Officers and Corporate Governance |
307–309* |
|
|
|
|
11. |
|
Executive Compensation |
** |
|
|
|
|
12. |
|
Security Ownership of Certain Beneficial Owners and Management and Related Stockholder Matters |
*** |
|
|
|
|
13. |
|
Certain Relationships and Related Transactions and Director Independence |
**** |
|
|
|
|
14. |
|
Principal Accountant Fees and Services |
***** |
|
|
|
|
|
|
|
|
Part IV |
|
|
|
|
|
15. |
|
Exhibits and Financial Statement Schedules |
310–314 |
|
|
|
* |
For additional information regarding Citigroup’s Directors, see “Corporate Governance,” “Proposal 1: Election of Directors” and “Section 16(a) Beneficial Ownership Reporting Compliance” in the definitive Proxy Statement for Citigroup’s Annual Meeting of Stockholders scheduled to be held on April 24, 2018, to be filed with the SEC (the Proxy Statement), incorporated herein by reference. |
** |
See “Compensation Discussion and Analysis,” “The Personnel and Compensation Committee Report,” “2017 Summary Compensation Table and Compensation Information” and “CEO Pay Ratio”
in the Proxy Statement, incorporated herein by reference.
|
*** |
See “About the Annual Meeting,” “Stock Ownership” and “Equity Compensation Plan Information” in the Proxy Statement, incorporated herein by reference. |
**** |
See “Corporate Governance—Director Independence,” “—Certain Transactions and Relationships, Compensation Committee Interlocks and Insider Participation” and “—Indebtedness” in the Proxy Statement, incorporated herein by reference. |
***** |
See “Proposal 2: Ratification of Selection of Independent Registered Public Accounting Firm” in the Proxy Statement, incorporated herein by reference. |
CITIGROUP’S 2017 ANNUAL REPORT ON FORM 10-K
|
|
|
OVERVIEW |
|
|
MANAGEMENT'S DISCUSSION AND
ANALYSIS OF FINANCIAL CONDITION AND
RESULTS OF OPERATIONS
|
|
Executive Summary |
|
Impact of Tax Reform |
|
Summary of Selected Financial Data |
|
|
SEGMENT AND BUSINESS—INCOME (LOSS)
AND REVENUES
|
|
SEGMENT BALANCE SHEET |
|
Global Consumer Banking |
|
North America GCB |
|
Latin America GCB |
|
Asia GCB |
|
Institutional Clients Group |
|
Corporate/Other |
|
|
OFF-BALANCE SHEET
ARRANGEMENTS
|
|
CONTRACTUAL OBLIGATIONS |
|
CAPITAL RESOURCES |
|
RISK FACTORS |
|
Managing Global Risk Table of Contents |
|
MANAGING GLOBAL RISK |
|
|
SIGNIFICANT ACCOUNTING POLICIES AND
SIGNIFICANT ESTIMATES
|
|
|
FUTURE APPLICATION OF ACCOUNTING
STANDARDS
|
|
|
DISCLOSURE CONTROLS AND
PROCEDURES
|
|
|
MANAGEMENT’S ANNUAL REPORT ON
INTERNAL CONTROL OVER FINANCIAL
REPORTING
|
|
FORWARD-LOOKING STATEMENTS |
|
|
REPORT OF INDEPENDENT REGISTERED
PUBLIC ACCOUNTING FIRM—INTERNAL
CONTROL OVER FINANCIAL REPORTING
|
|
|
REPORT OF INDEPENDENT REGISTERED
PUBLIC ACCOUNTING FIRM—
CONSOLIDATED FINANCIAL STATEMENTS
|
|
|
FINANCIAL STATEMENTS AND NOTES
TABLE OF CONTENTS
|
|
CONSOLIDATED FINANCIAL STATEMENTS |
|
|
NOTES TO CONSOLIDATED FINANCIAL
STATEMENTS
|
|
FINANCIAL DATA SUPPLEMENT |
|
SUPERVISION, REGULATION AND OTHER |
|
CORPORATE INFORMATION |
|
Citigroup Executive Officers |
|
Citigroup Board of Directors |
|
OVERVIEW
Citigroup’s history dates back to the founding of the City
Bank of New York in 1812.
Citigroup is a global diversified financial services holding company whose businesses provide consumers, corporations, governments and institutions with a broad, yet focused, range of financial products and services, including consumer banking and credit, corporate and investment banking, securities brokerage, trade and securities services and wealth management. Citi has approximately 200 million customer accounts and does business in more than 160 countries and jurisdictions.
At December 31, 2017, Citi had approximately 209,000 full-time employees, compared to approximately 219,000 full-time employees at December 31, 2016.
Citigroup currently operates, for management reporting purposes, via two primary business segments: Global Consumer Banking and Institutional Clients Group, with the remaining operations in Corporate/Other. For a further description of the business segments and the products and services they provide, see “Citigroup Segments” below, “Management’s Discussion and Analysis of Financial Condition and Results of Operations” and Note 3 to the Consolidated Financial Statements.
Throughout this report, “Citigroup,” “Citi” and “the Company” refer to Citigroup Inc. and its consolidated subsidiaries.
Additional information about Citigroup is available on Citi’s website at www.citigroup.com. Citigroup’s recent annual reports on Form 10-K, quarterly reports on Form 10-Q and proxy statements, as well as other filings with the U.S. Securities and Exchange Commission (SEC), are available free of charge through Citi’s website by clicking on the “Investors” page and selecting “All SEC Filings.” The SEC’s website also contains current reports on Form 8-K and other information regarding Citi at www.sec.gov.
Certain reclassifications, including a realignment of certain businesses, have been made to the prior periods’ financial statements to conform to the current period’s presentation. For information on certain recent such reclassifications, see Note 3 to the Consolidated Financial Statements.
Please see “Risk Factors” below for a discussion of the most significant risks and uncertainties that could impact Citigroup’s businesses, financial condition and results of operations.
As described above, Citigroup is managed pursuant to two business segments: Global Consumer Banking and Institutional Clients Group, with the remaining operations in Corporate/Other.
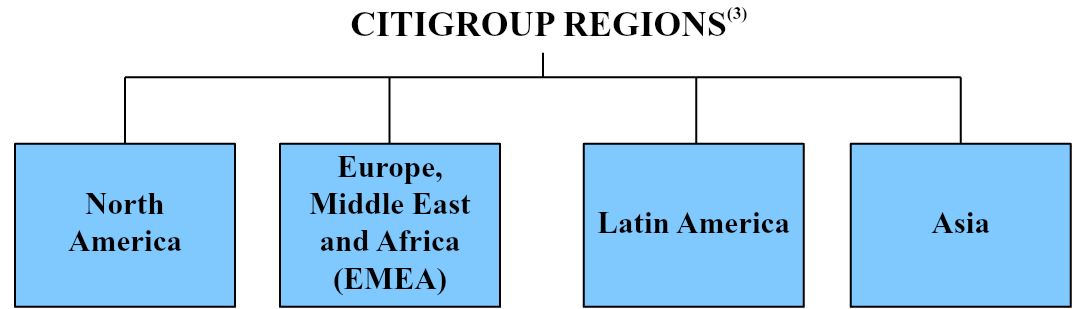
The following are the four regions in which Citigroup operates. The regional results are fully reflected in the segment results above.
|
|
(1) |
Latin America GCB consists of Citi’s consumer banking business in Mexico.
|
|
|
(2) |
Asia GCB includes the results of operations of GCB activities in certain EMEA countries for all periods presented.
|
|
|
(3) |
North America includes the U.S., Canada and Puerto Rico, Latin America includes Mexico and Asia includes Japan.
|
MANAGEMENT’S DISCUSSION AND ANALYSIS OF FINANCIAL CONDITION
AND RESULTS OF OPERATIONS
EXECUTIVE SUMMARY
As described further throughout this Executive Summary, Citi reported balanced operating results for full-year 2017, reflecting continued momentum across businesses and geographies, notably many of those where Citi has been making investments.
During 2017, Citi had revenue and loan growth and positive operating leverage as well as operating margin expansion in the Institutional Clients Group (ICG) and every region in Global Consumer Banking (GCB). Citi also continued to demonstrate strong expense discipline, resulting in an operating efficiency ratio of 58% in 2017. Results in 2017 also included an updated estimate for a one-time, non-cash charge of $22.6 billion related to the impact of the Tax Cuts and Jobs Act (Tax Reform), which impacted the tax line within Corporate/Other, as well as the tax lines in North America GCB and ICG (for additional information on this updated estimate, see “Impact of Tax Reform” below).
In 2017, Citi increased the amount of capital returned to shareholders, while each of its key regulatory capital metrics remained strong (see “Capital” below). During the year, Citi returned approximately $17.1 billion in the form of common stock repurchases and dividends and repurchased approximately 214 million common shares as outstanding common shares declined 7% from the prior year.
Going into 2018, while economic sentiment has improved and the macroeconomic environment remains largely positive, there continue to be various economic, political and other risks and uncertainties that could impact Citi’s businesses and future results. For a more detailed discussion of the risks and uncertainties that could impact Citi’s businesses, results of operations and financial condition during 2018, see each respective business’s results of operations, “Risk Factors” and “Managing Global Risk” below. Despite these risks and uncertainties, Citi intends to continue to build on the progress made during 2017 with a focus on further optimizing its performance to benefit shareholders.
2017 Summary Results
Citigroup
Citigroup reported a net loss of $6.8 billion, or $2.98 per share, compared to net income of $14.9 billion, or $4.72 per share, in the prior year. Excluding the impact of Tax Reform, Citigroup net income of $15.8 billion increased 6% compared to the prior year, reflecting higher revenues, partially offset by higher cost of credit, while earnings per share increased 13%, including the impact of a 7% reduction in average shares outstanding. (Citi’s results of operations excluding the impact of Tax Reform are non-GAAP financial measures. Citi believes the presentation of its results of operations excluding the impact of Tax Reform provides a meaningful depiction for investors of the underlying fundamentals of its businesses.) For additional information regarding the impact of Tax Reform, see “Impact of Tax Reform,” “Risk Factors,”
“Significant Accounting Policies and Significant Estimates—Income Taxes” below and Notes 1 and 9 to the Consolidated Financial Statements.
Citigroup revenues of $71.4 billion in 2017 increased 2%, driven by 6% aggregate growth in ICG and GCB, partially offset by a 40% decrease in Corporate/Other, primarily due to the continued wind-down of legacy assets.
Citigroup’s end-of-period loans increased 7% to $667 billion versus the prior-year period. Excluding the impact of foreign currency translation in U.S. dollars for reporting purposes (FX translation), Citigroup’s end-of-period loans grew 5%, as 9% growth in ICG and 4% growth in GCB was partially offset by the continued wind-down of legacy assets in Corporate/Other (Citi’s results of operations excluding the impact of FX translation are non-GAAP financial measures. Citi believes the presentation of its results of operations excluding the impact of FX translation provides a meaningful depiction for investors of the underlying fundamentals of its businesses). Citigroup’s end-of-period deposits increased 3% to $960 billion versus the prior year. Excluding the impact of FX translation, Citigroup’s deposits were up 1%, as a 2% increase in ICG deposits was partially offset by a decline in Corporate/ Other deposits, and GCB deposits were largely unchanged.
Expenses
Citigroup operating expenses were largely unchanged versus the prior year, as the impact of higher volume-related expenses and ongoing investments were offset by efficiency savings and the wind-down of legacy assets. Year-over-year, ICG operating expenses were up 3% and GCB operating expenses increased 2%, while Corporate/Other operating expenses declined 24%, all versus the prior year.
Cost of Credit
Citi’s total provisions for credit losses and for benefits and claims of $7.5 billion increased 7% from the prior year. The increase was mostly driven by a $515 million increase in net credit losses, primarily in North America GCB, partially offset by a lower provision for benefits and claims due to continued legacy asset divestitures within Corporate/Other. The net loan loss reserve build of $266 million compared to a net loan loss reserve build of $217 million in the prior year. The increase was mostly due to volume growth and seasoning, as well as the impact of loan loss reserve builds related to forward-looking net credit loss expectations, all in the North America cards portfolios, partially offset by a higher net reserve release in ICG.
Net credit losses of $7.1 billion increased 8% versus the prior year. Consumer net credit losses increased 11% to
$6.7 billion, mostly reflecting volume growth and seasoning in the North America cards portfolios and the impact of acquiring the Costco portfolio. The increase in consumer net credit losses was partially offset by the continued wind-down of legacy assets in Corporate/Other. Corporate net credit losses
decreased 26% to $379 million, largely driven by improvement in the energy sector.
For additional information on Citi’s consumer and corporate credit costs and allowance for loan losses, see each respective business’s results of operations and “Credit Risk” below.
Capital
Citigroup’s Common Equity Tier 1 Capital and Tier 1 Capital ratios, on a fully implemented basis, were 12.4% and 14.1% as of December 31, 2017 (based on the Basel III Standardized Approach for determining risk-weighted assets), respectively, compared to 12.6% and 14.2% as of December 31, 2016 (based on the Basel III Advanced Approaches for determining risk-weighted assets). The decline in regulatory capital reflected the return of capital to common shareholders and an approximately $6 billion reduction in Common Equity Tier 1 (CET1) Capital due to the impact of Tax Reform, partially offset by earnings growth. Citigroup’s Supplementary Leverage ratio as of December 31, 2017, on a fully implemented basis, was 6.7%, compared to 7.2% as of December 31, 2016. For additional information on Citi’s capital ratios and related components, including the impact of Tax Reform on its capital ratios, see “Capital Resources” below.
Global Consumer Banking
GCB net income decreased 21%. Excluding the impact of Tax Reform, GCB net income decreased 6%, as higher revenues were more than offset by higher expenses and higher cost of credit. Operating expenses were $17.8 billion, up 2%, as higher volume-related expenses and continued investments were partially offset by efficiency savings.
GCB revenues of $32.7 billion increased 4% versus the prior year, driven by growth across all regions. North America GCB revenues increased 3% to $20.3 billion, driven by higher revenues across all businesses. Citi-branded cards revenues of $8.6 billion were up 5% versus the prior year, mostly reflecting the addition of the Costco portfolio as well as modest growth in interest-earning balances, partially offset by the continued run-off of non-core portfolios as well as a higher cost to fund growth in transactor and promotional balances, given higher interest rates. Citi retail services revenues of $6.4 billion increased 1% versus the prior year, as continued loan growth was partially offset by the impact of the renewal and extension of certain partnerships, as well as the absence of gains on sales of two cards portfolios in 2016. Retail banking revenues increased 1% from the prior year to $5.3 billion. Excluding mortgage revenues, retail banking revenues of $4.5 billion were up 9% from the prior year, driven by continued growth in loans and assets under management, as well as a benefit from higher interest rates.
North America GCB average deposits of $184 billion increased 1% year-over-year, average retail loans of $56 billion grew 3% and assets under management of $60 billion grew 14%. Average Citi-branded card loans of $85 billion increased 15%, while Citi-branded card purchase sales of $320 billion increased 28% versus the prior year. Average Citi retail services loans of $46 billion increased 4% versus the prior
year, while retail services purchase sales of $81 billion were up 2%. For additional information on the results of operations of North America GCB for 2017, see “Global Consumer Banking—North America GCB” below.
International GCB revenues (consisting of Latin America GCB and Asia GCB (which includes the results of operations in certain EMEA countries)) increased 6% versus the prior year to $12.4 billion. Excluding the impact of FX translation, international GCB revenues increased 5% versus the prior year. Latin America GCB revenues increased 6% versus the prior year, driven by growth in loans and deposits, as well as improved deposit spreads. Asia GCB revenues increased 5% (4% excluding modest gains on the sales of merchant acquiring businesses in the second and fourth quarters of 2017) versus the prior year, primarily reflecting an increase in cards revenues and wealth management revenues, partially offset by lower retail lending revenues. For additional information on the results of operations of Latin America GCB and Asia GCB for 2017, including the impact of FX translation, see “Global Consumer Banking—Latin America GCB” and “Global Consumer Banking—Asia GCB” below.
Year-over-year, international GCB average deposits of $122 billion increased 5%, average retail loans of $87 billion were largely unchanged, assets under management of $101 billion increased 14%, average card loans of $24 billion increased 5% and card purchase sales of $98 billion increased 7%, all excluding the impact of FX translation.
Institutional Clients Group
ICG net income decreased 5%. Excluding the impact of Tax Reform, ICG net income increased 16%, driven by higher revenues and a small benefit to cost of credit (compared to a $486 million cost of credit in the prior year), partially offset by higher operating expenses. ICG operating expenses increased 3% to $19.6 billion, as higher compensation, investments and volume-related expenses were partially offset by efficiency savings.
ICG revenues were $35.7 billion in 2017, up 7% from the prior year, primarily driven by a 16% increase in Banking revenues. Markets and securities services were largely unchanged versus the prior year. The increase in Banking revenues included the impact of $133 million of losses on loan hedges within corporate lending, compared to losses of $594 million in the prior year.
Banking revenues of $18.7 billion (excluding the impact of losses on loan hedges within corporate lending) increased 12%, driven by solid growth across all products. Investment banking revenues of $5.2 billion increased 20% versus the prior year, reflecting wallet share gains across all products. Advisory revenues increased 11% to $1.1 billion, equity underwriting revenues increased 68% to $1.1 billion and debt underwriting revenues increased 13% to $3.0 billion, all versus the prior year.
Private bank revenues increased 14% from the prior year, driven by growth in clients, loans, investments and deposits, as well as improved spreads. Corporate lending revenues increased 59% to $1.8 billion. Excluding the impact of losses on loan hedges, corporate lending revenues increased 12% versus the prior year, primarily driven by lower hedging costs,
as well as the prior-year adjustment to the residual value of a lease financing. Treasury and trade solutions revenues of $8.5 billion increased 7% versus the prior year, reflecting volume growth and improved spreads, with balanced growth across net interest and fee income.
Markets and securities services revenues of $17.1 billion were largely unchanged from the prior year, as a decline in fixed income markets and equity markets revenues was offset by an increase in securities services revenues as well as a $580 million gain on the sale of a fixed income analytics business. Fixed income markets revenues of $12.1 billion decreased 6% from the prior year, reflecting low volatility, as well as the comparison to higher revenues from a more robust trading environment in the prior year following the vote in the U.K. in favor of its withdrawal from the European Union, as well as the U.S. election. Equity markets revenues of $2.7 billion decreased 2% from the prior year, driven by an episodic loss in derivatives of roughly $130 million related to a single client event. Excluding this item, equity markets revenues increased 2% from the prior year, driven by growth in client balances and higher investor client revenue. Securities services revenues of $2.3 billion increased 8%, driven by growth in client volumes and higher interest revenue. For additional information on the results of operations of ICG for 2017, see “Institutional Clients Group” below.
Corporate/Other
Corporate/Other net loss was $19.7 billion in 2017, compared to net income of $498 million in the prior year. Excluding the impact of Tax Reform, Corporate/Other net income declined 69% to $153 million, reflecting lower revenues, partially offset by lower operating expenses and lower cost of credit. Operating expenses of $3.8 billion declined 24% from the prior-year period, reflecting the wind-down of legacy assets and lower legal expenses.
Corporate/Other revenues were $3.1 billion, down 40% from the prior year, primarily reflecting the wind-down of legacy assets as well as the absence of gains related to debt buybacks in 2016.
Corporate/Other end-of-period assets of $77 billion decreased 25% from the prior year, reflecting the continued wind-down of legacy assets as well as the impact of Tax Reform, which reduced assets by approximately $20 billion. For additional information on the results of operations of Corporate/Other for 2017, see “Corporate/Other” below.
Impact of Tax Reform
Citi’s full-year 2017 results included the updated estimate for a one-time, non-cash charge of $22.6 billion, recorded within Corporate/Other, North America GCB and ICG related to the enactment of Tax Reform, which was signed into law on December 22, 2017. This updated estimate resulted in a downward adjustment to fourth-quarter and full-year 2017 financial results, as well as changes in the segments where the impact was recorded (previously, the entire charge was recorded in Corporate/Other), from those reported on January 16, 2018, by an aggregate of $594 million due to refinements of original estimates. The approximate $6 billion reduction in CET1 Capital due to the impact of Tax Reform was unchanged.
This charge was composed of a $12.4 billion remeasurement of Citi’s deferred tax assets (DTAs) due to the reduction to the U.S. corporate tax rate and the change to a quasi-territorial tax system (see “Significant Accounting Policies and Estimates—Income Taxes” below), a $7.9 billion valuation allowance against Citi’s foreign tax credit (FTC) carry-forwards and its U.S. residual DTAs related to its non-U.S. branches, and a $2.3 billion reduction in Citi’s FTC carry-forwards related to the deemed repatriation of undistributed earnings of non-U.S. subsidiaries.
The financial results in the table below disclose the as-reported GAAP results for 2017 and 2016, the impact of Tax Reform and the 2017 adjusted results excluding the impact of Tax Reform. The charge related to Tax Reform is reflected in Citi’s results throughout this Annual Report on Form 10-K, unless otherwise noted.
The final impact of Tax Reform may differ from the estimate due to, among other things, changes in assumptions
made by Citigroup and additional guidance that may be issued by the U.S. Department of the Treasury. For more information on possible changes to the estimated impact related to Tax Reform, see “Risk Factors—Strategic Risks” below and Notes 1 and 9 to the Consolidated Financial Statements.
|
|
|
|
|
|
|
|
|
|
|
|
|
|
|
|
|
|
|
|
|
In millions of dollars, except per share amounts, and as otherwise noted |
2017
as reported
|
Impact of
Tax Reform
|
|
2017
adjusted results(1)
|
2016
as reported
|
2017 Ex-Tax Reform increase/(decrease)
vs. 2016
|
|
$ Change |
% Change |
|
Net income (loss) |
$ |
(6,798 |
) |
$ |
(22,594 |
) |
|
$ |
15,796 |
|
$ |
14,912 |
|
$ |
884 |
|
6 |
% |
|
Diluted earnings per share: |
|
|
|
|
|
|
|
|
|
Income (loss) from continuing operations |
(2.94 |
) |
(8.31 |
) |
|
5.37 |
|
4.74 |
|
0.63 |
|
13 |
|
|
Net income (loss) |
(2.98 |
) |
(8.31 |
) |
|
5.33 |
|
4.72 |
|
0.61 |
|
13 |
|
|
Effective tax rate |
129.1 |
% |
(9,930 |
) |
bps |
29.8 |
% |
30.0 |
% |
|
(20 |
) |
bps |
Global Consumer Banking—Net income
|
$ |
3,884 |
|
$ |
(750 |
) |
|
$ |
4,634 |
|
$ |
4,947 |
|
$ |
(313 |
) |
(6 |
)% |
|
North America GCB—Net income
|
2,044 |
|
(750 |
) |
|
2,794 |
|
3,240 |
|
(446 |
) |
(14 |
) |
|
Institutional Clients Group—Net income
|
9,009 |
|
(2,000 |
) |
|
11,009 |
|
9,467 |
|
1,542 |
|
16 |
|
|
Corporate/Other—Net income (loss)
|
(19,691 |
) |
(19,844 |
) |
|
153 |
|
498 |
|
(345 |
) |
(69 |
) |
|
|
|
|
|
|
|
|
|
|
Performance and other metrics: |
|
|
|
|
|
|
|
|
Return on average assets |
(0.36 |
)% |
(120 |
) |
bps |
0.84 |
% |
0.82 |
% |
|
2 |
|
bps |
Return on average common stockholders’ equity |
(3.9 |
) |
(1,090 |
) |
|
7.0 |
|
6.6 |
|
|
40 |
|
|
Return on average total stockholders’ equity |
(3.0 |
) |
(1,000 |
) |
|
7.0 |
|
6.5 |
|
|
50 |
|
|
Return on average tangible common equity |
(4.6 |
) |
(1,270 |
) |
|
8.1 |
|
7.6 |
|
|
50 |
|
|
Dividend payout ratio |
(32.2 |
) |
(5,020 |
) |
|
18.0 |
|
8.9 |
|
|
910 |
|
|
Total payout ratio |
(213.9 |
) |
(33,140 |
) |
|
117.5 |
|
77.1 |
|
|
404 |
|
|
(1) Excludes the impact of Tax Reform.
RESULTS OF OPERATIONS
SUMMARY OF SELECTED FINANCIAL DATA—PAGE 1
Citigroup Inc. and Consolidated Subsidiaries
|
|
|
|
|
|
|
|
|
|
|
|
|
|
|
|
|
In millions of dollars, except per-share amounts and ratios |
2017 |
2016 |
2015 |
2014 |
2013 |
Net interest revenue |
$ |
44,687 |
|
$ |
45,104 |
|
$ |
46,630 |
|
$ |
47,993 |
|
$ |
46,793 |
|
Non-interest revenue |
26,762 |
|
24,771 |
|
29,724 |
|
29,226 |
|
29,931 |
|
Revenues, net of interest expense |
$ |
71,449 |
|
$ |
69,875 |
|
$ |
76,354 |
|
$ |
77,219 |
|
$ |
76,724 |
|
Operating expenses |
41,237 |
|
41,416 |
|
43,615 |
|
55,051 |
|
48,408 |
|
Provisions for credit losses and for benefits and claims |
7,451 |
|
6,982 |
|
7,913 |
|
7,467 |
|
8,514 |
|
Income from continuing operations before income taxes |
$ |
22,761 |
|
$ |
21,477 |
|
$ |
24,826 |
|
$ |
14,701 |
|
$ |
19,802 |
|
Income taxes(1)
|
29,388 |
|
6,444 |
|
7,440 |
|
7,197 |
|
6,186 |
|
Income (loss) from continuing operations |
$ |
(6,627 |
) |
$ |
15,033 |
|
$ |
17,386 |
|
$ |
7,504 |
|
$ |
13,616 |
|
Income (loss) from discontinued operations, net of taxes(2)
|
(111 |
) |
(58 |
) |
(54 |
) |
(2 |
) |
270 |
|
Net income (loss) before attribution of noncontrolling interests |
$ |
(6,738 |
) |
$ |
14,975 |
|
$ |
17,332 |
|
$ |
7,502 |
|
$ |
13,886 |
|
Net income attributable to noncontrolling interests
|
60 |
|
63 |
|
90 |
|
192 |
|
227 |
|
Citigroup’s net income (loss)(1)
|
$ |
(6,798 |
) |
$ |
14,912 |
|
$ |
17,242 |
|
$ |
7,310 |
|
$ |
13,659 |
|
Less: |
|
|
|
|
|
Preferred dividends—Basic |
$ |
1,213 |
|
$ |
1,077 |
|
$ |
769 |
|
$ |
511 |
|
$ |
194 |
|
Dividends and undistributed earnings allocated to employee restricted and deferred shares that contain nonforfeitable rights to dividends, applicable to basic EPS |
37 |
|
195 |
|
224 |
|
111 |
|
263 |
|
Income (loss) allocated to unrestricted common shareholders for basic EPS |
$ |
(8,048 |
) |
$ |
13,640 |
|
$ |
16,249 |
|
$ |
6,688 |
|
$ |
13,202 |
|
Add: Other adjustments to income |
— |
|
— |
|
— |
|
1 |
|
1 |
|
Income (loss) allocated to unrestricted common shareholders for diluted EPS |
$ |
(8,048 |
) |
$ |
13,640 |
|
$ |
16,249 |
|
$ |
6,689 |
|
$ |
13,203 |
|
Earnings per share |
|
|
|
|
|
Basic |
|
|
|
|
|
Income (loss) from continuing operations |
$ |
(2.94 |
) |
$ |
4.74 |
|
$ |
5.43 |
|
$ |
2.21 |
|
$ |
4.26 |
|
Net income (loss) |
(2.98 |
) |
4.72 |
|
5.41 |
|
2.21 |
|
4.35 |
|
Diluted |
|
|
|
|
|
Income (loss) from continuing operations |
$ |
(2.94 |
) |
$ |
4.74 |
|
$ |
5.42 |
|
$ |
2.20 |
|
$ |
4.25 |
|
Net income (loss)
|
(2.98 |
) |
4.72 |
|
5.40 |
|
2.20 |
|
4.34 |
|
Dividends declared per common share |
0.96 |
|
0.42 |
|
0.16 |
|
0.04 |
|
0.04 |
|
Table continues on the next page, including footnotes.
SUMMARY OF SELECTED FINANCIAL DATA—PAGE 2
|
|
|
|
|
|
|
|
|
|
|
|
|
|
|
|
|
|
Citigroup Inc. and Consolidated Subsidiaries |
|
In millions of dollars, except per-share amounts, ratios and direct staff |
2017 |
2016 |
2015 |
2014 |
2013 |
At December 31: |
|
|
|
|
|
Total assets |
$ |
1,842,465 |
|
$ |
1,792,077 |
|
$ |
1,731,210 |
|
$ |
1,842,181 |
|
$ |
1,880,035 |
|
Total deposits |
959,822 |
|
929,406 |
|
907,887 |
|
899,332 |
|
968,273 |
|
Long-term debt |
236,709 |
|
206,178 |
|
201,275 |
|
223,080 |
|
221,116 |
|
Citigroup common stockholders’ equity |
181,487 |
|
205,867 |
|
205,139 |
|
199,717 |
|
197,254 |
|
Total Citigroup stockholders’ equity |
200,740 |
|
225,120 |
|
221,857 |
|
210,185 |
|
203,992 |
|
Direct staff (in thousands)
|
209 |
|
219 |
|
231 |
|
241 |
|
251 |
|
Performance metrics |
|
|
|
|
|
Return on average assets |
(0.36 |
)% |
0.82 |
% |
0.95 |
% |
0.39 |
% |
0.73 |
% |
Return on average common stockholders’ equity(3)
|
(3.9 |
) |
6.6 |
|
8.1 |
|
3.4 |
|
7.0 |
|
Return on average total stockholders’ equity(3)
|
(3.0 |
) |
6.5 |
|
7.9 |
|
3.5 |
|
6.9 |
|
Efficiency ratio (total operating expenses/total revenues) |
58 |
|
59 |
|
57 |
|
71 |
|
63 |
|
Basel III ratios—full implementation |
|
|
|
|
|
Common Equity Tier 1 Capital(4)
|
12.36 |
% |
12.57 |
% |
12.07 |
% |
10.57 |
% |
10.57 |
% |
Tier 1 Capital(4)
|
14.06 |
|
14.24 |
|
13.49 |
|
11.45 |
|
11.23 |
|
Total Capital(4)
|
16.30 |
|
16.24 |
|
15.30 |
|
12.80 |
|
12.64 |
|
Supplementary Leverage ratio(5)
|
6.68 |
|
7.22 |
|
7.08 |
|
5.94 |
|
5.42 |
|
Citigroup common stockholders’ equity to assets |
9.85 |
% |
11.49 |
% |
11.85 |
% |
10.84 |
% |
10.49 |
% |
Total Citigroup stockholders’ equity to assets |
10.90 |
|
12.56 |
|
12.82 |
|
11.41 |
|
10.85 |
|
Dividend payout ratio(6)
|
NM |
8.9 |
|
3.0 |
|
1.8 |
|
0.9 |
|
Total payout ratio(7)
|
NM |
77.1 |
|
36.0 |
|
19.9 |
|
7.1 |
|
Book value per common share |
$ |
70.62 |
|
$ |
74.26 |
|
$ |
69.46 |
|
$ |
66.05 |
|
$ |
65.12 |
|
Tangible book value (TBV) per share(8)
|
60.16 |
|
64.57 |
|
60.61 |
|
56.71 |
|
55.19 |
|
Ratio of earnings to fixed charges and preferred stock dividends |
2.26x |
2.54x |
2.89x |
|
2.00x |
|
2.18x |
|
|
|
(1) |
2017 includes the impact of Tax Reform. See “Impact of Tax Reform” above. |
|
|
(2) |
See Note 2 to the Consolidated Financial Statements for additional information on Citi’s discontinued operations.
|
|
|
(3) |
The return on average common stockholders’ equity is calculated using net income less preferred stock dividends divided by average common stockholders’ equity. The return on average total Citigroup stockholders’ equity is calculated using net income divided by average Citigroup stockholders’ equity. |
|
|
(4) |
Citi’s regulatory capital ratios reflect full implementation of the U.S. Basel III rules. As of December 31, 2017, Citi’s reportable Common Equity Tier 1 Capital and Tier 1 Capital ratios were the lower derived under the Basel III Standardized Approach, whereas the reportable Total Capital ratio was the lower derived under the Basel III Advanced Approaches framework. For all prior periods presented, Citi’s Common Equity Tier 1 Capital, Tier 1 Capital, and Total Capital ratios were the lower derived under the Basel III Advanced Approaches framework.
|
|
|
(5) |
Citi’s Supplementary Leverage ratio reflects full implementation of the U.S. Basel III rules. |
(6) Dividends declared per common share as a percentage of net income per diluted share.
|
|
(7) |
Total common dividends declared plus common stock repurchases as a percentage of net income available to common shareholders. See “Consolidated Statement of Changes in Stockholders’ Equity,” Note 10 to the Consolidated Financial Statements and “Equity Security Repurchases” below for the component details. |
(8) For information on TBV, see “Capital Resources—Tangible Common Equity, Tangible Book Value Per Share, Book Value Per Share and Returns on Equity” below.
NM Not meaningful
SEGMENT AND BUSINESS—INCOME (LOSS) AND REVENUES
CITIGROUP INCOME
|
|
|
|
|
|
|
|
|
|
|
|
|
|
|
In millions of dollars |
2017(1)
|
2016 |
2015 |
% Change
2017 vs. 2016 |
% Change
2016 vs. 2015 |
Income (loss) from continuing operations |
|
|
|
|
|
Global Consumer Banking |
|
|
|
|
|
North America |
$ |
2,043 |
|
$ |
3,238 |
|
$ |
4,188 |
|
(37 |
)% |
(23 |
)% |
Latin America |
590 |
|
633 |
|
826 |
|
(7 |
) |
(23 |
) |
Asia(2)
|
1,260 |
|
1,083 |
|
1,200 |
|
16 |
|
(10 |
) |
Total |
$ |
3,893 |
|
$ |
4,954 |
|
$ |
6,214 |
|
(21 |
)% |
(20 |
)% |
Institutional Clients Group |
|
|
|
|
|
North America |
$ |
2,449 |
|
$ |
3,495 |
|
$ |
3,316 |
|
(30 |
)% |
5 |
% |
EMEA |
2,804 |
|
2,365 |
|
2,230 |
|
19 |
|
6 |
|
Latin America |
1,513 |
|
1,454 |
|
1,351 |
|
4 |
|
8 |
|
Asia |
2,300 |
|
2,211 |
|
2,213 |
|
4 |
|
— |
|
Total |
$ |
9,066 |
|
$ |
9,525 |
|
$ |
9,110 |
|
(5 |
)% |
5 |
% |
Corporate/Other |
$ |
(19,586 |
) |
$ |
554 |
|
$ |
2,062 |
|
NM |
|
(73 |
)% |
Income (loss) from continuing operations |
$ |
(6,627 |
) |
$ |
15,033 |
|
$ |
17,386 |
|
NM |
|
(14 |
)% |
Discontinued operations |
$ |
(111 |
) |
$ |
(58 |
) |
$ |
(54 |
) |
(91 |
)% |
(7 |
)% |
Net income (loss) attributable to noncontrolling interests |
60 |
|
63 |
|
90 |
|
(5 |
) |
(30 |
) |
Citigroup’s net income (loss) |
$ |
(6,798 |
) |
$ |
14,912 |
|
$ |
17,242 |
|
NM |
|
(14 |
)% |
|
|
(1) |
2017 includes the impact of Tax Reform. See “Impact of Tax Reform” above. |
(2) Asia GCB includes the results of operations of GCB activities in certain EMEA countries for all periods presented.
NM Not meaningful
CITIGROUP REVENUES
|
|
|
|
|
|
|
|
|
|
|
|
|
|
|
In millions of dollars |
2017 |
2016 |
2015 |
% Change
2017 vs. 2016 |
% Change
2016 vs. 2015 |
Global Consumer Banking |
|
|
|
|
|
North America |
$ |
20,262 |
|
$ |
19,759 |
|
$ |
19,515 |
|
3 |
% |
1 |
% |
Latin America |
5,152 |
|
4,922 |
|
5,722 |
|
5 |
|
(14 |
) |
Asia(1)
|
7,283 |
|
6,838 |
|
7,014 |
|
7 |
|
(3 |
) |
Total |
$ |
32,697 |
|
$ |
31,519 |
|
$ |
32,251 |
|
4 |
% |
(2 |
)% |
Institutional Clients Group |
|
|
|
|
|
North America |
$ |
13,636 |
|
$ |
12,513 |
|
$ |
12,698 |
|
9 |
% |
(1 |
)% |
EMEA |
10,692 |
|
9,855 |
|
9,788 |
|
8 |
|
1 |
|
Latin America |
4,216 |
|
3,977 |
|
3,944 |
|
6 |
|
1 |
|
Asia |
7,123 |
|
6,882 |
|
6,902 |
|
4 |
|
— |
|
Total |
$ |
35,667 |
|
$ |
33,227 |
|
$ |
33,332 |
|
7 |
% |
— |
% |
Corporate/Other |
$ |
3,085 |
|
$ |
5,129 |
|
$ |
10,771 |
|
(40 |
)% |
(52 |
)% |
Total Citigroup net revenues |
$ |
71,449 |
|
$ |
69,875 |
|
$ |
76,354 |
|
2 |
% |
(8 |
)% |
|
|
(1) |
Asia GCB includes the results of operations of GCB activities in certain EMEA countries for all periods presented.
|
SEGMENT BALANCE SHEET(1)
|
|
|
|
|
|
|
|
|
|
|
|
|
|
|
|
|
In millions of dollars |
Global
Consumer
Banking
|
Institutional
Clients
Group
|
Corporate/Other
and
consolidating
eliminations(2)
|
Citigroup
parent
company-
issued
long-term
debt and
stockholders’
equity(3)
|
Total
Citigroup
consolidated
|
Assets |
|
|
|
|
|
Cash and deposits with banks |
$ |
11,446 |
|
$ |
65,916 |
|
$ |
103,154 |
|
$ |
— |
|
$ |
180,516 |
|
Federal funds sold and securities borrowed or purchased under agreements to resell |
242 |
|
231,806 |
|
430 |
|
— |
|
232,478 |
|
Trading account assets |
5,885 |
|
243,916 |
|
1,755 |
|
— |
|
251,556 |
|
Investments |
10,786 |
|
109,231 |
|
232,273 |
|
— |
|
352,290 |
|
Loans, net of unearned income and |
|
|
|
|
|
allowance for loan losses |
301,729 |
|
330,826 |
|
22,124 |
|
— |
|
654,679 |
|
Other assets |
38,037 |
|
96,266 |
|
36,643 |
|
— |
|
170,946 |
|
Liquidity assets(4)
|
60,755 |
|
258,342 |
|
(319,097 |
) |
— |
|
— |
|
Total assets |
$ |
428,880 |
|
$ |
1,336,303 |
|
$ |
77,282 |
|
$ |
— |
|
$ |
1,842,465 |
|
Liabilities and equity |
|
|
|
|
|
Total deposits |
$ |
307,244 |
|
$ |
639,487 |
|
$ |
13,091 |
|
$ |
— |
|
$ |
959,822 |
|
Federal funds purchased and securities loaned or sold under agreements to repurchase |
4,705 |
|
151,563 |
|
9 |
|
— |
|
156,277 |
|
Trading account liabilities |
20 |
|
123,933 |
|
94 |
|
— |
|
124,047 |
|
Short-term borrowings |
576 |
|
20,075 |
|
23,801 |
|
— |
|
44,452 |
|
Long-term debt(3)
|
2,143 |
|
35,297 |
|
47,106 |
|
152,163 |
|
236,709 |
|
Other liabilities |
19,745 |
|
80,383 |
|
19,358 |
|
— |
|
119,486 |
|
Net inter-segment funding (lending)(3)
|
94,447 |
|
285,565 |
|
(27,109 |
) |
(352,903 |
) |
— |
|
Total liabilities |
$ |
428,880 |
|
$ |
1,336,303 |
|
$ |
76,350 |
|
$ |
(200,740 |
) |
$ |
1,640,793 |
|
Total equity(5)
|
— |
|
— |
|
932 |
|
200,740 |
|
201,672 |
|
Total liabilities and equity |
$ |
428,880 |
|
$ |
1,336,303 |
|
$ |
77,282 |
|
$ |
— |
|
$ |
1,842,465 |
|
|
|
(1) |
The supplemental information presented in the table above reflects Citigroup’s consolidated GAAP balance sheet by reporting segment as of December 31, 2017. The respective segment information depicts the assets and liabilities managed by each segment as of such date.
|
|
|
(2) |
Consolidating eliminations for total Citigroup and Citigroup parent company assets and liabilities are recorded within Corporate/Other. The impact of Tax Reform is included in North America GCB, ICG and Corporate/Other.
|
|
|
(3) |
The total stockholders’ equity and the majority of long-term debt of Citigroup reside in the Citigroup parent company Consolidated Balance Sheet. Citigroup allocates stockholders’ equity and long-term debt to its businesses through inter-segment allocations as shown above. |
|
|
(4) |
Represents the attribution of Citigroup’s liquidity assets (primarily consisting of cash and available-for-sale securities) to the various businesses based on Liquidity Coverage Ratio (LCR) assumptions. |
|
|
(5) |
Corporate/Other equity represents noncontrolling interests.
|
This page intentionally left blank.
GLOBAL CONSUMER BANKING
Global Consumer Banking (GCB) consists of consumer banking businesses in North America, Latin America (consisting of Citi’s consumer banking business in Mexico) and Asia. GCB provides traditional banking services to retail customers through retail banking, including commercial banking, and Citi-branded cards and Citi retail services (for additional information on these businesses, see “Citigroup Segments” above). GCB is focused on its priority markets in the U.S., Mexico and Asia with 2,451 branches in 19 countries and jurisdictions as of December 31, 2017. At December 31, 2017, GCB had approximately $429 billion in assets and $307 billion in deposits.
GCB’s overall strategy is to leverage Citi’s global footprint and be the pre-eminent bank for the emerging affluent and affluent consumers in large urban centers. In credit cards and in certain retail markets, Citi serves customers in a somewhat broader set of segments and geographies.
|
|
|
|
|
|
|
|
|
|
|
|
|
|
|
In millions of dollars except as otherwise noted |
2017 |
2016 |
2015 |
% Change
2017 vs. 2016 |
% Change
2016 vs. 2015 |
Net interest revenue |
$ |
27,187 |
|
$ |
26,025 |
|
$ |
25,752 |
|
4 |
% |
1 |
% |
Non-interest revenue |
5,510 |
|
5,494 |
|
6,499 |
|
— |
|
(15 |
) |
Total revenues, net of interest expense |
$ |
32,697 |
|
$ |
31,519 |
|
$ |
32,251 |
|
4 |
% |
(2 |
)% |
Total operating expenses |
$ |
17,843 |
|
$ |
17,483 |
|
$ |
17,199 |
|
2 |
% |
2 |
% |
Net credit losses |
$ |
6,562 |
|
$ |
5,610 |
|
$ |
5,752 |
|
17 |
% |
(2 |
)% |
Credit reserve build (release) |
965 |
|
708 |
|
(395 |
) |
36 |
|
NM |
|
Provision (release) for unfunded lending commitments |
(2 |
) |
3 |
|
4 |
|
NM |
|
(25 |
) |
Provision for benefits and claims |
116 |
|
106 |
|
108 |
|
9 |
|
(2 |
) |
Provisions for credit losses and for benefits and claims |
$ |
7,641 |
|
$ |
6,427 |
|
$ |
5,469 |
|
19 |
% |
18 |
% |
Income from continuing operations before taxes |
$ |
7,213 |
|
$ |
7,609 |
|
$ |
9,583 |
|
(5 |
)% |
(21 |
)% |
Income taxes |
3,320 |
|
2,655 |
|
3,369 |
|
25 |
|
(21 |
) |
Income from continuing operations |
$ |
3,893 |
|
$ |
4,954 |
|
$ |
6,214 |
|
(21 |
)% |
(20 |
)% |
Noncontrolling interests |
$ |
9 |
|
$ |
7 |
|
$ |
10 |
|
29 |
% |
(30 |
)% |
Net income |
$ |
3,884 |
|
$ |
4,947 |
|
$ |
6,204 |
|
(21 |
)% |
(20 |
)% |
Balance Sheet data (in billions of dollars)
|
|
|
|
|
|
Total EOP assets |
$ |
429 |
|
$ |
412 |
|
$ |
381 |
|
4 |
% |
8 |
% |
Average assets |
418 |
|
396 |
|
378 |
|
6 |
|
5 |
|
Return on average assets |
0.93 |
% |
1.25 |
% |
1.64 |
% |
|
|
Efficiency ratio |
55 |
|
55 |
|
53 |
|
|
|
Average deposits |
$ |
306 |
|
$ |
298 |
|
$ |
295 |
|
3 |
|
1 |
|
Net credit losses as a percentage of average loans |
2.21 |
% |
2.01 |
% |
2.12 |
% |
|
|
Revenue by business |
|
|
|
|
|
Retail banking |
$ |
13,378 |
|
$ |
12,916 |
|
$ |
13,654 |
|
4 |
% |
(5 |
)% |
Cards(1)
|
19,319 |
|
18,603 |
|
18,597 |
|
4 |
|
— |
|
Total |
$ |
32,697 |
|
$ |
31,519 |
|
$ |
32,251 |
|
4 |
% |
(2 |
)% |
Income from continuing operations by business |
|
|
|
|
|
Retail banking |
$ |
1,673 |
|
$ |
1,566 |
|
$ |
1,875 |
|
7 |
% |
(16 |
)% |
Cards(1)
|
2,220 |
|
3,388 |
|
4,339 |
|
(34 |
) |
(22 |
) |
Total |
$ |
3,893 |
|
$ |
4,954 |
|
$ |
6,214 |
|
(21 |
)% |
(20 |
)% |
Table continues on the next page, including footnotes.
|
|
|
|
|
|
|
|
|
|
|
|
|
|
|
Foreign currency (FX) translation impact |
|
|
|
|
|
Total revenue—as reported |
$ |
32,697 |
|
$ |
31,519 |
|
$ |
32,251 |
|
4 |
% |
(2 |
)% |
Impact of FX translation(2)
|
— |
|
66 |
|
(924 |
) |
|
|
Total revenues—ex-FX(3)
|
$ |
32,697 |
|
$ |
31,585 |
|
$ |
31,327 |
|
4 |
% |
1 |
% |
Total operating expenses—as reported |
$ |
17,843 |
|
$ |
17,483 |
|
$ |
17,199 |
|
2 |
% |
2 |
% |
Impact of FX translation(2)
|
— |
|
54 |
|
(401 |
) |
|
|
Total operating expenses—ex-FX(3)
|
$ |
17,843 |
|
$ |
17,537 |
|
$ |
16,798 |
|
2 |
% |
4 |
% |
Total provisions for LLR & PBC—as reported |
$ |
7,641 |
|
$ |
6,427 |
|
$ |
5,469 |
|
19 |
% |
18 |
% |
Impact of FX translation(2)
|
— |
|
(1 |
) |
(214 |
) |
|
|
Total provisions for LLR & PBC—ex-FX(3)
|
$ |
7,641 |
|
$ |
6,426 |
|
$ |
5,255 |
|
19 |
% |
22 |
% |
Net income—as reported |
$ |
3,884 |
|
$ |
4,947 |
|
$ |
6,204 |
|
(21 |
)% |
(20 |
)% |
Impact of FX translation(2)
|
— |
|
7 |
|
(236 |
) |
|
|
Net income—ex-FX(3)
|
$ |
3,884 |
|
$ |
4,954 |
|
$ |
5,968 |
|
(22 |
)% |
(17 |
)% |
|
|
(1) |
Includes both Citi-branded cards and Citi retail services. |
|
|
(2) |
Reflects the impact of FX translation into U.S. dollars at the 2017 average exchange rates for all periods presented.
|
|
|
(3) |
Presentation of this metric excluding FX translation is a non-GAAP financial measure. |
NM Not meaningful
NORTH AMERICA GCB
North America GCB provides traditional retail banking, including commercial banking, Citi-branded cards products and Citi retail services card products to retail customers and small to mid-size businesses, as applicable, in the U.S. North America GCB’s U.S. cards product portfolio includes its proprietary portfolio (including the Citi Double Cash, Thank You and Value cards) and co-branded cards (including, among others, American Airlines and Costco) within Citi-branded cards as well as its co-brand and private label relationships (including, among others, Sears, The Home Depot, Best Buy and Macy’s) within Citi retail services.
As previously announced, the Hilton Honors co-brand credit card partnership with Citi was scheduled to terminate as of year-end 2017. On October 23, 2017, Citi signed an agreement to sell the Hilton credit card portfolio (approximately $1.1 billion in outstanding loan balances in Citi-branded cards as of December 31, 2017) to American Express. In connection with the sale agreement, the existing partnership was extended through the closing date. The sale was completed on January 30, 2018, resulting in a pretax gain of approximately $150 million, which approximates one year of revenues from the portfolio. The sale will impact North America GCB’s quarterly comparisons in 2018.
As of December 31, 2017, North America GCB’s 694 retail bank branches are concentrated in the six key metropolitan areas of New York, Chicago, Miami, Washington, D.C., Los Angeles and San Francisco. Also as of December 31, 2017, North America GCB had approximately 9.2 million retail banking customer accounts, $56.0 billion in retail banking loans and $182.5 billion in deposits. In addition, North America GCB had approximately 121 million Citi-branded and Citi retail services credit card accounts with $139.7 billion in outstanding card loan balances.
|
|
|
|
|
|
|
|
|
|
|
|
|
|
|
In millions of dollars, except as otherwise noted |
2017 |
2016 |
2015 |
% Change
2017 vs. 2016 |
% Change
2016 vs. 2015 |
Net interest revenue |
$ |
18,881 |
|
$ |
18,131 |
|
$ |
17,409 |
|
4 |
% |
4 |
% |
Non-interest revenue |
1,381 |
|
1,628 |
|
2,106 |
|
(15 |
) |
(23 |
) |
Total revenues, net of interest expense |
$ |
20,262 |
|
$ |
19,759 |
|
$ |
19,515 |
|
3 |
% |
1 |
% |
Total operating expenses |
$ |
10,160 |
|
$ |
10,058 |
|
$ |
9,369 |
|
1 |
% |
7 |
% |
Net credit losses |
$ |
4,796 |
|
$ |
3,919 |
|
$ |
3,751 |
|
22 |
% |
4 |
% |
Credit reserve build (release) |
869 |
|
653 |
|
(339 |
) |
33 |
|
NM |
|
Provision for unfunded lending commitments |
4 |
|
6 |
|
8 |
|
(33 |
) |
(25 |
) |
Provision for benefits and claims |
33 |
|
34 |
|
39 |
|
(3 |
) |
(13 |
) |
Provisions for credit losses and for benefits and claims |
$ |
5,702 |
|
$ |
4,612 |
|
$ |
3,459 |
|
24 |
% |
33 |
% |
Income from continuing operations before taxes |
$ |
4,400 |
|
$ |
5,089 |
|
$ |
6,687 |
|
(14 |
)% |
(24 |
)% |
Income taxes |
2,357 |
|
1,851 |
|
2,499 |
|
27 |
|
(26 |
) |
Income from continuing operations |
$ |
2,043 |
|
$ |
3,238 |
|
$ |
4,188 |
|
(37 |
)% |
(23 |
)% |
Noncontrolling interests |
(1 |
) |
(2 |
) |
3 |
|
50 |
|
NM |
|
Net income |
$ |
2,044 |
|
$ |
3,240 |
|
$ |
4,185 |
|
(37 |
)% |
(23 |
)% |
Balance Sheet data (in billions of dollars)
|
|
|
|
|
|
|
|
Average assets |
$ |
248 |
|
$ |
228 |
|
$ |
208 |
|
9 |
% |
10 |
% |
Return on average assets |
0.82 |
% |
1.42 |
% |
2.01 |
% |
|
|
Efficiency ratio |
50 |
|
51 |
|
48 |
|
|
|
Average deposits |
$ |
184.4 |
|
$ |
183.2 |
|
$ |
180.7 |
|
1 |
|
1 |
|
Net credit losses as a percentage of average loans |
2.58 |
% |
2.29 |
% |
2.39 |
% |
|
|
Revenue by business |
|
|
|
|
|
|
|
Retail banking |
$ |
5,257 |
|
$ |
5,222 |
|
$ |
5,312 |
|
1 |
% |
(2 |
)% |
Citi-branded cards |
8,578 |
|
8,150 |
|
7,781 |
|
5 |
|
5 |
|
Citi retail services |
6,427 |
|
6,387 |
|
6,422 |
|
1 |
|
(1 |
) |
Total |
$ |
20,262 |
|
$ |
19,759 |
|
$ |
19,515 |
|
3 |
% |
1 |
% |
Income from continuing operations by business |
|
|
|
|
|
|
|
Retail banking |
$ |
455 |
|
$ |
533 |
|
$ |
616 |
|
(15 |
)% |
(13 |
)% |
Citi-branded cards |
1,019 |
|
1,441 |
|
2,057 |
|
(29 |
) |
(30 |
) |
Citi retail services |
569 |
|
1,264 |
|
1,515 |
|
(55 |
) |
(17 |
) |
Total |
$ |
2,043 |
|
$ |
3,238 |
|
$ |
4,188 |
|
(37 |
)% |
(23 |
)% |
NM Not meaningful
2017 vs. 2016
Net income decreased 37% and was impacted by an estimated $750 million non-cash charge recorded in the tax line due to the impact of Tax Reform (for additional information, see “Impact of Tax Reform” above). Excluding the impact of Tax Reform, net income decreased 14% due to higher cost of credit and slightly higher expenses, partially offset by higher revenues.
Revenues increased 3%, driven by higher revenues across all businesses.
Retail banking revenues increased 1%. Excluding the decline in mortgage revenues (down of 32%), retail banking revenues were up 9%, driven by growth in checking deposits, continued growth in loans (average loans up 3%) and assets under management (up 14%) and increased commercial banking activity, as well as a benefit from higher interest rates. The decline in mortgage revenues was driven by lower origination activity and higher cost of funds, reflecting the higher interest rate environment, as well as the impact of the previously announced sale of a portion of Citi’s mortgage servicing rights.
Cards revenues increased 3%. In Citi-branded cards, revenues increased 5%, primarily reflecting the acquisition of the Costco portfolio (completed June 17, 2016), as well as modest growth in interest-earning balances, partially offset by the continued run-off of non-core portfolios and the higher cost to fund growth in transactor and promotional balances, given the higher interest rates. Average loans grew 15% and purchase sales grew 28%. North America GCB expects that additional terms in certain partnership contracts that go into effect in 2018 will negatively impact Citi-branded cards revenues going forward.
Citi retail services revenues increased 1%, as continued loan growth was partially offset by the impact of the previously disclosed renewal and extension of certain partnerships within the portfolio, as well as the absence of gains on sales of two cards portfolios in 2016. Average loans grew 4% and purchase sales grew 2%.
Expenses increased 1%, driven by the addition of the Costco portfolio, higher volume-related expenses and investments, partially offset by efficiency savings. Also included in expenses is an $80 million provision for remediation costs related to a Credit Card Accountability Responsibility and Disclosure Act (CARD Act) matter (for additional information, see “Corporate/Other” below and Note 27 to the Consolidated Financial Statements).
Provisions increased 24% from the prior year, driven by higher net credit losses and a higher net loan loss reserve build.
Net credit losses increased 22% to $4.8 billion, largely driven by higher net credit losses in Citi-branded cards (up 28% to $2.4 billion) and Citi retail services (up 19% to $2.2 billion). The increase in net credit losses primarily reflected volume growth and seasoning in both cards portfolios, as well as the impact of acquiring the Costco portfolio in Citi-branded cards.
The net loan loss reserve build in 2017 was $873 million (compared to a build of $659 million in the prior year), driven by volume growth and seasoning in both cards portfolios, as
well as the increase in net flow rates in later delinquency buckets leading to higher inherent credit loss expectations, primarily in Citi retail services.
For additional information on North America GCB’s retail banking portfolios, including commercial banking, and its Citi-branded cards and Citi retail services portfolios, see “Credit Risk—Consumer Credit” below.
2016 vs. 2015
Net income decreased by 23% due to significantly higher cost of credit and higher expenses, partially offset by higher revenues.
Revenues increased 1%, reflecting higher revenues in Citi-branded cards, partially offset by lower revenues in retail banking and Citi retail services. Retail banking revenues decreased 2%. Excluding the previously disclosed $110 million gain on sale of branches in Texas in the first quarter of 2015, retail banking revenues were largely unchanged, as lower mortgage revenues were offset by continued volume growth, including growth in average loans (9%) and average checking deposits (9%).
Cards revenues increased 2%. In Citi-branded cards, revenues increased 5%, primarily reflecting the acquisition of the Costco portfolio as well as volume growth, partially offset by higher investment-related acquisition and rewards costs and the impact of higher promotional balances. Citi retail services revenues decreased 1%, as the impact of the renewal and extension of several partnerships within the portfolio as well as the absence of revenues from portfolio exits were partially offset by modest growth in average loans.
Expenses increased 7%, primarily due to the Costco acquisition, continued investment spending, volume growth, higher repositioning charges and regulatory and compliance costs, partially offset by ongoing efficiency savings and lower legal and related costs.
Provisions increased 33%, driven by a net loan loss reserve build, compared to a loan loss reserve release in the prior year, and higher net credit losses. The net loan loss reserve build mostly reflected reserve builds in the cards portfolios and was primarily driven by the impact of the acquisition of the Costco portfolio, as well as volume growth and seasoning of the portfolios and the absence of nearly $400 million of reserve releases in 2015 as credit normalized. The reserve build was also due to the estimated impact of proposed regulatory guidelines on third-party debt collections.
The increase in net credit losses was driven by increases in cards and retail banking. In retail banking, net credit losses grew 37%, primarily due to an increase related to Citi’s energy and energy-related exposures within the commercial banking portfolio, which was largely offset by releases of previously established loan loss reserves. In Citi-branded cards, net credit losses increased 1%, driven by volume growth, including the impact of Costco beginning in the fourth quarter of 2016, seasoning and the impact of the regulatory changes on collections. In Citi retail services, net credit losses increased 6%, primarily due to portfolio growth and seasoning and the impact of the regulatory changes on collections.
LATIN AMERICA GCB
Latin America GCB provides traditional retail banking, including commercial banking, and its Citi-branded card products to retail customers and small to mid-size businesses in Mexico through Citibanamex, one of Mexico’s largest banks.
At December 31, 2017, Latin America GCB had 1,479 retail branches in Mexico, with approximately 27.7 million retail banking customer accounts, $19.9 billion in retail banking loans and $27.1 billion in deposits. In addition, the business had approximately 5.6 million Citi-branded card accounts with $5.4 billion in outstanding loan balances.
On November 27, 2017, Citi entered into an agreement to sell its Mexico asset management business reported within Latin America GCB. For additional information on this sale, see Note 2 to the Consolidated Financial Statements.
|
|
|
|
|
|
|
|
|
|
|
|
|
|
|
In millions of dollars, except as otherwise noted |
2017 |
2016 |
2015 |
% Change
2017 vs. 2016 |
% Change
2016 vs. 2015 |
Net interest revenue |
$ |
3,638 |
|
$ |
3,431 |
|
$ |
3,849 |
|
6 |
% |
(11 |
)% |
Non-interest revenue |
1,514 |
|
1,491 |
|
1,873 |
|
2 |
|
(20 |
) |
Total revenues, net of interest expense |
$ |
5,152 |
|
$ |
4,922 |
|
$ |
5,722 |
|
5 |
% |
(14 |
)% |
Total operating expenses |
$ |
2,920 |
|
$ |
2,838 |
|
$ |
3,251 |
|
3 |
% |
(13 |
)% |
Net credit losses |
$ |
1,117 |
|
$ |
1,040 |
|
$ |
1,280 |
|
7 |
% |
(19 |
)% |
Credit reserve build (release) |
125 |
|
83 |
|
33 |
|
51 |
|
NM |
|
Provision (release) for unfunded lending commitments |
(1 |
) |
1 |
|
(2 |
) |
NM |
|
NM |
|
Provision for benefits and claims |
83 |
|
72 |
|
69 |
|
15 |
|
4 |
|
Provisions for credit losses and for benefits and claims (LLR & PBC) |
$ |
1,324 |
|
$ |
1,196 |
|
$ |
1,380 |
|
11 |
% |
(13 |
)% |
Income from continuing operations before taxes |
$ |
908 |
|
$ |
888 |
|
$ |
1,091 |
|
2 |
% |
(19 |
)% |
Income taxes |
318 |
|
255 |
|
265 |
|
25 |
|
(4 |
) |
Income from continuing operations |
$ |
590 |
|
$ |
633 |
|
$ |
826 |
|
(7 |
)% |
(23 |
)% |
Noncontrolling interests |
5 |
|
5 |
|
3 |
|
— |
|
67 |
|
Net income |
$ |
585 |
|
$ |
628 |
|
$ |
823 |
|
(7 |
)% |
(24 |
)% |
Balance Sheet data (in billions of dollars)
|
|
|
|
|
|
|
|
Average assets |
$ |
45 |
|
$ |
49 |
|
$ |
53 |
|
(8 |
)% |
(8 |
)% |
Return on average assets |
1.30 |
% |
1.28 |
% |
1.55 |
% |
|
|
Efficiency ratio |
57 |
|
58 |
|
57 |
|
|
|
Average deposits |
$ |
27.4 |
|
$ |
25.7 |
|
$ |
26.7 |
|
7 |
|
(4 |
) |
Net credit losses as a percentage of average loans |
4.42 |
% |
4.32 |
% |
4.87 |
% |
|
|
Revenue by business |
|
|
|
|
|
Retail banking |
$ |
3,690 |
|
$ |
3,447 |
|
$ |
3,933 |
|
7 |
% |
(12 |
)% |
Citi-branded cards |
1,462 |
|
1,475 |
|
1,789 |
|
(1 |
) |
(18 |
) |
Total |
$ |
5,152 |
|
$ |
4,922 |
|
$ |
5,722 |
|
5 |
% |
(14 |
)% |
Income from continuing operations by business |
|
|
|
|
|
|
|
Retail banking |
$ |
410 |
|
$ |
355 |
|
$ |
520 |
|
15 |
% |
(32 |
)% |
Citi-branded cards |
180 |
|
278 |
|
306 |
|
(35 |
) |
(9 |
) |
Total |
$ |
590 |
|
$ |
633 |
|
$ |
826 |
|
(7 |
)% |
(23 |
)% |
FX translation impact |
|
|
|
|
|
|
|
Total revenues—as reported |
$ |
5,152 |
|
$ |
4,922 |
|
$ |
5,722 |
|
5 |
% |
(14 |
)% |
Impact of FX translation(1)
|
— |
|
(45 |
) |
(906 |
) |
|
|
Total revenues—ex-FX(2)
|
$ |
5,152 |
|
$ |
4,877 |
|
$ |
4,816 |
|
6 |
% |
1 |
% |
Total operating expenses—as reported |
$ |
2,920 |
|
$ |
2,838 |
|
$ |
3,251 |
|
3 |
% |
(13 |
)% |
Impact of FX translation(1)
|
— |
|
(21 |
) |
(376 |
) |
|
|
Total operating expenses—ex-FX(2)
|
$ |
2,920 |
|
$ |
2,817 |
|
$ |
2,875 |
|
4 |
% |
(2 |
)% |
Provisions for LLR & PBC—as reported |
$ |
1,324 |
|
$ |
1,196 |
|
$ |
1,380 |
|
11 |
% |
(13 |
)% |
Impact of FX translation(1)
|
— |
|
(10 |
) |
(211 |
) |
|
|
Provisions for LLR & PBC—ex-FX(2)
|
$ |
1,324 |
|
$ |
1,186 |
|
$ |
1,169 |
|
12 |
% |
1 |
% |
Net income—as reported |
$ |
585 |
|
$ |
628 |
|
$ |
823 |
|
(7 |
)% |
(24 |
)% |
Impact of FX translation(1)
|
— |
|
(10 |
) |
(244 |
) |
|
|
Net income—ex-FX(2)
|
$ |
585 |
|
$ |
618 |
|
$ |
579 |
|
(5 |
)% |
7 |
% |
|
|
(1) |
Reflects the impact of FX translation into U.S. dollars at the 2017 average exchange rates for all periods presented.
|
|
|
(2) |
Presentation of this metric excluding FX translation is a non-GAAP financial measure. |
NM Not meaningful
The discussion of the results of operations for Latin America GCB below excludes the impact of FX translation for all periods presented. Presentations of the results of operations, excluding the impact of FX translation, are non-GAAP financial measures. For a reconciliation of certain of these metrics to the reported results, see the table above.
2017 vs. 2016
Net income decreased 5%, primarily driven by higher credit costs and expenses, partially offset by higher revenues.
Revenues increased 6%, driven by higher revenues in
retail banking.
Retail banking revenues increased 8%, reflecting continued growth in volumes, including an increase in average deposits (8%), average loans (6%), reflecting growth across most portfolios, an increase in assets under management (6%), as well as improved deposit spreads, driven by higher interest rates. Cards revenues were largely unchanged, as continued improvement in full-rate revolving loans in the second half of 2017 was offset by a higher cost to fund non-revolving loans. Purchase sales grew 8% and average card loans grew 5%.
Expenses increased 4%, as ongoing investment spending and business growth were partially offset by efficiency savings. Citi continues to execute on its investment plans for Citibanamex (totaling more than $1 billion through 2020), including initiatives to modernize the branch network, enhance digital capabilities and upgrade core operating platforms.
Provisions increased 12%, primarily driven by higher net credit losses (8%) and a $42 million increase in the net loan loss reserve build, largely reflecting volume growth and seasoning. The increase in the loan loss reserve build was also driven by a Mexico earthquake-related loan loss reserve build in the third quarter of 2017 (approximately $25 million).
For additional information on Latin America GCB’s retail banking portfolios, including commercial banking, and its Citi-branded cards portfolio, see “Credit Risk—Consumer Credit” below.
For additional information on potential macroeconomic
and geopolitical challenges and other risks facing Latin
America GCB, see “Risk Factors—Strategic Risks” below.
2016 vs. 2015
Net income increased 7%, driven by higher revenues and lower expenses, partially offset by higher credit costs.
Revenues increased 1%, driven by overall volume growth, largely offset by the absence of a $160 million gain on sale related to the sale of the merchant acquiring business in Mexico in 2015. Excluding this gain, revenues increased 5%, primarily due to higher revenues in retail banking, partially offset by lower revenues in cards. Retail banking revenues increased 3%. Excluding the gain on sale related to the merchant acquiring business, revenues increased 9%, driven by volume growth. Cards revenues decreased 4%, driven by the impact of higher payment rates, partially offset by increased purchase sales.
Expenses decreased 2%, as lower legal and related expenses, the impact of business divestitures and ongoing efficiency savings were partially offset by higher repositioning charges and ongoing investment spending.
Provisions increased 1%, driven by a higher net loan loss reserve build, partially offset by lower net credit losses. The net loan loss reserve build increased $56 million, largely due to volume growth. Net credit losses decreased 5%, largely reflecting continued lower net credit losses in the cards portfolio, partially offset by higher net credit losses in the personal loan portfolio.
ASIA GCB
Asia GCB provides traditional retail banking, including commercial banking, and its Citi-branded card products to retail customers and small to mid-size businesses, as applicable. As of December 31, 2017, Citi’s most significant revenues in the region were from Singapore, Hong Kong, Korea, Australia, India, Taiwan, Indonesia, Philippines, Thailand and Malaysia. Included within Asia GCB, traditional retail banking and Citi-branded card products are also provided to retail customers in certain EMEA countries, primarily in Poland, Russia and the United Arab Emirates.
At December 31, 2017, on a combined basis, the businesses had 278 retail branches, approximately 16.0 million retail banking customer accounts, $70.0 billion in retail banking loans and $97.7 billion in deposits. In addition, the businesses had approximately 16.4 million Citi-branded card accounts with $19.8 billion in outstanding loan balances.
|
|
|
|
|
|
|
|
|
|
|
|
|
|
|
In millions of dollars, except as otherwise noted(1)
|
2017 |
2016 |
2015 |
% Change
2017 vs. 2016 |
% Change
2016 vs. 2015 |
Net interest revenue |
$ |
4,668 |
|
$ |
4,463 |
|
$ |
4,494 |
|
5 |
% |
(1 |
)% |
Non-interest revenue |
2,615 |
|
2,375 |
|
2,520 |
|
10 |
|
(6 |
) |
Total revenues, net of interest expense |
$ |
7,283 |
|
$ |
6,838 |
|
$ |
7,014 |
|
7 |
% |
(3 |
)% |
Total operating expenses |
$ |
4,763 |
|
$ |
4,587 |
|
$ |
4,579 |
|
4 |
% |
— |
% |
Net credit losses |
$ |
649 |
|
$ |
651 |
|
$ |
721 |
|
— |
% |
(10 |
)% |
Credit reserve build (release) |
(29 |
) |
(28 |
) |
(89 |
) |
(4 |
) |
69 |
|
Provision (release) for unfunded lending commitments |
(5 |
) |
(4 |
) |
(2 |
) |
(25 |
) |
(100 |
) |
Provisions for credit losses |
$ |
615 |
|
$ |
619 |
|
$ |
630 |
|
(1 |
)% |
(2 |
)% |
Income from continuing operations before taxes |
$ |
1,905 |
|
$ |
1,632 |
|
$ |
1,805 |
|
17 |
% |
(10 |
)% |
Income taxes |
645 |
|
549 |
|
605 |
|
17 |
|
(9 |
) |
Income from continuing operations |
$ |
1,260 |
|
$ |
1,083 |
|
$ |
1,200 |
|
16 |
% |
(10 |
)% |
Noncontrolling interests |
5 |
|
4 |
|
4 |
|
25 |
|
— |
|
Net income |
$ |
1,255 |
|
$ |
1,079 |
|
$ |
1,196 |
|
16 |
% |
(10 |
)% |
Balance Sheet data (in billions of dollars)
|
|
|
|
|
|
|
|
Average assets |
$ |
125 |
|
$ |
119 |
|
$ |
117 |
|
5 |
% |
2 |
% |
Return on average assets |
1.00 |
% |
0.91 |
% |
1.02 |
% |
|
|
Efficiency ratio |
65 |
|
67 |
|
65 |
|
|
|
Average deposits |
$ |
94.6 |
|
$ |
89.5 |
|
$ |
87.7 |
|
6 |
|
2 |
|
Net credit losses as a percentage of average loans |
0.76 |
% |
0.77 |
% |
0.81 |
% |
|
|
Revenue by business |
|
|
|
|
|
Retail banking |
$ |
4,431 |
|
$ |
4,247 |
|
$ |
4,409 |
|
4 |
% |
(4 |
)% |
Citi-branded cards |
2,852 |
|
2,591 |
|
2,605 |
|
10 |
|
(1 |
) |
Total |
$ |
7,283 |
|
$ |
6,838 |
|
$ |
7,014 |
|
7 |
% |
(3 |
)% |
Income from continuing operations by business |
|
|
|
|
|
Retail banking |
$ |
808 |
|
$ |
678 |
|
$ |
739 |
|
19 |
% |
(8 |
)% |
Citi-branded cards |
452 |
|
405 |
|
461 |
|
12 |
|
(12 |
) |
Total |
$ |
1,260 |
|
$ |
1,083 |
|
$ |
1,200 |
|
16 |
% |
(10 |
)% |
|
|
|
|
|
|
|
|
|
|
|
|
|
|
|
FX translation impact |
|
|
|
|
|
Total revenues—as reported |
$ |
7,283 |
|
$ |
6,838 |
|
$ |
7,014 |
|
7 |
% |
(3 |
)% |
Impact of FX translation(2)
|
— |
|
111 |
|
(18 |
) |
|
|
Total revenues—ex-FX(3)
|
$ |
7,283 |
|
$ |
6,949 |
|
$ |
6,996 |
|
5 |
% |
(1 |
)% |
Total operating expenses—as reported |
$ |
4,763 |
|
$ |
4,587 |
|
$ |
4,579 |
|
4 |
% |
— |
% |
Impact of FX translation(2)
|
— |
|
75 |
|
(25 |
) |
|
|
Total operating expenses—ex-FX(3)
|
$ |
4,763 |
|
$ |
4,662 |
|
$ |
4,554 |
|
2 |
% |
2 |
% |
Provisions for credit losses—as reported |
$ |
615 |
|
$ |
619 |
|
$ |
630 |
|
(1 |
)% |
(2 |
)% |
Impact of FX translation(2)
|
— |
|
9 |
|
(3 |
) |
|
|
Provisions for credit losses—ex-FX(3)
|
$ |
615 |
|
$ |
628 |
|
$ |
627 |
|
(2 |
)% |
— |
% |
Net income—as reported |
$ |
1,255 |
|
$ |
1,079 |
|
$ |
1,196 |
|
16 |
% |
(10 |
)% |
Impact of FX translation(2)
|
— |
|
17 |
|
8 |
|
|
|
Net income—ex-FX(3)
|
$ |
1,255 |
|
$ |
1,096 |
|
$ |
1,204 |
|
15 |
% |
(9 |
)% |
|
|
(1) |
Asia GCB includes the results of operations of GCB activities in certain EMEA countries for all periods presented.
|
|
|
(2) |
Reflects the impact of FX translation into U.S. dollars at the 2017 average exchange rates for all periods presented.
|
|
|
(3) |
Presentation of this metric excluding FX translation is a non-GAAP financial measure. |
The discussion of the results of operations for Asia GCB below excludes the impact of FX translation for all periods presented. Presentations of the results of operations, excluding the impact of FX translation, are non-GAAP financial measures. For a reconciliation of certain of these metrics to the reported results, see the table above.
2017 vs. 2016
Net income increased 15%, reflecting higher revenues and lower cost of credit, partially offset by higher expenses.
Revenues increased 5%, driven by improvement in cards and wealth management revenues, partially offset by continued lower retail lending revenues.
Retail banking revenues increased 3%, primarily due to the continued improvement in wealth management revenues, partially offset by the repositioning of the retail loan portfolio. Wealth management revenues increased due to improvement in investor sentiment, stronger equity markets and increases in assets under management (18%) and investment sales (38%). Average deposits increased 5%. The increase in revenues was partially offset by the lower retail lending revenues (down 4%), reflecting continued lower average loans (1%) due to the continued optimization of this portfolio away from lower yielding mortgage loans to focus on growing higher-return personal loans.
Cards revenues increased 8%, reflecting 5% growth in average loans and 7% growth in purchase sales, both of which benefited from the previously disclosed portfolio acquisition in Australia in 2017, as well as modest gains in 2017 related to sales of merchant acquiring businesses in certain countries.
Expenses increased 2%, resulting from volume growth and ongoing investment spending, partially offset by efficiency savings.
Provisions decreased 2%, primarily driven by a decrease in net credit losses.
For additional information on Asia GCB’s retail banking portfolios, including commercial banking, and its Citi-branded cards portfolio, see “Credit Risk—Consumer Credit” below.
2016 vs. 2015
Net income decreased 9%, reflecting lower revenues and higher expenses.
Revenues decreased 1%, reflecting lower retail banking revenues, partially offset by higher cards revenues. Retail banking revenues decreased 2%, mainly due to a 5% decrease in wealth management revenues due to lower client activity, modestly lower investment assets under management and a decline in average loans. The decline in revenues was partially offset by growth in deposit volumes and higher insurance revenues. Cards revenues increased 1%, driven by continued improvement in yields, modestly abating regulatory headwinds and modest volume growth due to continued stabilizing payment rates.
Expenses increased 2%, primarily due to higher repositioning costs, higher regulatory and compliance costs and increased investment spending, partially offset by efficiency savings.
Provisions were largely unchanged as lower net loan loss reserve releases were offset by lower net credit losses, primarily in the commercial portfolio.
INSTITUTIONAL CLIENTS GROUP
Institutional Clients Group (ICG) includes Banking and Markets and securities services (for additional information on these businesses, see “Citigroup Segments” above). ICG provides corporate, institutional, public sector and high-net-worth clients around the world with a full range of wholesale banking products and services, including fixed income and equity sales and trading, foreign exchange, prime brokerage, derivative services, equity and fixed income research, corporate lending, investment banking and advisory services, private banking, cash management, trade finance and securities services. ICG transacts with clients in both cash instruments and derivatives, including fixed income, foreign currency, equity and commodity products.
ICG revenue is generated primarily from fees and spreads associated with these activities. ICG earns fee income for assisting clients in clearing transactions, providing brokerage and investment banking services and other such activities. Revenue generated from these activities is recorded in Commissions and fees and Investment banking. Revenue is also generated from transaction processing and assets under custody and administration. Revenue generated from these activities is primarily recorded in Administration and other fiduciary fees. In addition, as a market maker, ICG facilitates transactions, including holding product inventory to meet client demand, and earns the differential between the price at which it buys and sells the products. These price differentials and the unrealized gains and losses on the inventory are recorded in Principal transactions (for additional information on Principal transactions revenue, see Note 6 to the Consolidated Financial Statements). Other primarily includes mark-to-market gains and losses on certain credit derivatives, gains and losses on available-for-sale (AFS) securities and other non-recurring gains and losses. Interest income earned on assets held, less interest paid to customers on deposits and long- and short-term debt, is recorded as Net interest revenue.
The amount and types of Markets revenues are impacted by a variety of interrelated factors, including market liquidity; changes in market variables such as interest rates, foreign exchange rates, equity prices, commodity prices and credit spreads, as well as their implied volatilities; investor confidence; and other macroeconomic conditions. Assuming all other market conditions do not change, increases in client activity levels or bid/offer spreads generally result in increases in revenues. However, changes in market conditions can significantly impact client activity levels, bid/offer spreads and the fair value of product inventory. For example, a decrease in market liquidity may increase bid/offer spreads, decrease client activity levels and widen credit spreads on product inventory positions.
ICG’s management of the Markets businesses involves daily monitoring and evaluating of the above factors at the trading desk as well as the country level. ICG does not separately track the impact on total Markets revenues of the volume of transactions, bid/offer spreads, fair value changes of product inventory positions and economic hedges because, as noted above, these components are interrelated and are not deemed useful or necessary individually to manage the Markets businesses at an aggregate level.
In the Markets businesses, client revenues are those revenues directly attributable to client transactions at the time of inception, including commissions, interest or fees earned. Client revenues do not include the results of client facilitation activities (for example, holding product inventory in anticipation of client demand) or the results of certain economic hedging activities.
ICG’s international presence is supported by trading floors in approximately 80 countries and a proprietary network in 98 countries and jurisdictions. At December 31, 2017, ICG had approximately $1.3 trillion of assets and $640 billion of deposits, while two of its businesses—securities services and issuer services—managed approximately $17.4 trillion of assets under custody compared to $15.2 trillion at the end of the prior-year period.
|
|
|
|
|
|
|
|
|
|
|
|
|
|
|
In millions of dollars, except as otherwise noted |
2017 |
2016 |
2015 |
% Change
2017 vs. 2016 |
% Change
2016 vs. 2015 |
Commissions and fees |
$ |
4,314 |
|
$ |
4,045 |
|
$ |
4,088 |
|
7 |
% |
(1 |
)% |
Administration and other fiduciary fees |
2,523 |
|
2,262 |
|
2,248 |
|
12 |
|
1 |
|
Investment banking |
4,404 |
|
3,655 |
|
4,110 |
|
20 |
|
(11 |
) |
Principal transactions |
7,740 |
|
7,335 |
|
5,824 |
|
6 |
|
26 |
|
Other(1)
|
1,149 |
|
(164 |
) |
1,394 |
|
NM |
|
NM |
|
Total non-interest revenue |
$ |
20,130 |
|
$ |
17,133 |
|
$ |
17,664 |
|
17 |
% |
(3 |
)% |
Net interest revenue (including dividends) |
15,537 |
|
16,094 |
|
15,668 |
|
(3 |
) |
3 |
|
Total revenues, net of interest expense |
$ |
35,667 |
|
$ |
33,227 |
|
$ |
33,332 |
|
7 |
% |
— |
% |
Total operating expenses |
$ |
19,608 |
|
$ |
18,956 |
|
$ |
19,087 |
|
3 |
% |
(1 |
)% |
Net credit losses |
$ |
365 |
|
$ |
516 |
|
$ |
214 |
|
(29 |
)% |
NM |
|
Credit reserve build (release) |
(221 |
) |
(64 |
) |
654 |
|
NM |
|
NM |
|
Provision (release) for unfunded lending commitments |
(159 |
) |
34 |
|
94 |
|
NM |
|
(64 |
) |
Provisions for credit losses |
$ |
(15 |
) |
$ |
486 |
|
$ |
962 |
|
NM |
|
(49 |
)% |
Income from continuing operations before taxes |
$ |
16,074 |
|
$ |
13,785 |
|
$ |
13,283 |
|
17 |
% |
4 |
% |
Income taxes |
7,008 |
|
4,260 |
|
4,173 |
|
65 |
|
2 |
|
Income from continuing operations |
$ |
9,066 |
|
$ |
9,525 |
|
$ |
9,110 |
|
(5 |
)% |
5 |
% |
|
|
|
|
|
|
|
|
|
|
|
|
|
|
|
Noncontrolling interests |
57 |
|
58 |
|
51 |
|
(2 |
) |
14 |
|
Net income |
$ |
9,009 |
|
$ |
9,467 |
|
$ |
9,059 |
|
(5 |
)% |
5 |
% |
Average assets (in billions of dollars)
|
$ |
1,358 |
|
$ |
1,298 |
|
$ |
1,272 |
|
5 |
% |
2 |
% |
Return on average assets |
0.66 |
% |
0.73 |
% |
0.71 |
% |
|
|
Efficiency ratio |
55 |
|
57 |
|
57 |
|
|
|
CVA/DVA after-tax |
$ |
— |
|
$ |
— |
|
$ |
172 |
|
— |
% |
(100 |
)% |
Net income ex-CVA/DVA(2)
|
9,009 |
|
9,467 |
|
8,887 |
|
(5 |
) |
7 |
|
Revenues by region |
|
|
|
|
|
North America |
$ |
13,636 |
|
$ |
12,513 |
|
$ |
12,698 |
|
9 |
% |
(1 |
)% |
EMEA |
10,692 |
|
9,855 |
|
9,788 |
|
8 |
|
1 |
|
Latin America |
4,216 |
|
3,977 |
|
3,944 |
|
6 |
|
1 |
|
Asia |
7,123 |
|
6,882 |
|
6,902 |
|
4 |
|
— |
|
Total |
$ |
35,667 |
|
$ |
33,227 |
|
$ |
33,332 |
|
7 |
% |
— |
% |
Income from continuing operations by region |
|
|
|
|
|
|
North America |
$ |
2,449 |
|
$ |
3,495 |
|
$ |
3,316 |
|
(30 |
)% |
5 |
% |
EMEA |
2,804 |
|
2,365 |
|
2,230 |
|
19 |
|
6 |
|
Latin America |
1,513 |
|
1,454 |
|
1,351 |
|
4 |
|
8 |
|
Asia |
2,300 |
|
2,211 |
|
2,213 |
|
4 |
|
— |
|
Total |
$ |
9,066 |
|
$ |
9,525 |
|
$ |
9,110 |
|
(5 |
)% |
5 |
% |
Average loans by region (in billions of dollars)
|
|
|
|
|
|
|
North America |
$ |
151 |
|
$ |
145 |
|
$ |
130 |
|
4 |
% |
12 |
% |
EMEA |
69 |
|
66 |
|
62 |
|
5 |
|
6 |
|
Latin America |
34 |
|
35 |
|
37 |
|
(3 |
) |
(5 |
) |
Asia |
62 |
|
57 |
|
59 |
|
9 |
|
(3 |
) |
Total |
$ |
316 |
|
$ |
303 |
|
$ |
288 |
|
4 |
% |
5 |
% |
EOP deposits by business (in billions of dollars)
|
|
|
|
|
|
Treasury and trade solutions |
$ |
432 |
|
$ |
412 |
|
$ |
394 |
|
5 |
% |
5 |
% |
All other ICG businesses
|
208 |
|
200 |
|
195 |
|
4 |
|
3 |
|
Total |
$ |
640 |
|
$ |
612 |
|
$ |
589 |
|
5 |
% |
4 |
% |
|
|
(1) |
2017 includes the $580 million gain on the sale of a fixed income analytics business. 2016 includes a charge of approximately $180 million, primarily reflecting the write-down of Citi’s net investment in Venezuela as a result of changes in the exchange rate. |
|
|
(2) |
Excludes CVA/DVA in 2015, consistent with current presentation. For additional information, see Notes 1 and 24 to the Consolidated Financial Statements. |
NM Not meaningful
ICG Revenue Details—Excluding CVA/DVA and Gains (Losses) on Loan Hedges
|
|
|
|
|
|
|
|
|
|
|
|
|
|
|
In millions of dollars |
2017 |
2016 |
2015 |
% Change
2017 vs. 2016 |
% Change
2016 vs. 2015 |
Investment banking revenue details
|
|
|
|
|
|
Advisory |
$ |
1,108 |
|
$ |
1,000 |
|
$ |
1,093 |
|
11 |
% |
(9 |
)% |
Equity underwriting |
1,053 |
|
628 |
|
906 |
|
68 |
|
(31 |
) |
Debt underwriting |
3,011 |
|
2,674 |
|
2,558 |
|
13 |
|
5 |
|
Total investment banking |
$ |
5,172 |
|
$ |
4,302 |
|
$ |
4,557 |
|
20 |
% |
(6 |
)% |
Treasury and trade solutions |
8,473 |
|
7,897 |
|
7,482 |
|
7 |
|
6 |
|
Corporate lending—excluding gains (losses) on loan hedges(1) |
1,922 |
|
1,718 |
|
1,827 |
|
12 |
|
(6 |
) |
Private bank |
3,088 |
|
2,709 |
|
2,582 |
|
14 |
|
5 |
|
|
Total banking revenues (ex-CVA/DVA and gains (losses) on
loan hedges)(2)
|
$ |
18,655 |
|
$ |
16,626 |
|
$ |
16,448 |
|
12 |
% |
1 |
% |
Corporate lending—gains (losses) on loan hedges(1) |
$ |
(133 |
) |
$ |
(594 |
) |
$ |
324 |
|
78 |
% |
NM |
|
|
Total banking revenues (ex-CVA/DVA and including gains
(losses) on loan hedges)(2)
|
$ |
18,522 |
|
$ |
16,032 |
|
$ |
16,772 |
|
16 |
% |
(4 |
)% |
Fixed income markets |
$ |
12,127 |
|
$ |
12,853 |
|
$ |
11,277 |
|
(6 |
)% |
14 |
% |
Equity markets |
2,747 |
|
2,812 |
|
3,101 |
|
(2 |
) |
(9 |
) |
Securities services |
2,329 |
|
2,152 |
|
2,114 |
|
8 |
|
2 |
|
Other(3)
|
(58 |
) |
(622 |
) |
(201 |
) |
91 |
|
NM |
|
Total Markets and securities services (ex-CVA/DVA)(2)
|
$ |
17,145 |
|
$ |
17,195 |
|
$ |
16,291 |
|
— |
% |
6 |
% |
Total ICG (ex-CVA/DVA)
|
$ |
35,667 |
|
$ |
33,227 |
|
$ |
33,063 |
|
7 |
% |
— |
% |
CVA/DVA (excluded as applicable in lines above) |
— |
|
— |
|
269 |
|
NM |
|
NM |
|
Fixed income markets |
— |
|
— |
|
220 |
|
NM |
|
NM |
|
Equity markets |
— |
|
— |
|
47 |
|
NM |
|
NM |
|
Private bank |
— |
|
— |
|
2 |
|
NM |
|
NM |
|
Total revenues, net of interest expense |
$ |
35,667 |
|
$ |
33,227 |
|
$ |
33,332 |
|
7 |
% |
— |
% |
Commissions and fees |
$ |
625 |
|
$ |
474 |
|
$ |
467 |
|
32 |
% |
1 |
% |
Principal transactions(4)
|
6,826 |
|
6,538 |
|
5,374 |
|
4 |
|
22 |
|
Other |
590 |
|
591 |
|
330 |
|
— |
|
79 |
|
Total non-interest revenue |
$ |
8,041 |
|
$ |
7,603 |
|
$ |
6,171 |
|
6 |
% |
23 |
% |
Net interest revenue |
4,086 |
|
5,250 |
|
5,106 |
|
(22 |
) |
3 |
|
Total fixed income markets (ex-CVA/DVA)(2)
|
$ |
12,127 |
|
$ |
12,853 |
|
$ |
11,277 |
|
(6 |
)% |
14 |
% |
Rates and currencies |
$ |
8,783 |
|
$ |
9,289 |
|
$ |
7,616 |
|
(5 |
)% |
22 |
% |
Spread products / other fixed income |
3,344 |
|
3,564 |
|
3,661 |
|
(6 |
) |
(3 |
) |
Total fixed income markets (ex-CVA/DVA)(2)
|
$ |
12,127 |
|
$ |
12,853 |
|
$ |
11,277 |
|
(6 |
)% |
14 |
% |
Commissions and fees |
$ |
1,234 |
|
$ |
1,300 |
|
$ |
1,338 |
|
(5 |
)% |
(3 |
)% |
Principal transactions(4)
|
382 |
|
134 |
|
270 |
|
NM |
|
(50 |
) |
Other |
4 |
|
139 |
|
54 |
|
(97 |
) |
NM |
|
Total non-interest revenue |
$ |
1,620 |
|
$ |
1,573 |
|
$ |
1,662 |
|
3 |
% |
(5 |
)% |
Net interest revenue |
1,127 |
|
1,239 |
|
1,439 |
|
(9 |
) |
(14 |
) |
Total equity markets (ex-CVA/DVA)(2)
|
$ |
2,747 |
|
$ |
2,812 |
|
$ |
3,101 |
|
(2 |
)% |
(9 |
)% |
|
|
(1) |
Credit derivatives are used to economically hedge a portion of the corporate loan portfolio that includes both accrual loans and loans at fair value. Gains (losses) on loan hedges includes the mark-to-market on the credit derivatives and the mark-to-market on the loans in the portfolio that are at fair value. The fixed premium costs of these hedges are netted against the corporate lending revenues to reflect the cost of credit protection. Citigroup’s results of operations excluding the impact of gains (losses) on loan hedges are non-GAAP financial measures. |
|
|
(2) |
Excludes CVA/DVA in 2015, consistent with current presentation. For additional information, see Notes 1 and 24 to the Consolidated Financial Statements. |
|
|
(3) |
2017 includes the $580 million gain on the sale of a fixed income analytics business. 2016 includes a charge of approximately $180 million, primarily reflecting the write-down of Citi’s net investment in Venezuela as a result of changes in the exchange rate. |
(4) Excludes principal transactions revenues of ICG businesses other than Markets, primarily treasury and trade solutions and the private bank.
NM Not meaningful
The discussion of the results of operations for ICG below excludes the impact of CVA/DVA for 2015. Presentations of the results of operations, excluding the impact of CVA/DVA and the impact of gains (losses) on hedges of accrual loans, are non-GAAP financial measures. For a reconciliation of these metrics to the reported results, see the table above.
2017 vs. 2016
Net income decreased 5% and was impacted by an estimated $2.0 billion non-cash charge recorded in the tax line due to the impact of Tax Reform (for additional information, see “Impact of Tax Reform” above). Excluding the impact of Tax Reform, net income increased 16%, primarily driven by higher revenues and lower cost of credit, partially offset by higher expenses.
|
|
• |
Revenues increased 7%, reflecting a 16% increase in Banking (including the losses on loan hedges). Excluding the impact of the losses on loan hedges, Banking revenues increased 12%, driven by solid growth across all products. Markets and securities services were largely unchanged, as growth in securities services revenues (increase of 8%) as well as the $580 million gain on the sale of a fixed income analytics business were offset by a 6% decrease in fixed income markets and a 2% decrease in equity markets revenues.
|
Within Banking:
|
|
• |
Investment banking revenues increased 20%, largely reflecting gains in wallet share across products and regions as well as an improvement from the industry-wide slowdown in activity levels during the first half of 2016, particularly in equity underwriting and advisory. Advisory revenues increased 11%, driven by North America and EMEA, reflecting wallet share gains and the increased market activity. Equity underwriting revenues increased 68%, driven by strength in North America and EMEA, due to significant wallet share gains as well as the increase in overall market activity. Debt underwriting revenues increased 13%, reflecting strength across regions, primarily driven by wallet share gains.
|
|
|
• |
Treasury and trade solutions revenues increased 7%, reflecting growth across all regions that was balanced across both net interest and fee income. The increase was primarily due to continued growth in transaction volumes with new and existing clients, continued growth in deposit balances and improved spreads in certain regions. The trade business experienced modest revenue growth, as continued focus on high-quality loan growth was largely offset by industry-wide tightening of spreads. Average deposit balances increased 4%, while average trade loans increased 5% (4% excluding the impact of FX translation).
|
|
|
• |
Corporate lending revenues increased 59%. Excluding the impact of losses on loans hedges, revenues increased 12%, driven by lower hedging costs and the absence of a prior-year adjustment to the residual value of a lease financing transaction.
|
|
|
• |
Private bank revenues increased 14%, reflecting strength across all regions and products. The increase in revenues was primarily due to higher loan and deposit volumes,
|
higher deposit spreads and increased managed investments and capital markets activity.
Within Markets and securities services:
|
|
• |
Fixed income markets revenues decreased 6%, with lower revenues in all regions, primarily due to low volatility as well as the comparison to higher revenues in the prior year from a more robust trading environment following the vote in the U.K. in favor of its withdrawal from the European Union, as well as the U.S. election. The decline in revenues was driven by lower net interest revenue (decreased 22%), largely due to higher funding costs and a change in the mix of trading positions in support of client activity. The decline was partially offset by higher principal transactions revenues and commissions and fees revenues.
|
Rates and currencies revenues decreased 5%, driven by lower G10 rates and currencies revenues. Despite the challenging trading environment, corporate client revenues in rates and currencies across the global network remained strong. Spread products and other fixed income revenues decreased 6%, due to a difficult trading environment in the current year given low volatility, driving lower credit markets and commodities revenues, particularly in North America, partially offset by higher municipals revenues, as well as higher securitized markets revenues.
|
|
• |
Equity markets revenues decreased 2%. Excluding an episodic loss in derivatives of approximately $130 million in the fourth quarter of 2017 related to a single client event, revenues increased 2%, as continued growth in prime finance and delta one client balances and higher investor client activity (particularly in EMEA and Asia) were partially offset by lower episodic activity with corporate clients in North America. Excluding the episodic loss in derivatives, equity derivatives revenues increased, driven by the stronger investor client activity. Cash equities revenues were modestly higher as well, driven by higher revenues in Asia, partially offset by lower cash commissions, as clients continued to move toward automated execution platforms across the industry.
|
|
|
• |
Securities services revenues increased 8%. Excluding the impact of the prior year’s divestiture of a private equity fund services business, revenues increased 12%, reflecting strength in all regions, driven by growth in client volumes and higher interest revenue due to a more favorable rate environment.
|
Expenses increased 3%, as higher compensation, volume-related expenses and investments were partially offset by efficiency savings.
Provisions improved $501 million, driven by a net loan loss release of $380 million (compared to a net release of $30 million in the prior year) and a 29% decline in net credit
losses. The increase in net loan loss reserve releases was driven by an improvement in the provision for unfunded lending commitments in the corporate loan portfolio, as well as a favorable credit environment, stability in commodity prices and continued improvement in the portfolio. The decline in net credit losses was largely driven by improvement in the energy sector, partially offset by the impact of the single client event in the fourth quarter noted above.
2016 vs. 2015
Net income increased 5%, primarily driven by lower expenses and lower cost of credit.
|
|
• |
Revenues were largely unchanged, reflecting higher revenues in Markets and securities services (increase of 6%), driven by fixed income markets, offset by lower revenues in Banking (decrease of 4% including the gains (losses) on loan hedges). Excluding the impact of the gains (losses) on loan hedges, Banking revenues increased 1%, driven by treasury and trade solutions and the private bank.
|
Within Banking:
|
|
• |
Investment banking revenues decreased 6%, largely reflecting the overall industry-wide slowdown in activity levels in equity underwriting and advisory during the first half of 2016. Advisory revenues decreased 9%, reflecting strong performance in 2015. Equity underwriting revenues decreased 31%, primarily reflecting the lower market activity. Debt underwriting revenues increased 5%, primarily due to higher market activity reflecting a favorable interest rate environment.
|
|
|
•
|
Treasury and trade solutions revenues increased 6%. Excluding the impact of FX translation, revenues increased 8%, reflecting growth across most regions. The increase was primarily due to continued growth in transaction volumes and deposit balances and improved spreads in certain regions. Trade revenues increased modestly due to loan growth as well as spread improvements. End-of-period deposit balances increased 5% (6% excluding the impact of FX translation), while average trade loans decreased 2% (1% excluding the impact of FX translation).
|
|
|
• |
Corporate lending revenues decreased 48%. Excluding the impact of gains (losses) on loan hedges, revenues decreased 6%. Excluding the impact of gains (losses) on loan hedges and FX translation, revenues decreased 1%, mostly reflecting the adjustment to the residual value of a lease financing transaction, spread compression and higher hedging costs, partially offset by higher average loans.
|
|
|
• |
Private bank revenues increased 5%, reflecting growth in loan volumes and improved deposit spreads, partially offset by lower capital markets activity and lower managed investments revenues.
|
Within Markets and securities services:
|
|
• |
Fixed income markets revenues increased 14%, with higher revenues in all regions, largely driven by both higher principal transactions revenues (up 22%) and other revenues (up 79%). The increase in principal transactions revenues was primarily due to higher rates and currencies revenues and higher spread products revenues. Other revenues increased mainly due to foreign currency losses in 2015. Rates and currencies revenues grew 22%, primarily due to the more favorable trading environment and higher client revenues following the vote in the U.K. and the U.S. election. Spread products and other fixed income revenues decreased 3%, due to lower securitized products revenues, driven by the impact of significantly lower liquidity in the market in the first quarter of 2016.
|
|
|
• |
Equity markets revenues declined 9%. Equity derivatives and prime finance revenues declined 13%, reflecting both a challenging trading environment across all regions driven by lower volatility compared to 2015, and a comparison to a more favorable trading environment in 2015 in Asia. The decline in equity markets revenue was also due to lower equity cash commissions driven by a continued shift to electronic trading and passive investing by clients across the industry.
|
|
|
• |
Securities services revenues increased 2%. Excluding the
|
impact of FX translation, revenues increased 5%, driven
by EMEA, primarily reflecting increased client activity, a
modest gain on the sale of a private equity fund services
business in the first quarter of 2016, higher deposit
volumes and improved spreads. The increase in revenues
was partially offset by the absence of revenues from
divestitures. Excluding the impact of FX translation and
divestitures, revenues increased 6%.
Expenses decreased 1% as a benefit from FX translation and efficiency savings were partially offset by higher compensation expense and higher repositioning charges.
Provisions decreased 49%, driven by a net loan loss reserve release of $30 million (compared to a net build of $748 million in the prior year). The significant decline in loan loss reserve builds was related to energy and energy-related exposures and was driven by stabilization of commodities as oil prices continued to recover from lows in early 2016. The decline in cost of credit was partially offset by higher net credit losses of $516 million (compared to $214 million in the prior year) mostly related to the energy and energy-related exposures, with a vast majority offset by the release of previously established loan loss reserves.
CORPORATE/OTHER
Corporate/Other includes certain unallocated costs of global staff functions (including finance, risk, human resources, legal and compliance), other corporate expenses and unallocated global operations and technology expenses, Corporate Treasury, certain North America and international legacy consumer loan portfolios, other legacy assets and discontinued operations (for additional information on Corporate/Other, see “Citigroup Segments” above). At December 31, 2017, Corporate/Other had $77 billion in assets, a decrease of 25% year-over-year and 23% from September 30, 2017. The decrease in assets included an approximate $20 billion decline in DTAs during the fourth quarter of 2017 due to the impact of Tax Reform.
|
|
|
|
|
|
|
|
|
|
|
|
|
|
|
In millions of dollars |
2017 |
2016 |
2015 |
% Change
2017 vs. 2016 |
% Change
2016 vs. 2015 |
Net interest revenue |
$ |
1,963 |
|
$ |
2,985 |
|
$ |
5,210 |
|
(34 |
)% |
(43 |
)% |
Non-interest revenue |
1,122 |
|
2,144 |
|
5,561 |
|
(48 |
) |
(61 |
) |
Total revenues, net of interest expense |
$ |
3,085 |
|
$ |
5,129 |
|
$ |
10,771 |
|
(40 |
)% |
(52 |
)% |
Total operating expenses |
$ |
3,786 |
|
$ |
4,977 |
|
$ |
7,329 |
|
(24 |
)% |
(32 |
)% |
Net credit losses |
149 |
|
435 |
|
1,336 |
|
(66 |
)% |
(67 |
)% |
Credit reserve build (release) |
(317 |
) |
(456 |
) |
(453 |
) |
30 |
% |
(1 |
)% |
Provision (release) for unfunded lending commitments |
— |
|
(8 |
) |
(24 |
) |
100 |
% |
67 |
% |
Provision for benefits and claims |
(7 |
) |
98 |
|
623 |
|
NM |
|
(84 |
)% |
Provisions for loan losses and for benefits and claims |
$ |
(175 |
) |
$ |
69 |
|
$ |
1,482 |
|
NM |
|
(95 |
)% |
Income (loss) from continuing operations before taxes |
$ |
(526 |
) |
$ |
83 |
|
$ |
1,960 |
|
NM |
|
(96 |
)% |
Income taxes (benefits) |
19,060 |
|
(471 |
) |
(102 |
) |
NM |
|
NM |
|
Income (loss) from continuing operations |
$ |
(19,586 |
) |
$ |
554 |
|
$ |
2,062 |
|
NM |
|
(73 |
)% |
Income (loss) from discontinued operations, net of taxes |
(111 |
) |
(58 |
) |
(54 |
) |
(91 |
)% |
(7 |
) |
Net income (loss) before attribution of noncontrolling interests |
$ |
(19,697 |
) |
$ |
496 |
|
$ |
2,008 |
|
NM |
|
(75 |
)% |
Noncontrolling interests |
(6 |
) |
(2 |
) |
29 |
|
NM |
|
NM |
|
Net income (loss) |
$ |
(19,691 |
) |
$ |
498 |
|
$ |
1,979 |
|
NM |
|
(75 |
)% |
NM Not meaningful
2017 vs. 2016
The net loss was $19.7 billion in 2017, compared to net income of $498 million in the prior year, primarily driven by the estimated $19.8 billion non-cash charge recorded in the tax line due to the impact of Tax Reform (for additional information, see “Impact of Tax Reform” above). Excluding the impact of Tax Reform, net income declined 69% to $153 million, reflecting lower revenues, partially offset by lower expenses and lower cost of credit.
Revenues declined 40%, primarily reflecting the continued wind-down of legacy assets and the absence of gains related to debt buybacks in 2016. Revenues included approximately $750 million in gains on asset sales in the first quarter of 2017, which more than offset a roughly $300 million charge related to the exit of Citi’s U.S. mortgage servicing operations in the quarter.
Expenses declined 24%, reflecting the wind-down of legacy assets and lower legal expenses, partially offset by approximately $100 million in episodic expenses primarily related to the exit of the U.S. mortgage servicing operations. Also included in expenses is an approximately $255 million provision for remediation costs related to a CARD Act matter (for additional information, see “North America GCB” above and Note 27 to the Consolidated Financial Statements). Citi believes the aggregate approximately $335 million provision (including the $80 million provision in North America GCB) to be sufficient for Citi’s planned remediation.
Provisions decreased $244 million to a net benefit of $175 million, primarily due to lower net credit losses and a lower provision for benefits and claims, partially offset by a lower net loan loss reserve release. Net credit losses declined 66% to $149 million, primarily reflecting the impact of ongoing divestiture activity and the continued wind-down of the North America mortgage portfolio. The provision for benefits and claims declined by $105 million, primarily due to lower insurance activity. The net reserve release declined by $147 million to $317 million, and reflected the continued wind-down of the legacy North America mortgage portfolio and divestitures.
2016 vs. 2015
Net income was $498 million, compared to net income of $2.0 billion in 2015, primarily reflecting lower revenues and a higher effective tax rate in 2016 due to the absence of certain tax benefits in 2015.
Revenues decreased 52%, primarily driven by the overall wind-down of legacy assets and lower net gains on sales, particularly the sales of OneMain Financial and the retail banking and credit cards businesses in Japan in the fourth quarter of 2015.
Expenses decreased 32%, reflecting the sales and run-off of assets, lower legal and related expenses and lower repositioning costs.
Provisions decreased 95% due to lower net credit losses and a lower provision for benefits and claims (decrease of 84%) due to lower insurance activity. Net credit losses declined 67%, primarily due to the impact of divestitures and continued credit improvements in North America mortgages.
Payment Protection Insurance (PPI)
The selling of PPI by financial institutions in the U.K. has been the subject of intense review and focus by U.K. regulators and the U.K. Supreme Court.
PPI is designed to cover a customer’s loan repayments if certain events occur, such as long-term illness or unemployment. The U.K. Financial Conduct Authority (FCA) found certain problems across the industry with how these products were sold, including customers not realizing that the cost of PPI premiums was being added to their loan or PPI being unsuitable for the customer. Redress generally involves the repayment of premiums and the refund of all applicable contractual interest, together with compensatory interest of 8%.
In addition, during the fourth quarter of 2014, the U.K. Supreme Court issued a ruling in a case (Plevin) involving PPI pursuant to which the court ruled, independent of the sale of the PPI contract, that the PPI contract at issue in the case was “unfair” due to the high sales commissions earned and the lack of disclosure to the customer thereof.
In addition, the FCA released a policy statement related to PPI that (i) set a deadline of August 29, 2019 by which consumers must file PPI claims, (ii) provides for the launch of FCA-led marketing campaigns to inform consumers of this deadline, (iii) set new rules and guidance for the handling of PPI complaints in light of the Supreme Court’s decision on Plevin and (iv) requires all firms to contact all previously rejected customers who may be able to complain under the new “Plevin” rule (the Plevin Customer Contact Exercise). Citi completed the Plevin Customer Contact Exercise during the fourth quarter of 2017. The FCA-led marketing campaigns began in August 2017 and will continue through the August 2019 deadline. The level of PPI claims also continues to be influenced by the solicitation activity of Claims Management Companies (CMCs).
During 2017, Citi increased its PPI reserves by approximately $109 million (with $105 million recorded in Corporate/Other and $4 million recorded in Discontinued operations). The increase for full-year 2017 compared to an increase of $134 million during 2016 and was primarily due to the ongoing level of PPI claims.
Citi’s year-end 2017 PPI reserve was $213 million, compared to $228 million as of December 31, 2016.
Additional reserving actions, if any, in 2018 will largely depend on the level of customer claims in response to the FCA-led marketing campaigns and the level of ongoing CMC activity.
OFF-BALANCE SHEET ARRANGEMENTS
Citigroup enters into various types of off-balance sheet arrangements in the ordinary course of business. Citi’s involvement in these arrangements can take many different forms, including without limitation:
|
|
• |
purchasing or retaining residual and other interests in unconsolidated special purpose entities, such as mortgage-backed and other asset-backed securitization entities; |
|
|
• |
holding senior and subordinated debt, interests in limited and general partnerships and equity interests in other unconsolidated special purpose entities; |
|
|
• |
providing guarantees, indemnifications, loan commitments, letters of credit and representations and warranties; and |
|
|
• |
entering into operating leases for property and equipment. |
Citi enters into these arrangements for a variety of business purposes. For example, securitization arrangements offer investors access to specific cash flows and risks created through the securitization process. Securitization arrangements also assist Citi and its customers in monetizing their financial assets and securing financing at more favorable rates than Citi or the customers could otherwise obtain.
The table below shows where a discussion of Citi’s various off-balance sheet arrangements may be found in this Form 10-K. In addition, see Note 1 to the Consolidated Financial Statements.
Types of Off-Balance Sheet Arrangements Disclosures in this Form 10-K
|
|
|
Variable interests and other obligations, including contingent obligations, arising from variable interests in nonconsolidated VIEs |
See Note 21 to the Consolidated Financial Statements. |
Letters of credit, and lending and other commitments |
See Note 26 to the Consolidated Financial Statements. |
Guarantees |
See Note 26 to the Consolidated Financial Statements. |
Leases |
See Note 26 to the Consolidated Financial Statements. |
CONTRACTUAL OBLIGATIONS
The following table includes information on Citigroup’s contractual obligations, as specified and aggregated pursuant to SEC requirements:
|
|
|
|
|
|
|
|
|
|
|
|
|
|
|
|
|
|
|
|
|
|
|
|
Contractual obligations by year |
|
In millions of dollars |
2018 |
2019 |
2020 |
2021 |
2022 |
Thereafter |
Total |
Long-term debt obligations—principal(1)
|
$ |
53,478 |
|
$ |
36,289 |
|
$ |
23,188 |
|
$ |
21,019 |
|
$ |
12,364 |
|
$ |
90,371 |
|
$ |
236,709 |
|
Long-term debt obligations—interest payments(2)
|
7,496 |
|
5,894 |
|
4,832 |
|
4,043 |
|
3,447 |
|
33,955 |
|
59,667 |
|
Operating and capital lease obligations |
968 |
|
837 |
|
676 |
|
568 |
|
469 |
|
2,593 |
|
6,111 |
|
Purchase obligations(3)
|
407 |
|
347 |
|
358 |
|
318 |
|
316 |
|
1,147 |
|
2,893 |
|
Other liabilities(4)
|
34,180 |
|
498 |
|
93 |
|
87 |
|
80 |
|
1,794 |
|
36,732 |
|
Total |
$ |
96,529 |
|
$ |
43,865 |
|
$ |
29,147 |
|
$ |
26,035 |
|
$ |
16,676 |
|
$ |
129,860 |
|
$ |
342,112 |
|
|
|
(1) |
For additional information about long-term debt obligations, see “Liquidity Risk—Long-Term Debt” below and Note 17 to the Consolidated Financial Statements. |
|
|
(2) |
Contractual obligations related to interest payments on long-term debt for 2018–2022 are calculated by applying the December 31, 2017 weighted-average interest rate (3.57%) on average outstanding long-term debt to the average remaining contractual obligations on long-term debt for each of those years. The “Thereafter” interest payments on long-term debt for the remaining years to maturity (2023–2098) are calculated by applying current interest rates on the remaining contractual obligations on long-term debt for each of those years.
|
|
|
(3) |
Purchase obligations consist of obligations to purchase goods or services that are enforceable and legally binding on Citi. For presentation purposes, purchase obligations are included in the table above through the termination date of the respective agreements, even if the contract is renewable. Many of the purchase agreements for goods or services include clauses that would allow Citi to cancel the agreement with specified notice, however, that impact is not included in the table above (unless Citi has already notified the counterparty of its intention to terminate the agreement). |
|
|
(4) |
Other liabilities reflected on Citigroup’s Consolidated Balance Sheet includes accounts payable, accrued expenses, uncertain tax positions and other liabilities that have been incurred and will ultimately be paid in cash; legal reserve accruals are not included in the table above. Also includes discretionary contributions in 2018 for Citi’s employee-defined benefit obligations for the pension, postretirement and post employment plans and defined contribution plans.
|
CAPITAL RESOURCES
Overview
Capital is used principally to support assets in Citi’s businesses and to absorb credit, market and operational losses. Citi primarily generates capital through earnings from its operating businesses. Citi may augment its capital through issuances of common stock, noncumulative perpetual preferred stock and equity issued through awards under employee benefit plans, among other issuances. Further, Citi’s capital levels may also be affected by changes in accounting and regulatory standards, as well as U.S. corporate tax laws and the impact of future events on Citi’s business results, such as changes in interest and foreign exchange rates, as well as business and asset dispositions.
During 2017, Citi returned a total of $17.1 billion of capital to common shareholders in the form of share repurchases (approximately 214 million common shares) and dividends.
Capital Management
Citi’s capital management framework is designed to ensure that Citigroup and its principal subsidiaries maintain sufficient capital consistent with each entity’s respective risk profile, management targets and all applicable regulatory standards and guidelines. Citi assesses its capital adequacy against a series of internal quantitative capital goals, designed to evaluate the Company’s capital levels in expected and stressed economic environments. Underlying these internal quantitative capital goals are strategic capital considerations, centered on preserving and building financial strength. The Citigroup Capital Committee, with oversight from the Risk Management Committee of Citigroup’s Board of Directors, has responsibility for Citi’s aggregate capital structure, including the capital assessment and planning process, which is integrated into Citi’s capital plan. Balance sheet management, including oversight of capital adequacy, for Citigroup’s subsidiaries is governed by each entity’s Asset and Liability Committee, where applicable. For additional information regarding Citi’s capital planning and stress testing exercises, see “Stress Testing—Component of Capital Planning” below.
Current Regulatory Capital Standards
Citi is subject to regulatory capital standards issued by the Federal Reserve Board, which constitute the U.S. Basel III rules. These rules establish an integrated capital adequacy framework, encompassing both risk-based capital ratios and leverage ratios.
Risk-Based Capital Ratios
The U.S. Basel III rules set forth the composition of regulatory capital (including the application of regulatory capital adjustments and deductions), as well as two comprehensive methodologies (a Standardized Approach and Advanced Approaches) for measuring total risk-weighted assets. Total risk-weighted assets under the Advanced Approaches, which are primarily models based, include credit, market, and operational risk-weighted assets. Conversely, the Standardized Approach excludes operational risk-weighted assets and generally applies prescribed supervisory risk weights to broad categories of credit risk exposures. As a result, credit risk-weighted assets calculated under the Advanced Approaches are more risk sensitive than those calculated under the Standardized Approach. Market risk-weighted assets are derived on a generally consistent basis under both approaches.
The U.S. Basel III rules establish stated minimum Common Equity Tier 1 Capital, Tier 1 Capital and Total Capital ratios for substantially all U.S. banking organizations, including Citi and Citibank, N.A. (Citibank). Moreover, these rules provide for both a fixed Capital Conservation Buffer and, for Advanced Approaches banking organizations, such as Citi and Citibank, also a discretionary Countercyclical Capital Buffer. These capital buffers would be available to absorb losses in advance of any potential impairment of regulatory capital below the stated minimum risk-based capital ratio requirements. In December 2017, the Federal Reserve Board voted to affirm the Countercyclical Capital Buffer amount at the current level of 0%.
Further, the U.S. Basel III rules implement the “capital floor provision” of the so-called “Collins Amendment” of the Dodd-Frank Act, which requires Advanced Approaches
banking organizations to calculate each of the three risk-based capital ratios (Common Equity Tier 1 Capital, Tier 1 Capital, and Total Capital) under both the U.S. Basel III Standardized Approach and the Advanced Approaches and publicly report (as well as measure compliance against) the lower of each of the resulting risk-based capital ratios.
GSIB Surcharge
The Federal Reserve Board imposes a risk-based capital surcharge upon U.S. bank holding companies that are identified as global systemically important bank holding companies (GSIBs), including Citi. The GSIB surcharge augments the Capital Conservation Buffer and, if invoked, any Countercyclical Capital Buffer, and would result in restrictions on earnings distributions (e.g., dividends, equity repurchases, and discretionary executive bonuses) should the expanded buffer be breached to absorb losses during periods of financial or economic stress, with the degree of such restrictions based upon the extent to which the expanded buffer is breached.
Under the Federal Reserve Board’s rule, identification of a GSIB is based primarily on quantitative measurement indicators underlying five equally weighted broad categories of systemic importance: (i) size, (ii) interconnectedness, (iii) cross-jurisdictional activity, (iv) substitutability, and (v) complexity. With the exception of size, each of the other categories are composed of multiple indicators also of equal weight, and amounting to 12 indicators in total.
A U.S. bank holding company that is designated a GSIB under the established methodology is required, on an annual basis, to calculate a surcharge using two methods and will be subject to the higher of the resulting two surcharges. The first method (“method 1”) is based on the same five broad categories of systemic importance used to identify a GSIB. Under the second method (“method 2”), the substitutability category is replaced with a quantitative measure intended to assess the extent of a GSIB’s reliance on short-term wholesale funding. Moreover, method 1 incorporates relative measures of systemic importance across certain global banking organizations and a year-end spot foreign exchange rate, whereas method 2 uses fixed measures of systemic importance and application of an average foreign exchange rate over a three-year period. Effective for 2017 and thereafter, the GSIB surcharges calculated under both method 1 and method 2 are based on measures of systemic importance from the year immediately preceding that in which the GSIB surcharge calculations are being performed (e.g., the method 1 and method 2 GSIB surcharges to be calculated by December 31, 2017 will be based on 2016 systemic indicator data). Generally, the surcharge derived under method 2 will result in a higher surcharge than derived under method 1.
Should a GSIB’s systemic importance change year-over-year such that it becomes subject to a higher surcharge, the higher surcharge would not become effective for a full year (e.g., a higher surcharge calculated by December 31, 2018 would not become effective until January 1, 2020). However, if a GSIB’s systemic importance changes such that the GSIB would be subject to a lower surcharge, the GSIB would be subject to the lower surcharge beginning with the next calendar year (e.g., a lower surcharge calculated by December 31, 2018 would become effective January 1, 2019).
The following table sets forth Citi’s GSIB surcharge as derived under method 1 and method 2 for 2017 and 2016.
|
|
|
|
|
|
|
2017 |
2016 |
Method 1 |
2.0 |
% |
2.0 |
% |
Method 2 |
3.0 |
|
3.5 |
|
Citi’s GSIB surcharge effective for 2017 and 2016 was 3.0% and 3.5%, respectively, as derived under the higher method 2 result. Citi’s GSIB surcharge effective for 2018 will remain unchanged at 3.0%, as derived under the higher method 2 result. Citi expects that its method 2 GSIB surcharge will continue to remain higher than its method 1 GSIB surcharge, and as such Citi’s GSIB surcharge effective for 2019 will not exceed 3.0%, and Citi’s GSIB surcharge effective for 2020 is not expected to exceed 3.0%.
Transition Provisions
The U.S. Basel III rules contain several differing, largely multi-year transition provisions (i.e., “phase-ins” and “phase-outs”), including with respect to substantially all regulatory capital adjustments and deductions, and non-qualifying Tier 1 and Tier 2 Capital instruments (such as non-grandfathered trust preferred securities and certain subordinated debt issuances). Moreover, the GSIB surcharge, Capital Conservation Buffer, and any Countercyclical Capital Buffer (currently 0%), commenced phase-in on January 1, 2016, becoming fully effective on January 1, 2019. With the exception of the non-grandfathered trust preferred securities, which do not fully phase-out until January 1, 2022, and the capital buffers and GSIB surcharge, which do not fully phase-in until January 1, 2019, all other transition provisions will be entirely reflected in Citi’s regulatory capital ratios by January 1, 2018. Citi considers all of these transition provisions as being fully implemented on January 1, 2019 (full implementation), with the inclusion of the capital buffers and GSIB surcharge.
The following chart sets forth the transitional progression from January 1, 2016 to full implementation by January 1, 2019 of the regulatory capital components (i.e., inclusive of the mandatory 2.5% Capital Conservation Buffer and the Countercyclical Capital Buffer at its current level of 0%, as well as an estimated 3.0% GSIB surcharge) comprising the effective minimum risk-based capital ratios.
|
|
Basel III Transition Arrangements: Minimum Risk-Based Capital Ratios |
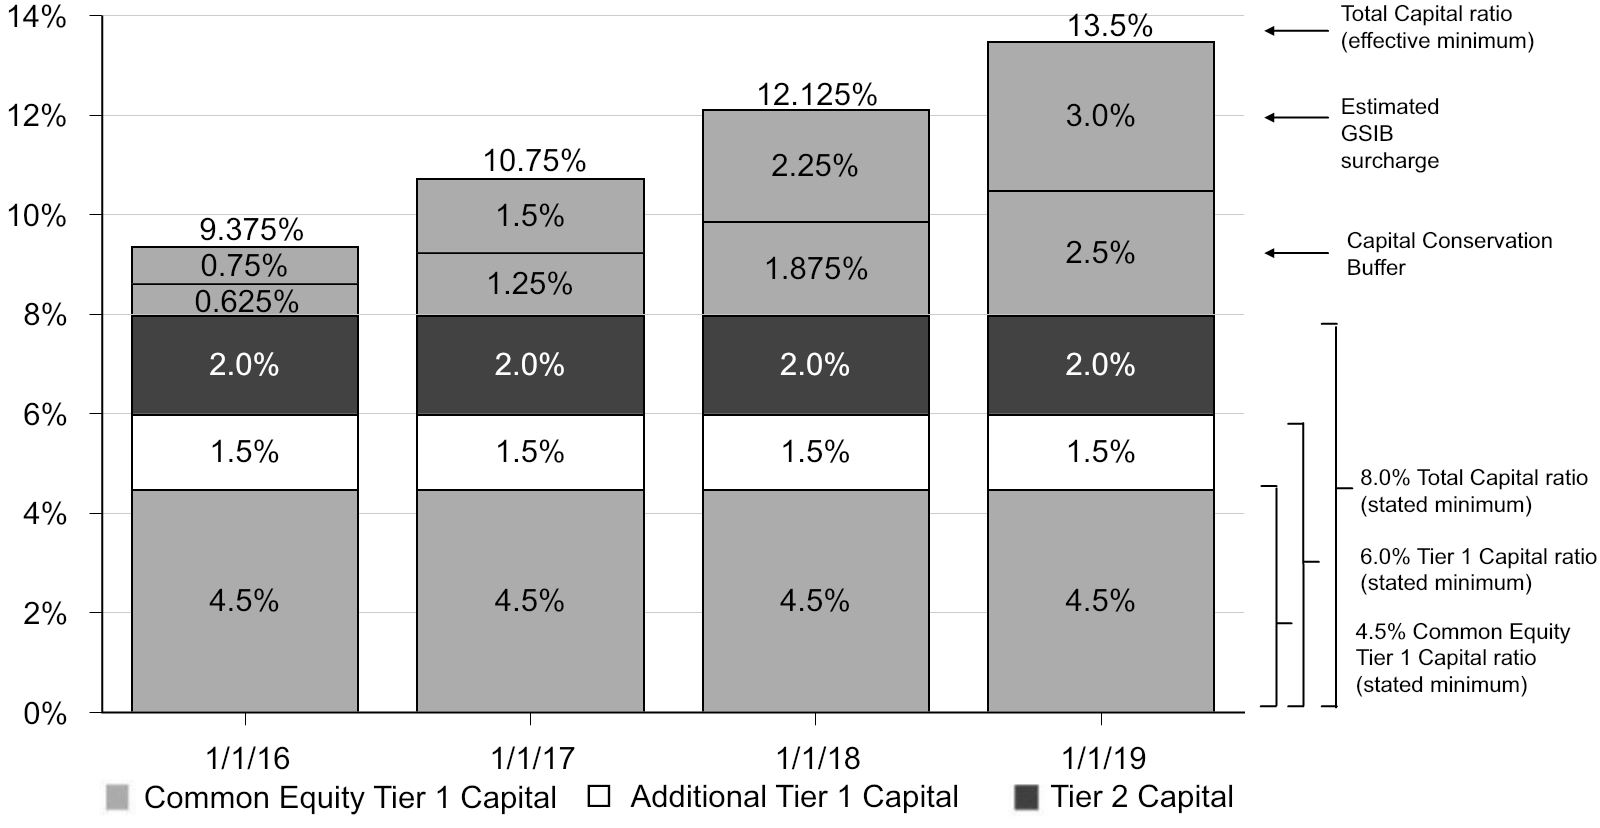
The following chart presents the transition arrangements (phase-in and phase-out) from January 1, 2016 through January 1, 2018 under the U.S. Basel III rules for significant regulatory capital adjustments and deductions relative to Citi.
|
|
Basel III Transition Arrangements: Significant Regulatory Capital Adjustments and Deductions |
|
|
|
|
|
|
|
|
|
January 1, |
|
2016 |
2017 |
2018 |
Phase-in of Significant Regulatory Capital Adjustments and Deductions |
|
|
|
|
|
|
|
Common Equity Tier 1 Capital(1)
|
60 |
% |
80 |
% |
100 |
% |
|
|
|
|
Common Equity Tier 1 Capital(2)
|
60 |
% |
80 |
% |
100 |
% |
Additional Tier 1 Capital(2)
|
40 |
% |
20 |
% |
0 |
% |
|
100 |
% |
100 |
% |
100 |
% |
|
|
|
|
Phase-out of Significant AOCI Regulatory Capital Adjustments |
|
|
|
|
|
|
|
Common Equity Tier 1 Capital(3)
|
40 |
% |
20 |
% |
0 |
% |
|
|
(1) |
Includes the phase-in of Common Equity Tier 1 Capital deductions for all intangible assets other than goodwill and mortgage servicing rights (MSRs); and excess over 10%/15% limitations for deferred tax assets (DTAs) arising from temporary differences, significant common stock investments in unconsolidated financial institutions and MSRs. Goodwill (including goodwill “embedded” in the valuation of significant common stock investments in unconsolidated financial institutions) is fully deducted in arriving at Common Equity Tier 1 Capital. The amount of all other intangible assets, aside from MSRs, not deducted in arriving at Common Equity Tier 1 Capital are risk-weighted at 100%, as are the excess over the 10%/15% limitations for DTAs arising from temporary differences, significant common stock investments in unconsolidated financial institutions and MSRs through December 31, 2017. Commencing January 1, 2018, the amount of temporary difference DTAs, significant common stock investments in unconsolidated financial institutions and MSRs not deducted in arriving at Common Equity Tier 1 Capital are risk-weighted at 250%. |
|
|
(2) |
Includes the phase-in of the Common Equity Tier 1 Capital and Additional Tier 1 Capital adjustment for cumulative unrealized net gains (losses) related to changes in fair value of financial liabilities attributable to Citi’s own creditworthiness; and the phase-in of Common Equity Tier 1 Capital and Additional Tier 1 Capital deductions related to DTAs arising from net operating loss, foreign tax credit and general business credit carry-forwards and defined benefit pension plan net assets; |
|
|
(3) |
Includes the phase-out from Common Equity Tier 1 Capital of adjustments related to net unrealized gains (losses) on available-for-sale (AFS) debt securities; unrealized gains on AFS equity securities; net unrealized gains (losses) on held-to-maturity (HTM) securities included in Accumulated other comprehensive income (loss) (AOCI); and defined benefit plans liability adjustment.
|
Tier 1 Leverage Ratio
Under the U.S. Basel III rules, Citi, as with principally all U.S. banking organizations, is also required to maintain a minimum Tier 1 Leverage ratio of 4.0%. The Tier 1 Leverage ratio, a non-risk-based measure of capital adequacy, is defined as Tier 1 Capital as a percentage of quarterly adjusted average total assets less amounts deducted from Tier 1 Capital.
Supplementary Leverage Ratio
Advanced Approaches banking organizations are additionally required to calculate a Supplementary Leverage ratio, which significantly differs from the Tier 1 Leverage ratio by also including certain off-balance sheet exposures within the denominator of the ratio (Total Leverage Exposure). The Supplementary Leverage ratio represents end of period Tier 1 Capital to Total Leverage Exposure, with the latter defined as the sum of the daily average of on-balance sheet assets for the quarter and the average of certain off-balance sheet exposures calculated as of the last day of each month in the quarter, less applicable Tier 1 Capital deductions. Effective January 1, 2018, Advanced Approaches banking organizations are required to maintain a stated minimum Supplementary Leverage ratio of 3.0%.
Further, U.S. GSIBs, and their subsidiary insured depository institutions, including Citi and Citibank, are subject to enhanced Supplementary Leverage ratio standards. The enhanced Supplementary Leverage ratio standards establish a 2.0% leverage buffer for U.S. GSIBs in addition to the stated 3.0% minimum Supplementary Leverage ratio requirement in the U.S. Basel III rules. If a U.S. GSIB fails to exceed the 2.0% leverage buffer, it will be subject to increasingly onerous restrictions (depending upon the extent of the shortfall) regarding capital distributions and discretionary executive bonus payments. Accordingly, U.S. GSIBs are effectively subject to a 5.0% minimum Supplementary Leverage ratio requirement. Citi is required to be compliant with this higher effective minimum ratio requirement on January 1, 2018.
Prompt Corrective Action Framework
The U.S. Basel III rules revised the Prompt Corrective Action (PCA) regulations applicable to insured depository institutions in certain respects.
In general, the PCA regulations direct the U.S. banking agencies to enforce increasingly strict limitations on the activities of insured depository institutions that fail to meet certain regulatory capital thresholds. The PCA framework contains five categories of capital adequacy as measured by risk-based capital and leverage ratios: (i) “well capitalized,”
(ii) “adequately capitalized,” (iii) undercapitalized,” (iv) “significantly undercapitalized,” and (v) “critically undercapitalized.”
Accordingly, an insured depository institution, such as Citibank, must maintain minimum Common Equity Tier 1 Capital, Tier 1 Capital, Total Capital, and Tier 1 Leverage ratios of 6.5%, 8.0%, 10.0% and 5.0%, respectively, to be considered “well capitalized.” Additionally, insured depository institution subsidiaries of U.S. GSIBs, such as Citibank, must maintain a minimum Supplementary Leverage ratio of 6.0%, effective January 1, 2018, to be considered “well capitalized.”
Stress Testing Component of Capital Planning
Citi is subject to an annual assessment by the Federal Reserve Board as to whether Citigroup has effective capital planning processes as well as sufficient regulatory capital to absorb losses during stressful economic and financial conditions, while also meeting obligations to creditors and counterparties and continuing to serve as a credit intermediary. This annual assessment includes two related programs:
|
|
• |
The Comprehensive Capital Analysis and Review (CCAR) evaluates Citi’s capital adequacy, capital adequacy process, and its planned capital distributions, such as dividend payments and common stock repurchases. As part of CCAR, the Federal Reserve Board assesses whether Citi has sufficient capital to continue operations throughout times of economic and financial market stress and whether Citi has robust, forward-looking capital planning processes that account for its unique risks. The Federal Reserve Board may object to Citi’s annual capital plan based on either quantitative or qualitative grounds. If the Federal Reserve Board objects to Citi’s annual capital plan, Citi may not undertake any capital distribution unless the Federal Reserve Board indicates in writing that it does not object to the distribution. |
|
|
• |
Dodd-Frank Act Stress Testing (DFAST) is a forward-looking quantitative evaluation of the impact of stressful economic and financial market conditions on Citi’s regulatory capital. This program serves to inform the Federal Reserve Board, the financial companies, and the general public, how Citi’s regulatory capital ratios might change using a hypothetical set of adverse economic conditions as designed by the Federal Reserve Board. In addition to the annual supervisory stress test conducted by the Federal Reserve Board, Citi is required to conduct annual company-run stress tests under the same adverse economic conditions designed by the Federal Reserve Board, as well as conduct a mid-cycle stress test under company-developed scenarios. |
Both CCAR and DFAST include an estimate of projected revenues, losses, reserves, pro forma regulatory capital ratios, and any other additional capital measures deemed relevant by Citi. Projections are required over a nine-quarter planning horizon under three supervisory scenarios (baseline, adverse and severely adverse conditions). All risk-based capital ratios reflect application of the Standardized Approach framework and the transition arrangements under the U.S. Basel III rules. Moreover, the Federal Reserve Board has deferred the use of the Advanced Approaches framework indefinitely. Beginning in 2018, CCAR incorporates the Supplementary Leverage ratio. Accordingly, Advanced Approaches banking organizations are required to demonstrate an ability to maintain a Supplementary Leverage ratio in excess of the stated minimum requirement for all quarters of the 2018 CCAR planning horizon.
For additional information regarding CCAR, see “Risk Factors—Strategic Risks” below.
Citigroup’s Capital Resources Under Current Regulatory Standards
Citi is required to maintain stated minimum Common Equity Tier 1 Capital, Tier 1 Capital and Total Capital ratios of 4.5%, 6.0% and 8.0%, respectively.
Citi’s effective minimum Common Equity Tier 1 Capital, Tier 1 Capital and Total Capital ratios during 2017, inclusive of the 50% phase-in of both the 2.5% Capital Conservation Buffer and the 3.0% GSIB surcharge (all of which is to be composed of Common Equity Tier 1 Capital), are 7.25%, 8.75% and 10.75%, respectively. Citi’s effective minimum Common Equity Tier 1 Capital, Tier 1 Capital and Total Capital ratios during 2016, inclusive of the 25% phase-in of both the 2.5% Capital Conservation Buffer and the 3.5% GSIB surcharge (all of which is to be composed of Common Equity Tier 1 Capital), were 6.0%, 7.5% and 9.5%, respectively.
Furthermore, to be “well capitalized” under current federal bank regulatory agency definitions, a bank holding
company must have a Tier 1 Capital ratio of at least 6.0%, a Total Capital ratio of at least 10.0%, and not be subject to a Federal Reserve Board directive to maintain higher capital levels.
The following tables set forth the capital tiers, total risk-weighted assets and underlying risk components, risk-based capital ratios, quarterly adjusted average total assets, Total Leverage Exposure and leverage ratios under current regulatory standards (reflecting Basel III Transition Arrangements) for Citi as of December 31, 2017 and December 31, 2016.
Citigroup Capital Components and Ratios Under Current Regulatory Standards (Basel III Transition Arrangements)
|
|
|
|
|
|
|
|
|
|
|
|
|
|
|
|
December 31, 2017 |
|
December 31, 2016 |
In millions of dollars, except ratios |
Advanced Approaches |
Standardized Approach |
|
Advanced Approaches |
Standardized Approach |
Common Equity Tier 1 Capital |
$ |
147,891 |
|
$ |
147,891 |
|
|
$ |
167,378 |
|
$ |
167,378 |
|
Tier 1 Capital |
164,841 |
|
164,841 |
|
|
178,387 |
|
178,387 |
|
Total Capital (Tier 1 Capital + Tier 2 Capital)(1)
|
190,331 |
|
202,284 |
|
|
202,146 |
|
214,938 |
|
Total Risk-Weighted Assets |
1,134,864 |
|
1,138,167 |
|
|
1,166,764 |
|
1,126,314 |
|
Credit Risk(1)
|
$ |
749,322 |
|
$ |
1,072,440 |
|
|
$ |
773,483 |
|
$ |
1,061,786 |
|
Market Risk |
65,003 |
|
65,727 |
|
|
64,006 |
|
64,528 |
|
Operational Risk |
320,539 |
|
— |
|
|
329,275 |
|
— |
|
Common Equity Tier 1 Capital ratio(2)
|
13.03 |
% |
12.99 |
% |
|
14.35 |
% |
14.86 |
% |
Tier 1 Capital ratio(2)
|
14.53 |
|
14.48 |
|
|
15.29 |
|
15.84 |
|
Total Capital ratio(2)
|
16.77 |
|
17.77 |
|
|
17.33 |
|
19.08 |
|
|
|
|
|
|
|
|
|
|
|
|
In millions of dollars, except ratios |
December 31, 2017 |
|
December 31, 2016 |
Quarterly Adjusted Average Total Assets(3)
|
|
$ |
1,869,206 |
|
|
|
$ |
1,768,415 |
|
Total Leverage Exposure(4)
|
|
2,433,371 |
|
|
|
2,351,883 |
|
Tier 1 Leverage ratio |
|
8.82 |
% |
|
|
10.09 |
% |
Supplementary Leverage ratio |
|
6.77 |
|
|
|
7.58 |
|
|
|
(1) |
Under the U.S. Basel III rules, credit risk-weighted assets during the transition period reflect the effects of transition arrangements related to regulatory capital adjustments and deductions and, as a result, will differ from credit risk-weighted assets derived under full implementation of the rules. |
|
|
(2) |
As of December 31, 2017, Citi’s reportable Common Equity Tier 1 Capital and Tier 1 Capital ratios were the lower derived under the Basel III Standardized Approach, whereas the reportable Total Capital ratio was the lower derived under the Basel III Advanced Approaches framework. As of December 31, 2016, Citi’s reportable Common Equity Tier 1 Capital, Tier 1 Capital, and Total Capital ratios were the lower derived under the Basel III Advanced Approaches framework.
|
|
|
(3) |
Tier 1 Leverage ratio denominator. |
|
|
(4) |
Supplementary Leverage ratio denominator. |
As indicated in the table above, Citigroup’s capital ratios at December 31, 2017 were in excess of the stated and effective minimum requirements under the U.S. Basel III rules. In addition, Citi was also “well capitalized” under current federal bank regulatory agency definitions as of December 31, 2017.
Components of Citigroup Capital Under Current Regulatory Standards (Basel III Transition Arrangements)
|
|
|
|
|
|
|
|
In millions of dollars |
December 31,
2017 |
December 31,
2016 |
Common Equity Tier 1 Capital |
|
|
Citigroup common stockholders’ equity(1)
|
$ |
181,671 |
|
$ |
206,051 |
|
Add: Qualifying noncontrolling interests |
224 |
|
259 |
|
Regulatory Capital Adjustments and Deductions: |
|
|
Less: Net unrealized losses on securities available-for-sale (AFS), net of tax(2)(3)
|
(232 |
) |
(320 |
) |
Less: Defined benefit plans liability adjustment, net of tax(3)
|
(1,237 |
) |
(2,066 |
) |
Less: Accumulated net unrealized losses on cash flow hedges, net of tax(4)
|
(698 |
) |
(560 |
) |
|
Less: Cumulative unrealized net loss related to changes in fair value of financial liabilities
attributable to own creditworthiness, net of tax(3)(5)
|
(577 |
) |
(37 |
) |
Less: Intangible assets: |
|
|
Goodwill, net of related deferred tax liabilities (DTLs)(6)
|
22,052 |
|
20,858 |
|
|
Identifiable intangible assets other than mortgage servicing rights (MSRs), net of related
DTLs(3)
|
3,521 |
|
2,926 |
|
Less: Defined benefit pension plan net assets(3)
|
717 |
|
514 |
|
|
Less: Deferred tax assets (DTAs) arising from net operating loss, foreign tax credit and
general business credit carry-forwards(3)(7)
|
10,458 |
|
12,802 |
|
|
Less: Excess over 10%/15% limitations for other DTAs, certain common stock investments,
and MSRs(3)(7)(8)
|
— |
|
4,815 |
|
Total Common Equity Tier 1 Capital (Standardized Approach and Advanced Approaches) |
$ |
147,891 |
|
$ |
167,378 |
|
Additional Tier 1 Capital |
|
|
Qualifying noncumulative perpetual preferred stock(1)
|
$ |
19,069 |
|
$ |
19,069 |
|
Qualifying trust preferred securities(9)
|
1,377 |
|
1,371 |
|
Qualifying noncontrolling interests |
105 |
|
17 |
|
Regulatory Capital Adjustment and Deductions: |
|
|
|
Less: Cumulative unrealized net loss related to changes in fair value of financial liabilities
attributable to own creditworthiness, net of tax(3)(5)
|
(144 |
) |
(24 |
) |
Less: Defined benefit pension plan net assets(3)
|
179 |
|
343 |
|
|
Less: DTAs arising from net operating loss, foreign tax credit and
general business credit carry-forwards(3)(7)
|
2,614 |
|
8,535 |
|
Less: Permitted ownership interests in covered funds(10)
|
900 |
|
533 |
|
Less: Minimum regulatory capital requirements of insurance underwriting subsidiaries(11)
|
52 |
|
61 |
|
Total Additional Tier 1 Capital (Standardized Approach and Advanced Approaches) |
$ |
16,950 |
|
$ |
11,009 |
|
|
Total Tier 1 Capital (Common Equity Tier 1 Capital + Additional Tier 1 Capital)
(Standardized Approach and Advanced Approaches)
|
$ |
164,841 |
|
$ |
178,387 |
|
Tier 2 Capital |
|
|
Qualifying subordinated debt |
$ |
23,673 |
|
$ |
22,818 |
|
Qualifying trust preferred securities(12)
|
329 |
|
317 |
|
Qualifying noncontrolling interests |
40 |
|
22 |
|
Eligible allowance for credit losses(13)
|
13,453 |
|
13,452 |
|
Regulatory Capital Adjustment and Deduction: |
|
|
Add: Unrealized gains on AFS equity exposures includable in Tier 2 Capital |
— |
|
3 |
|
Less: Minimum regulatory capital requirements of insurance underwriting subsidiaries(11)
|
52 |
|
61 |
|
Total Tier 2 Capital (Standardized Approach) |
$ |
37,443 |
|
$ |
36,551 |
|
Total Capital (Tier 1 Capital + Tier 2 Capital) (Standardized Approach) |
$ |
202,284 |
|
$ |
214,938 |
|
Adjustment for excess of eligible credit reserves over expected credit losses(13)
|
$ |
(11,953 |
) |
$ |
(12,792 |
) |
Total Tier 2 Capital (Advanced Approaches) |
$ |
25,490 |
|
$ |
23,759 |
|
Total Capital (Tier 1 Capital + Tier 2 Capital) (Advanced Approaches) |
$ |
190,331 |
|
$ |
202,146 |
|
Footnotes are presented on the following page.
|
|
(1) |
Issuance costs of $184 million related to noncumulative perpetual preferred stock outstanding at December 31, 2017 and December 31, 2016 are excluded from common stockholders’ equity and netted against such preferred stock in accordance with Federal Reserve Board regulatory reporting requirements, which differ from those under U.S. generally accepted accounting principles (GAAP).
|
|
|
(2) |
In addition, includes the net amount of unamortized loss on held-to-maturity (HTM) securities. This amount relates to securities that were previously transferred from AFS to HTM, and non-credit related factors such as changes in interest rates and liquidity spreads for HTM securities with other-than-temporary impairment. |
|
|
(3) |
The transition arrangements for significant regulatory capital adjustments and deductions impacting Common Equity Tier 1 Capital and Additional Tier 1 Capital are set forth above in the chart entitled “Basel III Transition Arrangements: Significant Regulatory Capital Adjustments and Deductions.” |
|
|
(4) |
Common Equity Tier 1 Capital is adjusted for accumulated net unrealized gains (losses) on cash flow hedges included in Accumulated other comprehensive income (loss) (AOCI) that relate to the hedging of items not recognized at fair value on the balance sheet.
|
|
|
(5) |
The cumulative impact of changes in Citigroup’s own creditworthiness in valuing liabilities for which the fair value option has been elected, and own-credit valuation adjustments on derivatives, are excluded from Common Equity Tier 1 Capital and Additional Tier 1 Capital, in accordance with the U.S. Basel III rules. |
|
|
(6) |
Includes goodwill “embedded” in the valuation of significant common stock investments in unconsolidated financial institutions. |
|
|
(7) |
Of Citi’s $22.5 billion of net DTAs at December 31, 2017, $10.2 billion were includable in regulatory capital pursuant to the U.S. Basel III rules, while $12.3 billion were excluded. Excluded from Citi’s regulatory capital at December 31, 2017 was in total $13.1 billion of net DTAs arising from net operating loss, foreign tax credit and general business credit carry-forwards, of which $10.5 billion were deducted from Common Equity Tier 1 Capital and $2.6 billion were deducted from Additional Tier 1 Capital, which was reduced by $0.8 billion of net DTLs primarily associated with goodwill and certain other intangible assets. Separately, under the U.S. Basel III rules, goodwill and these other intangible assets are deducted net of associated DTLs in arriving at Common Equity Tier 1 Capital. DTAs arising from net operating loss, foreign tax credit and general business credit carry-forwards are required to be deducted from both Common Equity Tier 1 Capital and Additional Tier 1 Capital under the transition arrangements of the U.S. Basel III rules; whereas DTAs arising from temporary differences are deducted solely from Common Equity Tier 1 Capital under these rules, if in excess of 10%/15% limitations.
|
|
|
(8) |
Assets subject to 10%/15% limitations include MSRs, DTAs arising from temporary differences and significant common stock investments in unconsolidated financial institutions. At December 31, 2017, none of these assets were in excess of the 10%/15% limitations. At December 31, 2016, this deduction related only to DTAs arising from temporary differences that exceeded the 10% limitation.
|
|
|
(9) |
Represents Citigroup Capital XIII trust preferred securities, which are permanently grandfathered as Tier 1 Capital under the U.S. Basel III rules. |
|
|
(10) |
Banking entities are required to be in compliance with the Volcker Rule of the Dodd-Frank Act which prohibits conducting certain proprietary investment activities and limits their ownership of, and relationships with, covered funds. Accordingly, Citi is required by the Volcker Rule to deduct from Tier 1 Capital all permitted ownership interests in covered funds that were acquired after December 31, 2013. |
|
|
(11) |
50% of the minimum regulatory capital requirements of insurance underwriting subsidiaries must be deducted from each of Tier 1 Capital and Tier 2 Capital. |
|
|
(12) |
Effective January 1, 2016, non-grandfathered trust preferred securities are not eligible for inclusion in Tier 1 Capital, but are eligible for inclusion in Tier 2 Capital subject to full phase-out by January 1, 2022. Non-grandfathered trust preferred securities are eligible for inclusion in Tier 2 Capital in an amount up to 50% and 60% during 2017 and 2016, respectively, of the aggregate outstanding principal amounts of such issuances as of January 1, 2014, in accordance with the transition arrangements for non-qualifying capital instruments under the U.S. Basel III rules. |
|
|
(13) |
Under the Standardized Approach, the allowance for credit losses is eligible for inclusion in Tier 2 Capital up to 1.25% of credit risk-weighted assets, with any excess allowance for credit losses being deducted in arriving at credit risk-weighted assets, which differs from the Advanced Approaches framework, in which eligible credit reserves that exceed expected credit losses are eligible for inclusion in Tier 2 Capital to the extent the excess reserves do not exceed 0.6% of credit risk-weighted assets. The total amount of eligible credit reserves in excess of expected credit losses that were eligible for inclusion in Tier 2 Capital, subject to limitation, under the Advanced Approaches framework was $1.5 billion and $0.7 billion at December 31, 2017 and December 31, 2016, respectively.
|
Citigroup Capital Rollforward Under Current Regulatory Standards (Basel III Transition Arrangements)
|
|
|
|
|
|
|
|
In millions of dollars |
Three Months Ended December 31, 2017 |
Twelve Months Ended
December 31, 2017 |
Common Equity Tier 1 Capital, beginning of period |
$ |
162,008 |
|
$ |
167,378 |
|
Net loss |
(18,893 |
) |
(6,798 |
) |
Common and preferred stock dividends declared |
(1,160 |
) |
(3,808 |
) |
Net increase in treasury stock |
(5,480 |
) |
(14,666 |
) |
Net change in common stock and additional paid-in capital |
112 |
|
(35 |
) |
Net increase in foreign currency translation adjustment net of hedges, net of tax |
(2,381 |
) |
(202 |
) |
Net increase in unrealized losses on securities AFS, net of tax |
(792 |
) |
(447 |
) |
Net increase in defined benefit plans liability adjustment, net of tax |
(674 |
) |
(1,848 |
) |
|
Net change in adjustment related to changes in fair value of financial liabilities
attributable to own creditworthiness, net of tax
|
(58 |
) |
(29 |
) |
Net increase in goodwill, net of related DTLs |
(520 |
) |
(1,194 |
) |
Net change in identifiable intangible assets other than MSRs, net of related DTLs |
7 |
|
(595 |
) |
Net increase in defined benefit pension plan net assets |
(141 |
) |
(203 |
) |
|
Net decrease in DTAs arising from net operating loss, foreign tax credit and
general business credit carry-forwards
|
5,596 |
|
2,344 |
|
|
Net decrease in excess over 10%/15% limitations for other DTAs, certain common
stock investments and MSRs
|
6,948 |
|
4,815 |
|
Other |
3,319 |
|
3,179 |
|
Net decrease in Common Equity Tier 1 Capital |
$ |
(14,117 |
) |
$ |
(19,487 |
) |
|
Common Equity Tier 1 Capital, end of period
(Standardized Approach and Advanced Approaches)
|
$ |
147,891 |
|
$ |
147,891 |
|
Additional Tier 1 Capital, beginning of period |
$ |
15,296 |
|
$ |
11,009 |
|
Net increase in qualifying trust preferred securities |
3 |
|
6 |
|
|
Net change in adjustment related to changes in fair value of financial liabilities
attributable to own creditworthiness, net of tax
|
61 |
|
120 |
|
Net change in defined benefit pension plan net assets |
(35 |
) |
164 |
|
|
Net decrease in DTAs arising from net operating loss, foreign tax credit and
general business credit carry-forwards
|
1,400 |
|
5,921 |
|
Net change in permitted ownership interests in covered funds |
228 |
|
(367 |
) |
Other |
(3 |
) |
97 |
|
Net increase in Additional Tier 1 Capital |
$ |
1,654 |
|
$ |
5,941 |
|
|
Additional Tier 1 Capital, end of period
(Standardized Approach and Advanced Approaches)
|
$ |
16,950 |
|
$ |
16,950 |
|
|
Tier 1 Capital, end of period
(Standardized Approach and Advanced Approaches)
|
$ |
164,841 |
|
$ |
164,841 |
|
Tier 2 Capital, beginning of period (Standardized Approach) |
$ |
37,483 |
|
$ |
36,551 |
|
Net increase in qualifying subordinated debt |
95 |
|
855 |
|
Net increase in qualifying trust preferred securities |
— |
|
12 |
|
Net decrease in eligible allowance for credit losses |
(145 |
) |
1 |
|
Other |
10 |
|
24 |
|
Net change in Tier 2 Capital (Standardized Approach) |
$ |
(40 |
) |
$ |
892 |
|
Tier 2 Capital, end of period (Standardized Approach) |
$ |
37,443 |
|
$ |
37,443 |
|
Total Capital, end of period (Standardized Approach) |
$ |
202,284 |
|
$ |
202,284 |
|
|
|
|
|
|
Tier 2 Capital, beginning of period (Advanced Approaches) |
$ |
25,339 |
|
$ |
23,759 |
|
Net increase in qualifying subordinated debt |
95 |
|
855 |
|
Net increase in qualifying trust preferred securities |
— |
|
12 |
|
Net increase in excess of eligible credit reserves over expected credit losses |
46 |
|
840 |
|
Other |
10 |
|
24 |
|
Net increase in Tier 2 Capital (Advanced Approaches) |
$ |
151 |
|
$ |
1,731 |
|
Tier 2 Capital, end of period (Advanced Approaches) |
$ |
25,490 |
|
$ |
25,490 |
|
Total Capital, end of period (Advanced Approaches) |
$ |
190,331 |
|
$ |
190,331 |
|
Citigroup Risk-Weighted Assets Rollforward Under Current Regulatory Standards
(Basel III Standardized Approach with Transition Arrangements)
|
|
|
|
|
|
|
|
In millions of dollars |
Three Months Ended December 31, 2017 |
Twelve Months Ended
December 31, 2017 |
Total Risk-Weighted Assets, beginning of period |
$ |
1,158,679 |
|
$ |
1,126,314 |
|
Changes in Credit Risk-Weighted Assets |
|
|
Net increase in general credit risk exposures(1)
|
10,883 |
|
26,037 |
|
Net increase in repo-style transactions(2)
|
4,071 |
|
19,489 |
|
Net change in securitization exposures(3)
|
514 |
|
(5,669 |
) |
Net increase in equity exposures |
269 |
|
1,825 |
|
Net decrease in over-the-counter (OTC) derivatives(4)
|
(24,058 |
) |
(22,312 |
) |
Net decrease in other exposures(5)
|
(12,910 |
) |
(11,510 |
) |
Net increase in off-balance sheet exposures(6)
|
203 |
|
2,794 |
|
Net change in Credit Risk-Weighted Assets |
$ |
(21,028 |
) |
$ |
10,654 |
|
Changes in Market Risk-Weighted Assets |
|
|
Net increase in risk levels(7)
|
$ |
1,091 |
|
$ |
15,254 |
|
Net decrease due to model and methodology updates(8)
|
(575 |
) |
(14,055 |
) |
Net increase in Market Risk-Weighted Assets |
$ |
516 |
|
$ |
1,199 |
|
Total Risk-Weighted Assets, end of period |
$ |
1,138,167 |
|
$ |
1,138,167 |
|
|
|
(1) |
General credit risk exposures include cash and balances due from depository institutions, securities, and loans and leases. General credit risk exposures increased during the three and twelve months ended December 31, 2017 primarily due to corporate loan growth.
|
|
|
(2) |
Repo-style transactions include repurchase or reverse repurchase transactions and securities borrowing or securities lending transactions. |
|
|
(3) |
Securitization exposures decreased during the twelve months ended December 31, 2017 principally as a result of certain securitization exposures becoming subject to deduction from Tier 1 Capital under the Volcker Rule of the Dodd-Frank Act.
|
|
|
(4) |
OTC derivatives decreased during the three and twelve months ended December 31, 2017 primarily due to notional decreases.
|
|
|
(5) |
Other exposures include cleared transactions, unsettled transactions, and other assets. Other exposures decreased during the three and twelve months ended December 31, 2017 primarily due to a reduction in Citi’s deferred tax assets as a result of Tax Reform. For additional information regarding the impact of Tax Reform, see “Impact of Tax Reform” above.
|
|
|
(6) |
Off-balance sheet exposures increased during the twelve months ended December 31, 2017 primarily due to growth in corporate exposures.
|
|
|
(7) |
Risk levels increased during the three months ended December 31, 2017 primarily due to an increases in exposures subject to securitization charges and incremental risk charges, partially offset by a decrease in exposures subject to comprehensive risk and Risk Not In the Model. Risk levels increased during the twelve months ended December 31, 2017 primarily due to an increase in exposure levels subject to Stressed Value at Risk, as well as an increase in positions subject to securitization charges.
|
|
|
(8) |
Risk-weighted assets declined during the twelve months ended December 31, 2017, as Citi received supervisory approval to remove the Comprehensive Risk Measure model surcharge for correlation trading portfolios, commencing with the third quarter of 2017. Further contributing to the decline in risk-weighted assets during the twelve months ended December 31, 2017 were changes in model inputs regarding volatility and the correlation between market risk factors.
|
Citigroup Risk-Weighted Assets Rollforward Under Current Regulatory Standards
(Basel III Advanced Approaches with Transition Arrangements)
|
|
|
|
|
|
|
|
In millions of dollars |
Three Months Ended December 31, 2017 |
Twelve Months Ended
December 31, 2017 |
Total Risk-Weighted Assets, beginning of period |
$ |
1,143,448 |
|
$ |
1,166,764 |
|
Changes in Credit Risk-Weighted Assets |
|
|
Net change in retail exposures(1)
|
994 |
|
(5,763 |
) |
Net increase in wholesale exposures(2)
|
8,676 |
|
2,730 |
|
Net change in repo-style transactions(3)
|
(2,097 |
) |
2,563 |
|
Net change in securitization exposures(4)
|
2,139 |
|
(4,338 |
) |
Net increase in equity exposures |
272 |
|
1,608 |
|
Net decrease in over-the-counter (OTC) derivatives(5)
|
(1,724 |
) |
(6,733 |
) |
Net decrease in derivatives CVA(6)
|
(3,533 |
) |
(3,616 |
) |
Net decrease in other exposures(7)
|
(11,726 |
) |
(9,449 |
) |
Net decrease in supervisory 6% multiplier(8)
|
(208 |
) |
(1,163 |
) |
Net decrease in Credit Risk-Weighted Assets |
$ |
(7,207 |
) |
$ |
(24,161 |
) |
Changes in Market Risk-Weighted Assets |
|
|
Net increase in risk levels(9)
|
$ |
1,210 |
|
$ |
15,052 |
|
Net decrease due to model and methodology updates(10)
|
(575 |
) |
(14,055 |
) |
Net increase in Market Risk-Weighted Assets |
$ |
635 |
|
$ |
997 |
|
Net decrease in Operational Risk-Weighted Assets(11)
|
$ |
(2,012 |
) |
$ |
(8,736 |
) |
Total Risk-Weighted Assets, end of period |
$ |
1,134,864 |
|
$ |
1,134,864 |
|
|
|
(1) |
Retail exposures increased during the three months ended December 31, 2017 primarily due to increases in qualifying revolving (cards) exposures attributable to seasonal holiday spending. Retail exposures decreased during the twelve months ended December 31, 2017 principally resulting from residential mortgage loan sales and repayments, and divestitures of certain legacy assets.
|
|
|
(2) |
Wholesale exposures increased during the three and twelve months ended December 31, 2017 primarily due to corporate loan growth. The increase in wholesale exposures during the twelve months ended December 31, 2017 was partially offset by annual updates to model parameters.
|
|
|
(3) |
Repo-style transactions decreased during the three months ended December 31, 2017 primarily due to improved portfolio credit quality. Repo-style transactions increased during the twelve months ended December 31, 2017 primarily due to increased activity and a decline in portfolio credit quality.
|
|
|
(4) |
Securitization exposures increased during the three months ended December 31, 2017 primarily due to increased activity. Securitization exposures decreased during the twelve months ended December 31, 2017 principally as a result of certain securitization exposures becoming subject to deduction from Tier 1 Capital under the Volcker Rule of the Dodd-Frank Act.
|
|
|
(5) |
OTC derivatives decreased during the three months ended December 31, 2017 primarily due to decreases in trade volume and changes in fair value. OTC derivatives decreased during the twelve months ended December 31, 2017 primarily due to changes in fair value and improved portfolio credit quality.
|
|
|
(6) |
Derivatives CVA decreased during the three and twelve months ended December 31, 2017 primarily driven by decreased volatility and exposure reduction.
|
|
|
(7) |
Other exposures include cleared transactions, unsettled transactions, assets other than those reportable in specific exposure categories and non-material portfolios. Other exposures decreased during the three and twelve months ended December 31, 2017 primarily due to a reduction in Citi’s deferred tax assets as a result of Tax Reform. For additional information regarding the impact of Tax Reform, see “Impact of Tax Reform” above.
|
|
|
(8) |
Supervisory 6% multiplier does not apply to derivatives CVA. |
|
|
(9) |
Risk levels increased during the three months ended December 31, 2017 primarily due to an increases in exposures subject to securitization charges and incremental risk charges, partially offset by a decrease in exposures subject to comprehensive risk and Risk Not In the Model. Risk levels increased during the twelve months ended December 31, 2017 primarily due to an increase in exposure levels subject to Stressed Value at Risk, as well as an increase in positions subject to securitization charges.
|
|
|
(10) |
Risk-weighted assets declined during the twelve months ended December 31, 2017, as Citi received supervisory approval to remove the Comprehensive Risk Measure model surcharge for correlation trading portfolios, commencing with the third quarter of 2017. Further contributing to the decline in risk-weighted assets during the twelve months ended December 31, 2017 were changes in model inputs regarding volatility and the correlation between market risk factors.
|
|
|
(11) |
Operational risk-weighted assets decreased during the three months ended December 31, 2017 primarily due to changes in operational loss severity and frequency. Operational risk-weighted assets decreased during the twelve months ended December 31, 2017 primarily due to assessed improvements in the business environment and risk controls and changes in operational loss severity and frequency.
|
Capital Resources of Citigroup’s Subsidiary U.S.
Depository Institutions Under Current Regulatory Standards
Citigroup’s subsidiary U.S. depository institutions are also subject to regulatory capital standards issued by their respective primary federal bank regulatory agencies, which are similar to the standards of the Federal Reserve Board.
During 2017, Citi’s primary subsidiary U.S. depository institution, Citibank, N.A. (Citibank), is subject to effective minimum Common Equity Tier 1 Capital, Tier 1 Capital and Total Capital ratios, inclusive of the 50% phase-in of the 2.5% Capital Conservation Buffer, of 5.75%, 7.25% and 9.25%, respectively. Citibank’s effective minimum Common Equity Tier 1 Capital, Tier 1 Capital and Total Capital ratios during 2016, inclusive of the 25% phase-in of the 2.5% Capital
Conservation Buffer, were 5.125%, 6.625% and 8.625%, respectively. Citibank is required to maintain stated minimum Common Equity Tier 1 Capital, Tier 1 Capital and Total Capital ratios of 4.5%, 6.0% and 8.0%, respectively.
The following tables set forth the capital tiers, total risk-weighted assets and underlying risk components, risk-based capital ratios, quarterly adjusted average total assets, Total Leverage Exposure and leverage ratios under current regulatory standards (reflecting Basel III Transition Arrangements) for Citibank, Citi’s primary subsidiary U.S. depository institution, as of December 31, 2017 and December 31, 2016.
Citibank Capital Components and Ratios Under Current Regulatory Standards (Basel III Transition Arrangements)
|
|
|
|
|
|
|
|
|
|
|
|
|
|
|
|
December 31, 2017 |
|
December 31, 2016 |
In millions of dollars, except ratios |
Advanced Approaches |
Standardized Approach |
|
Advanced Approaches |
Standardized Approach |
Common Equity Tier 1 Capital |
$ |
124,733 |
|
$ |
124,733 |
|
|
$ |
126,220 |
|
$ |
126,220 |
|
Tier 1 Capital |
126,303 |
|
126,303 |
|
|
126,465 |
|
126,465 |
|
Total Capital (Tier 1 Capital + Tier 2 Capital)(1)
|
139,351 |
|
150,289 |
|
|
138,821 |
|
150,291 |
|
Total Risk-Weighted Assets |
954,559 |
|
1,014,242 |
|
|
973,933 |
|
1,001,016 |
|
Credit Risk |
$ |
663,783 |
|
$ |
970,064 |
|
|
$ |
669,920 |
|
$ |
955,767 |
|
Market Risk |
43,300 |
|
44,178 |
|
|
44,579 |
|
45,249 |
|
Operational Risk |
247,476 |
|
— |
|
|
259,434 |
|
— |
|
Common Equity Tier 1 Capital ratio(2)
|
13.07 |
% |
12.30 |
% |
|
12.96 |
% |
12.61 |
% |
Tier 1 Capital ratio(2)
|
13.23 |
|
12.45 |
|
|
12.99 |
|
12.63 |
|
Total Capital ratio(2)
|
14.60 |
|
14.82 |
|
|
14.25 |
|
15.01 |
|
|
|
|
|
|
|
|
|
|
|
|
In millions of dollars, except ratios |
December 31, 2017 |
|
December 31, 2016 |
Quarterly Adjusted Average Total Assets(3)
|
|
$ |
1,401,615 |
|
|
|
$ |
1,333,161 |
|
Total Leverage Exposure(4)
|
|
1,901,069 |
|
|
|
1,859,394 |
|
Tier 1 Leverage ratio |
|
9.01 |
% |
|
|
9.49 |
% |
Supplementary Leverage ratio |
|
6.64 |
|
|
|
6.80 |
|
|
|
(1) |
Under the Advanced Approaches framework eligible credit reserves that exceed expected credit losses are eligible for inclusion in Tier 2 Capital to the extent the excess reserves do not exceed 0.6% of credit risk-weighted assets, which differs from the Standardized Approach in which the allowance for credit losses is eligible for inclusion in Tier 2 Capital up to 1.25% of credit risk-weighted assets, with any excess allowance for credit losses being deducted in arriving at credit risk-weighted assets. |
|
|
(2) |
As of December 31, 2017 and December 31, 2016, Citibank’s reportable Common Equity Tier 1 Capital and Tier 1 Capital ratios were the lower derived under the Basel III Standardized Approach. As of December 31, 2017 and December 31, 2016, Citibank’s reportable Total Capital ratio was the lower derived under the Basel III Advanced Approaches framework. |
|
|
(3) |
Tier 1 Leverage ratio denominator. |
|
|
(4) |
Supplementary Leverage ratio denominator. |
As indicated in the table above, Citibank’s capital ratios at December 31, 2017 were in excess of the stated and effective minimum requirements under the U.S. Basel III rules. In addition, Citibank was also “well capitalized” as of December 31, 2017 under the revised PCA regulations.
Further, Citibank is required to conduct the annual Dodd-Frank Act Stress Test. The annual stress test consists of a forward-looking quantitative evaluation of the impact of stressful economic and financial market conditions under
several scenarios on Citibank’s regulatory capital. This program serves to inform the Office of the Comptroller of
the Currency as to how Citibank’s regulatory capital ratios might change during a hypothetical set of adverse economic
conditions and to ultimately evaluate the reliability of Citibank’s capital planning process.
Impact of Changes on Citigroup and Citibank Capital Ratios Under Current Regulatory Capital Standards
The following tables present the estimated sensitivity of Citigroup’s and Citibank’s capital ratios to changes of $100 million in Common Equity Tier 1 Capital, Tier 1 Capital and Total Capital (numerator), and changes of $1 billion in Advanced Approaches and Standardized Approach risk-weighted assets and quarterly adjusted average total assets, as well as Total Leverage Exposure (denominator), under current regulatory capital standards (reflecting Basel III Transition Arrangements), as of December 31, 2017. This information is
provided for the purpose of analyzing the impact that a change in Citigroup’s or Citibank’s financial position or results of operations could have on these ratios. These sensitivities only consider a single change to either a component of regulatory capital, risk-weighted assets, quarterly adjusted average total assets or Total Leverage Exposure. Accordingly, an event that affects more than one factor may have a larger basis point impact than is reflected in these tables.
Impact of Changes on Citigroup and Citibank Risk-Based Capital Ratios (Basel III Transition Arrangements)
|
|
|
|
|
|
|
|
|
Common Equity
Tier 1 Capital ratio
|
Tier 1 Capital ratio |
Total Capital ratio |
In basis points |
Impact of
$100 million
change in
Common Equity
Tier 1 Capital
|
Impact of
$1 billion
change in risk-
weighted assets
|
Impact of
$100 million
change in
Tier 1 Capital
|
Impact of
$1 billion
change in risk-
weighted assets
|
Impact of
$100 million
change in
Total Capital
|
Impact of
$1 billion
change in risk-
weighted assets
|
Citigroup |
|
|
|
|
|
|
Advanced Approaches |
0.9 |
1.1 |
0.9 |
1.3 |
0.9 |
1.5 |
Standardized Approach |
0.9 |
1.1 |
0.9 |
1.3 |
0.9 |
1.6 |
Citibank |
|
|
|
|
|
|
Advanced Approaches |
1.0 |
1.4 |
1.0 |
1.4 |
1.0 |
1.5 |
Standardized Approach |
1.0 |
1.2 |
1.0 |
1.2 |
1.0 |
1.5 |
Impact of Changes on Citigroup and Citibank Leverage Ratios (Basel III Transition Arrangements)
|
|
|
|
|
|
|
Tier 1 Leverage ratio |
Supplementary Leverage ratio |
In basis points |
Impact of
$100 million
change in
Tier 1 Capital
|
Impact of
$1 billion
change in quarterly adjusted average total assets
|
Impact of
$100 million
change in
Tier 1 Capital
|
Impact of
$1 billion
change in Total Leverage Exposure
|
Citigroup |
0.5 |
0.5 |
0.4 |
0.3 |
Citibank |
0.7 |
0.6 |
0.5 |
0.3 |
Citigroup Broker-Dealer Subsidiaries
At December 31, 2017, Citigroup Global Markets Inc., a U.S. broker-dealer registered with the SEC that is an indirect wholly owned subsidiary of Citigroup, had net capital, computed in accordance with the SEC’s net capital rule, of $11.0 billion, which exceeded the minimum requirement by $9.0 billion.
Moreover, Citigroup Global Markets Limited, a broker-dealer registered with the United Kingdom’s Prudential Regulation Authority (PRA) that is also an indirect wholly owned subsidiary of Citigroup, had total capital of $18.1 billion at December 31, 2017, which exceeded the PRA's minimum regulatory capital requirements.
In addition, certain of Citi’s other broker-dealer
subsidiaries are subject to regulation in the countries in which they do business, including requirements to maintain specified levels of net capital or its equivalent. Citigroup’s other broker-dealer subsidiaries were in compliance with their capital requirements at December 31, 2017.
Basel III (Full Implementation)
Citigroup’s Capital Resources Under Basel III
(Full Implementation)
Citi currently estimates that its effective minimum Common Equity Tier 1 Capital, Tier 1 Capital and Total Capital ratio requirements under the U.S. Basel III rules, on a fully implemented basis, inclusive of the 2.5% Capital Conservation Buffer and the Countercyclical Capital Buffer at its current level of 0%, as well as an expected 3.0% GSIB surcharge, may be 10.0%, 11.5% and 13.5%, respectively.
Further, under the U.S. Basel III rules, Citi must also comply with a 4.0% minimum Tier 1 Leverage ratio requirement and an effective 5.0% minimum Supplementary Leverage ratio requirement.
The following tables set forth the capital tiers, total risk-weighted assets and underlying risk components, risk-based capital ratios, quarterly adjusted average total assets, Total Leverage Exposure and leverage ratios, assuming full implementation under the U.S. Basel III rules, for Citi as of December 31, 2017 and December 31, 2016.
At December 31, 2017, Citi’s constraining Common Equity Tier 1 Capital and Tier 1 Capital ratios were those derived under the Basel III Standardized Approach, whereas Citi’s binding Total Capital ratio was that resulting from application of the Basel III Advanced Approaches framework. Further, each of Citi’s risk-based capital ratios was constrained by the Basel III Advanced Approaches framework for all periods prior to June 30, 2017.
Citigroup Capital Components and Ratios Under Basel III (Full Implementation)
|
|
|
|
|
|
|
|
|
|
|
|
|
|
|
|
December 31, 2017 |
|
December 31, 2016 |
In millions of dollars, except ratios |
Advanced Approaches |
Standardized Approach |
|
Advanced Approaches |
Standardized Approach |
Common Equity Tier 1 Capital |
$ |
142,822 |
|
$ |
142,822 |
|
|
$ |
149,516 |
|
$ |
149,516 |
|
Tier 1 Capital |
162,377 |
|
162,377 |
|
|
169,390 |
|
169,390 |
|
Total Capital (Tier 1 Capital + Tier 2 Capital) |
187,877 |
|
199,989 |
|
|
193,160 |
|
205,975 |
|
Total Risk-Weighted Assets |
1,152,644 |
|
1,155,099 |
|
|
1,189,680 |
|
1,147,956 |
|
Credit Risk |
$ |
767,102 |
|
$ |
1,089,372 |
|
|
$ |
796,399 |
|
$ |
1,083,428 |
|
Market Risk |
65,003 |
|
65,727 |
|
|
64,006 |
|
64,528 |
|
Operational Risk |
320,539 |
|
— |
|
|
329,275 |
|
— |
|
Common Equity Tier 1 Capital ratio(1)(2)
|
12.39 |
% |
12.36 |
% |
|
12.57 |
% |
13.02 |
% |
Tier 1 Capital ratio(1)(2)
|
14.09 |
|
14.06 |
|
|
14.24 |
|
14.76 |
|
Total Capital ratio(1)(2)
|
16.30 |
|
17.31 |
|
|
16.24 |
|
17.94 |
|
|
|
|
|
|
|
|
|
|
|
|
In millions of dollars, except ratios |
December 31, 2017 |
|
December 31, 2016 |
Quarterly Adjusted Average Total Assets(3)
|
|
$ |
1,868,326 |
|
|
|
$ |
1,761,923 |
|
Total Leverage Exposure(4)
|
|
2,432,491 |
|
|
|
2,345,391 |
|
Tier 1 Leverage ratio(2)
|
|
8.69 |
% |
|
|
9.61 |
% |
Supplementary Leverage ratio(2)
|
|
6.68 |
|
|
|
7.22 |
|
|
|
(1) |
As of December 31, 2017, Citi’s reportable Common Equity Tier 1 Capital and Tier 1 Capital ratios were the lower derived under the Basel III Standardized Approach, whereas the reportable Total Capital ratio was the lower derived under the Basel III Advanced Approaches framework. As of December 31, 2016, Citi’s reportable Common Equity Tier 1 Capital, Tier 1 Capital, and Total Capital ratios were the lower derived under the Basel III Advanced Approaches framework.
|
|
|
(2) |
Citi’s Basel III risk-based capital and leverage ratios and related components, on a fully implemented basis, are non-GAAP financial measures. Citi believes these ratios and the related components provide useful information to investors and others by measuring Citi’s progress against future regulatory capital standards. |
|
|
(3) |
Tier 1 Leverage ratio denominator. |
|
|
(4) |
Supplementary Leverage ratio denominator. |
Common Equity Tier 1 Capital Ratio
Citi’s Common Equity Tier 1 Capital ratio was 12.4% at December 31, 2017, compared to 13.0% at September 30, 2017 and 12.6% at December 31, 2016. The ratio declined quarter-over-quarter and year-over-year, primarily due to a reduction in Common Equity Tier 1 Capital resulting from the return of capital to common shareholders as well as the impact of Tax Reform.
Components of Citigroup Capital Under Basel III (Full Implementation)
|
|
|
|
|
|
|
|
In millions of dollars |
December 31,
2017 |
December 31,
2016 |
Common Equity Tier 1 Capital |
|
|
Citigroup common stockholders’ equity(1)
|
$ |
181,671 |
|
$ |
206,051 |
|
Add: Qualifying noncontrolling interests |
153 |
|
129 |
|
Regulatory Capital Adjustments and Deductions: |
|
|
Less: Accumulated net unrealized losses on cash flow hedges, net of tax(2)
|
(698 |
) |
(560 |
) |
|
Less: Cumulative unrealized net loss related to changes in fair value of financial liabilities
attributable to own creditworthiness, net of tax(3)
|
(721 |
) |
(61 |
) |
Less: Intangible assets: |
|
|
Goodwill, net of related DTLs(4)
|
22,052 |
|
20,858 |
|
Identifiable intangible assets other than MSRs, net of related DTLs |
4,401 |
|
4,876 |
|
Less: Defined benefit pension plan net assets |
896 |
|
857 |
|
|
Less: DTAs arising from net operating loss, foreign tax credit and general business credit
carry-forwards(5)
|
13,072 |
|
21,337 |
|
|
Less: Excess over 10%/15% limitations for other DTAs, certain common stock investments,
and MSRs(5)(6)
|
— |
|
9,357 |
|
Total Common Equity Tier 1 Capital (Standardized Approach and Advanced Approaches) |
$ |
142,822 |
|
$ |
149,516 |
|
Additional Tier 1 Capital |
|
|
Qualifying noncumulative perpetual preferred stock(1)
|
$ |
19,069 |
|
$ |
19,069 |
|
Qualifying trust preferred securities(7)
|
1,377 |
|
1,371 |
|
Qualifying noncontrolling interests |
61 |
|
28 |
|
Regulatory Capital Deductions: |
|
|
Less: Permitted ownership interests in covered funds(8)
|
900 |
|
533 |
|
Less: Minimum regulatory capital requirements of insurance underwriting subsidiaries(9)
|
52 |
|
61 |
|
Total Additional Tier 1 Capital (Standardized Approach and Advanced Approaches) |
$ |
19,555 |
|
$ |
19,874 |
|
|
Total Tier 1 Capital (Common Equity Tier 1 Capital + Additional Tier 1 Capital)
(Standardized Approach and Advanced Approaches)
|
$ |
162,377 |
|
$ |
169,390 |
|
Tier 2 Capital |
|
|
Qualifying subordinated debt |
$ |
23,673 |
|
$ |
22,818 |
|
Qualifying trust preferred securities(10)
|
329 |
|
317 |
|
Qualifying noncontrolling interests |
50 |
|
36 |
|
Eligible allowance for credit losses(11)
|
13,612 |
|
13,475 |
|
Regulatory Capital Deduction: |
|
|
Less: Minimum regulatory capital requirements of insurance underwriting subsidiaries(9)
|
52 |
|
61 |
|
Total Tier 2 Capital (Standardized Approach) |
$ |
37,612 |
|
$ |
36,585 |
|
Total Capital (Tier 1 Capital + Tier 2 Capital) (Standardized Approach) |
$ |
199,989 |
|
$ |
205,975 |
|
Adjustment for excess of eligible credit reserves over expected credit losses(11)
|
$ |
(12,112 |
) |
$ |
(12,815 |
) |
Total Tier 2 Capital (Advanced Approaches) |
$ |
25,500 |
|
$ |
23,770 |
|
Total Capital (Tier 1 Capital + Tier 2 Capital) (Advanced Approaches) |
$ |
187,877 |
|
$ |
193,160 |
|
|
|
(1) |
Issuance costs of $184 million related to noncumulative perpetual preferred stock outstanding at December 31, 2017 and December 31, 2016 are excluded from common stockholders’ equity and netted against such preferred stock in accordance with Federal Reserve Board regulatory reporting requirements, which differ from those under U.S. GAAP. |
|
|
(2) |
Common Equity Tier 1 Capital is adjusted for accumulated net unrealized gains (losses) on cash flow hedges included in AOCI that relate to the hedging of items not recognized at fair value on the balance sheet. |
|
|
(3) |
The cumulative impact of changes in Citigroup’s own creditworthiness in valuing liabilities for which the fair value option has been elected, and own-credit valuation adjustments on derivatives, are excluded from Common Equity Tier 1 Capital, in accordance with the U.S. Basel III rules. |
|
|
(4) |
Includes goodwill “embedded” in the valuation of significant common stock investments in unconsolidated financial institutions. |
Footnotes continue on the following page.
|
|
(5) |
Of Citi’s $22.5 billion of net DTAs at December 31, 2017, $10.2 billion were includable in Common Equity Tier 1 Capital pursuant to the U.S. Basel III rules, while $12.3 billion were excluded. Excluded from Citi’s Common Equity Tier 1 Capital as of December 31, 2017 was $13.1 billion of net DTAs arising from net operating loss, foreign tax credit and general business credit carry-forwards, which was reduced by $0.8 billion of net DTLs primarily associated with goodwill and certain other intangible assets. Separately, under the U.S. Basel III rules, goodwill and these other intangible assets are deducted net of associated DTLs in arriving at Common Equity Tier 1 Capital. DTAs arising from net operating loss, foreign tax credit and general business credit carry-forwards are required to be entirely deducted from Common Equity Tier 1 Capital under full implementation of the U.S. Basel III rules; whereas DTAs arising from temporary differences are deducted from Common Equity Tier 1 Capital if in excess of 10%/15% limitations. |
|
|
(6) |
Assets subject to 10%/15% limitations include MSRs, DTAs arising from temporary differences and significant common stock investments in unconsolidated financial institutions. At December 31, 2017, none of these assets were in excess of the 10%/15% limitations. At December 31, 2016, this deduction related only to DTAs arising from temporary differences that exceeded the 10% limitation. |
|
|
(7) |
Represents Citigroup Capital XIII trust preferred securities, which are permanently grandfathered as Tier 1 Capital under the U.S. Basel III rules. |
|
|
(8) |
Banking entities are required to be in compliance with the Volcker Rule of the Dodd-Frank Act which prohibits conducting certain proprietary investment activities and limits their ownership of, and relationships with, covered funds. Accordingly, Citi is required by the Volcker Rule to deduct from Tier 1 Capital all permitted ownership interests in covered funds that were acquired after December 31, 2013. |
|
|
(9) |
50% of the minimum regulatory capital requirements of insurance underwriting subsidiaries must be deducted from each of Tier 1 Capital and Tier 2 Capital. |
|
|
(10) |
Represents the amount of non-grandfathered trust preferred securities eligible for inclusion in Tier 2 Capital under the U.S. Basel III rules, which will be fully phased-out of Tier 2 Capital by January 1, 2022. |
|
|
(11) |
Under the Standardized Approach, the allowance for credit losses is eligible for inclusion in Tier 2 Capital up to 1.25% of credit risk-weighted assets, with any excess allowance for credit losses being deducted in arriving at credit risk-weighted assets, which differs from the Advanced Approaches framework, in which eligible credit reserves that exceed expected credit losses are eligible for inclusion in Tier 2 Capital to the extent the excess reserves do not exceed 0.6% of credit risk-weighted assets. The total amount of eligible credit reserves in excess of expected credit losses that were eligible for inclusion in Tier 2 Capital, subject to limitation, under the Advanced Approaches framework was $1.5 billion and $0.7 billion at December 31, 2017 and December 31, 2016, respectively.
|
Citigroup Capital Rollforward Under Basel III (Full Implementation)
|
|
|
|
|
|
|
|
In millions of dollars |
Three Months Ended December 31, 2017 |
Twelve Months Ended
December 31, 2017 |
Common Equity Tier 1 Capital, beginning of period |
$ |
153,534 |
|
$ |
149,516 |
|
Net loss |
(18,893 |
) |
(6,798 |
) |
Common and preferred stock dividends declared |
(1,160 |
) |
(3,808 |
) |
Net increase in treasury stock |
(5,480 |
) |
(14,666 |
) |
Net change in common stock and additional paid-in capital |
112 |
|
(35 |
) |
Net increase in foreign currency translation adjustment net of hedges, net of tax |
(2,381 |
) |
(202 |
) |
Net increase in unrealized losses on securities AFS, net of tax |
(990 |
) |
(359 |
) |
Net increase in defined benefit plans liability adjustment, net of tax |
(843 |
) |
(1,019 |
) |
|
Net change in adjustment related to changes in fair value of financial liabilities
attributable to own creditworthiness, net of tax
|
3 |
|
91 |
|
Net increase in goodwill, net of related DTLs |
(520 |
) |
(1,194 |
) |
Net decrease in identifiable intangible assets other than MSRs, net of related DTLs |
9 |
|
475 |
|
Net increase in defined benefit pension plan net assets |
(176 |
) |
(39 |
) |
Net decrease in DTAs arising from net operating loss, foreign tax credit and general business credit carry-forwards |
6,996 |
|
8,265 |
|
|
Net decrease in excess over 10%/15% limitations for other DTAs, certain common stock
investments and MSRs
|
9,298 |
|
9,357 |
|
Other |
3,313 |
|
3,238 |
|
Net decrease in Common Equity Tier 1 Capital |
$ |
(10,712 |
) |
$ |
(6,694 |
) |
|
Common Equity Tier 1 Capital, end of period
(Standardized Approach and Advanced Approaches)
|
$ |
142,822 |
|
$ |
142,822 |
|
Additional Tier 1 Capital, beginning of period |
$ |
19,315 |
|
$ |
19,874 |
|
Net increase in qualifying trust preferred securities |
3 |
|
6 |
|
Net change in permitted ownership interests in covered funds |
228 |
|
(367 |
) |
Other |
9 |
|
42 |
|
Net change in Additional Tier 1 Capital |
$ |
240 |
|
$ |
(319 |
) |
|
Additional Tier 1 Capital, end of period
(Standardized Approach and Advanced Approaches)
|
$ |
19,555 |
|
$ |
19,555 |
|
|
Tier 1 Capital, end of period
(Standardized Approach and Advanced Approaches)
|
$ |
162,377 |
|
$ |
162,377 |
|
Tier 2 Capital, beginning of period (Standardized Approach) |
$ |
37,490 |
|
$ |
36,585 |
|
Net increase in qualifying subordinated debt |
95 |
|
855 |
|
Net increase in eligible allowance for credit losses |
14 |
|
137 |
|
Other |
13 |
|
35 |
|
Net increase in Tier 2 Capital (Standardized Approach) |
$ |
122 |
|
$ |
1,027 |
|
Tier 2 Capital, end of period (Standardized Approach) |
$ |
37,612 |
|
$ |
37,612 |
|
Total Capital, end of period (Standardized Approach) |
$ |
199,989 |
|
$ |
199,989 |
|
|
|
|
Tier 2 Capital, beginning of period (Advanced Approaches) |
$ |
25,346 |
|
$ |
23,770 |
|
Net increase in qualifying subordinated debt |
95 |
|
855 |
|
Net increase in excess of eligible credit reserves over expected credit losses |
46 |
|
840 |
|
Other |
13 |
|
35 |
|
Net increase in Tier 2 Capital (Advanced Approaches) |
$ |
154 |
|
$ |
1,730 |
|
Tier 2 Capital, end of period (Advanced Approaches) |
$ |
25,500 |
|
$ |
25,500 |
|
Total Capital, end of period (Advanced Approaches |
$ |
187,877 |
|
$ |
187,877 |
|
Citigroup Risk-Weighted Assets Rollforward (Basel III Standardized Approach with Full Implementation)
|
|
|
|
|
|
|
|
In millions of dollars |
Three Months Ended December 31, 2017 |
Twelve Months Ended
December 31, 2017 |
Total Risk-Weighted Assets, beginning of period |
$ |
1,182,918 |
|
$ |
1,147,956 |
|
Changes in Credit Risk-Weighted Assets |
|
|
Net increase in general credit risk exposures(1)
|
10,883 |
|
26,037 |
|
Net increase in repo-style transactions |
4,071 |
|
19,489 |
|
Net change in securitization exposures |
514 |
|
(5,669 |
) |
Net increase in equity exposures |
493 |
|
2,332 |
|
Net decrease in over-the-counter (OTC) derivatives |
(24,058 |
) |
(22,312 |
) |
Net decrease in other exposures(2)
|
(20,441 |
) |
(16,727 |
) |
Net increase in off-balance sheet exposures |
203 |
|
2,794 |
|
Net change in Credit Risk-Weighted Assets |
$ |
(28,335 |
) |
$ |
5,944 |
|
Changes in Market Risk-Weighted Assets |
|
|
Net increase in risk levels |
$ |
1,091 |
|
$ |
15,254 |
|
Net decrease due to model and methodology updates |
(575 |
) |
(14,055 |
) |
Net increase in Market Risk-Weighted Assets |
$ |
516 |
|
$ |
1,199 |
|
Total Risk-Weighted Assets, end of period |
$ |
1,155,099 |
|
$ |
1,155,099 |
|
|
|
(1) |
General credit risk exposures include cash and balances due from depository institutions, securities, and loans and leases. |
|
|
(2) |
Other exposures include cleared transactions, unsettled transactions, and other assets. |
Citigroup Risk-Weighted Assets Rollforward (Basel III Advanced Approaches with Full Implementation)
|
|
|
|
|
|
|
|
In millions of dollars |
Three Months Ended December 31, 2017 |
Twelve Months Ended
December 31, 2017 |
Total Risk-Weighted Assets, beginning of period |
$ |
1,169,142 |
|
$ |
1,189,680 |
|
Changes in Credit Risk-Weighted Assets |
|
|
Net change in retail exposures |
994 |
|
(5,763 |
) |
Net increase in wholesale exposures |
8,676 |
|
2,730 |
|
Net change in repo-style transactions |
(2,097 |
) |
2,563 |
|
Net change in securitization exposures |
2,139 |
|
(4,338 |
) |
Net increase in equity exposures |
496 |
|
2,115 |
|
Net decrease in over-the-counter (OTC) derivatives |
(1,724 |
) |
(6,733 |
) |
Net decrease in derivatives CVA |
(3,533 |
) |
(3,616 |
) |
Net decrease in other exposures(1)
|
(19,416 |
) |
(14,801 |
) |
Net decrease in supervisory 6% multiplier(2)
|
(656 |
) |
(1,454 |
) |
Net decrease in Credit Risk-Weighted Assets |
$ |
(15,121 |
) |
$ |
(29,297 |
) |
Changes in Market Risk-Weighted Assets |
|
|
Net increase in risk levels |
$ |
1,210 |
|
$ |
15,052 |
|
Net decrease due to model and methodology updates |
(575 |
) |
(14,055 |
) |
Net increase in Market Risk-Weighted Assets |
$ |
635 |
|
$ |
997 |
|
Net decrease in Operational Risk-Weighted Assets |
$ |
(2,012 |
) |
$ |
(8,736 |
) |
Total Risk-Weighted Assets, end of period |
$ |
1,152,644 |
|
$ |
1,152,644 |
|
|
|
(1) |
Other exposures include cleared transactions, unsettled transactions, assets other than those reportable in specific exposure categories, and non-material portfolios. |
|
|
(2) |
Supervisory 6% multiplier does not apply to derivatives CVA. |
Total risk-weighted assets under the Basel III Standardized Approach increased from year-end 2016 substantially due to higher credit risk-weighted assets, primarily resulting from corporate loan growth and increased repo-style transaction activity, partially offset by a decrease in OTC derivative trade activity and a reduction in Citi’s deferred tax assets as a result of Tax Reform.
Total risk-weighted assets under the Basel III Advanced Approaches decreased from year-end 2016, driven by substantially lower credit and operational risk-weighted assets. The decrease in credit risk-weighted assets was primarily due to a reduction in Citi’s deferred tax assets as a result of Tax Reform, changes in fair value and improved portfolio credit quality of OTC derivatives, residential mortgage loan sales and repayments, and divestitures of certain legacy assets. Operational risk-weighted assets decreased from year-end 2016 primarily due to assessed improvements in the business environment and risk controls, as well as changes in operational loss severity and frequency.
Supplementary Leverage Ratio
Citigroup’s Supplementary Leverage ratio was 6.7% for the fourth quarter of 2017, compared to 7.1% for the third quarter of 2017 and 7.2% for the fourth quarter of 2016. The decline in the ratio quarter-over-quarter was principally driven by a reduction in Tier 1 Capital resulting from the return of $6.3 billion of capital to common shareholders as well as the impact of Tax Reform. The decline in the ratio from the fourth quarter of 2016 was largely attributable to a reduction in Tier 1 Capital resulting from the return of $17.1 billion of capital to
common shareholders as well as the impact of Tax Reform, in conjunction with an increase in Total Leverage Exposure primarily due to growth in average on-balance sheet assets.
The following table sets forth Citi’s Supplementary Leverage ratio and related components, assuming full implementation under the U.S. Basel III rules, for the three months ended December 31, 2017 and December 31, 2016.
Citigroup Basel III Supplementary Leverage Ratio and Related Components (Full Implementation)
|
|
|
|
|
|
|
|
In millions of dollars, except ratios |
December 31, 2017 |
December 31, 2016 |
Tier 1 Capital |
$ |
162,377 |
|
$ |
169,390 |
|
Total Leverage Exposure (TLE) |
|
|
On-balance sheet assets(1)
|
$ |
1,909,699 |
|
$ |
1,819,802 |
|
Certain off-balance sheet exposures:(2)
|
|
|
Potential future exposure on derivative contracts |
191,555 |
|
211,009 |
|
Effective notional of sold credit derivatives, net(3)
|
59,207 |
|
64,366 |
|
Counterparty credit risk for repo-style transactions(4)
|
27,005 |
|
22,002 |
|
Unconditionally cancelable commitments |
67,644 |
|
66,663 |
|
Other off-balance sheet exposures |
218,754 |
|
219,428 |
|
Total of certain off-balance sheet exposures |
$ |
564,165 |
|
$ |
583,468 |
|
Less: Tier 1 Capital deductions |
41,373 |
|
57,879 |
|
Total Leverage Exposure |
$ |
2,432,491 |
|
$ |
2,345,391 |
|
Supplementary Leverage ratio |
6.68 |
% |
7.22 |
% |
|
|
(1) |
Represents the daily average of on-balance sheet assets for the quarter. |
|
|
(2) |
Represents the average of certain off-balance sheet exposures calculated as of the last day of each month in the quarter. |
|
|
(3) |
Under the U.S. Basel III rules, banking organizations are required to include in TLE the effective notional amount of sold credit derivatives, with netting of exposures permitted if certain conditions are met. |
|
|
(4) |
Repo-style transactions include repurchase or reverse repurchase transactions and securities borrowing or securities lending transactions. |
Citibank’s Supplementary Leverage ratio, assuming full implementation under the U.S. Basel III rules, was 6.6% for the fourth quarter of 2017, compared to 6.7% for the third quarter of 2017 and 6.6% for the fourth quarter of 2016. The quarter-over-quarter decrease was primarily driven by a reduction in Tier 1 Capital resulting from the impact of Tax Reform, partially offset by capital contributions from Citibank’s parent, Citicorp, as well as a decrease in Total Leverage Exposure primarily due to a decline in potential future exposure on derivative contracts. The ratio remained unchanged from the fourth quarter of 2016, as an increase in Tier 1 Capital was offset by an increase in Total Leverage Exposure.
Regulatory Capital Standards Developments
The Basel Committee on Banking Supervision (Basel Committee) issued several proposed and final rules during 2017, the most significant of which was designed to address final revisions or enhancements to the Basel III capital framework.
Basel III: Finalizing Post-Crisis Regulatory Capital Reforms
In December 2017, the Basel Committee issued a rule that finalizes several outstanding Basel III post-crisis regulatory capital reforms. The reforms, which generally become effective in 2022, relate to the methodologies in deriving credit and operational risk-weighted assets, the imposition of a new aggregate output floor for risk-weighted assets, and revisions to the leverage ratio framework.
The final rule, in part, revises the Standardized Approach in measuring credit risk-weighted assets with respect to certain on-balance sheet assets, such as in relation to the risk-weighting methodologies employed with respect to bank, corporate, and real estate (both residential and commercial) exposures; the treatment of off-balance sheet commitments; and aspects of the credit risk mitigation framework. Moreover, the final rule permits the use of external credit ratings combined with due diligence requirements in the calculation of credit risk-weighted assets for exposures to banks and corporates, while also providing alternative approaches for jurisdictions that do not allow the use of external credit ratings for risk-based capital purposes, such as the U.S.
The final rule also revises the internal ratings-based (IRB) approaches, in part, by prohibiting the use of such approaches for so-called “low default” exposures, including those to banks and other financial institutions, as well as large corporations. Further, the final rule also prohibits the use of the IRB approaches for equity exposures in the banking book. Additionally, for other exposures where the IRB approaches are still permissible, the final rule establishes floors by exposure type regarding the estimation of certain model parameters used in the derivation of credit risk-weighted assets, and also provides greater specification as to permissible parameter estimation practices under the IRB approaches.
Apart from credit risk, the final rule substantially revises the operational risk capital framework applicable to the Advanced Approaches for calculating risk-weighted assets by introducing the Standardized Measurement Approach (SMA). Operational risk capital is derived under the SMA through the combination of two components: a so-called “Business Indicator Component” and a “Loss Component.” The Business Indicator Component, primarily reflective of various income statement elements (i.e., a modified gross income indicator), is calculated as the sum of the three-year average of its components. The Loss Component reflects the operational loss exposure of a banking organization that can be inferred from internal loss experience, and is based on a 10-year average.
To reduce excessive variability with respect to risk-weighted assets, and to therefore enhance the comparability of risk-based capital ratios, the final rule establishes a floor requirement that is to be applied to total risk-weighted assets. More specifically, the risk-weighted assets that banks must use to determine compliance with risk-based capital requirements
must be calculated as the maximum of (i) total risk-weighted assets calculated using the approaches that the bank has supervisory approval to use in accordance with the Basel III capital framework (including both standardized and internally-modeled based approaches), and (ii) 72.5% of the total risk-weighted assets, calculated using only standardized approaches.
Lastly, the final rule revises the design and calibration of the Basel III leverage ratio (similar to the U.S. Basel III Supplementary Leverage ratio). Among the revisions are those with respect to the exposure measure (i.e., the denominator of the ratio) in relation to the treatment of derivative exposures, provisions, and off-balance sheet exposures.
Although the U.S. banking agencies subsequently issued a statement announcing support for these finalized Basel III reforms, further indicating that they will “consider how to appropriately apply these revisions,” significant uncertainty nonetheless currently exists with regard to the manner and timeframe in which these Basel III capital reforms will be implemented in the U.S.
Pillar 3 Disclosure Requirements—Consolidated and
Enhanced Framework
In March 2017, the Basel Committee issued a final rule
that adopts further revisions arising from the second phase of its review of the “Pillar 3” disclosure requirements, and which builds on the initial revisions from phase one of the review, which were finalized in January 2015.
The final rule consolidates all existing Basel Committee disclosure requirements into the Pillar 3 framework, with these constituting the disclosure requirements regarding the composition of capital, leverage ratio, Liquidity Coverage Ratio, Net Stable Funding Ratio, indicators for measuring the global systemic importance of banks, Countercyclical Capital Buffer, interest rate risk in the banking book, and remuneration. Moreover, the final rule introduces enhancements to the Pillar 3 framework, in part, by incorporating a “dashboard” of a banking organization’s key regulatory capital and liquidity metrics. The final rule also sets forth revisions and additions to the Pillar 3 framework resulting from ongoing reforms to the regulatory capital framework, including incorporating disclosure requirements arising from the Financial Stability Board’s total loss-absorbing capacity (TLAC) regime applicable to global systemically important banks (GSIBs), and revised disclosure requirements for market risk attributable to the revised market risk framework.
The Basel Committee announced in the final rule that it had commenced the third phase of its review of “Pillar 3” disclosure requirements, which will build further upon the revisions arising from the second phase of its review. Among other requirements, the third phase will include development of any disclosure requirements arising from the finalization of the Basel III post-crisis regulatory reforms.
Citi is currently subject to the Advanced Approaches disclosure requirements, as well as those with respect to market risk, under the U.S. Basel III rules. The U.S. banking agencies may revise the nature and extent of these disclosure
requirements in the future, as a result of the Basel Committee’s revised Pillar 3 disclosure requirements.
Regulatory Treatment of Accounting Provisions for Expected Credit Losses—Interim Approach and Transitional Arrangements
In March 2017, the Basel Committee issued a final rule that retains, for an interim period, the current Basel III treatment, under both the Standardized Approach and Internal Ratings-Based Approaches, applicable to accounting provisions for credit losses. Such measure is in recognition of the promulgation by both the International Accounting Standards Board and more recently the U.S. Financial Accounting Standards Board of new accounting pronouncements (IFRS 9, “Financial Instruments,” and ASU No. 2016-13, “Financial Instruments—Credit Losses,” respectively) regarding the impairment of financial assets and adoption of provisioning standards which incorporate forward-looking assessments in the estimation of expected credit losses, which represents a substantial departure from the recognition of credit losses under the current incurred loss model. Measuring the impairment of loans and other financial assets under expected credit loss models may result in earlier recognition of, and higher accounting provisions for, credit losses, and consequently may increase volatility in regulatory capital. The current Basel III treatment is being retained so as to afford the Basel Committee additional time in which to thoroughly consider and develop a permanent regulatory capital treatment with respect to accounting provisions for expected credit losses.
Moreover, the final rule provides for optional transitional arrangements, which may be availed by jurisdictions, that would permit banking organizations to more evenly absorb the potentially significant adverse impact on regulatory capital arising from the recognition of higher expected credit loss provisions. The final rule also establishes standards with which these transitional arrangements must comply.
The U.S. banking agencies may revise the Basel III rules in the future in conjunction with the adoption by U.S. banking organizations of the current expected credit loss model as set forth under ASU 2016-13.
Revised Assessment Framework for Global Systemically Important Banks
In March 2017, the Basel Committee issued a consultative document which proposes revisions to the framework for assessing the global systemic importance of banks. The current framework employed by the Basel Committee as to the identification of GSIBs and the assessment of a surcharge is based primarily on quantitative measurement indicators underlying five equally weighted broad categories of systemic importance: (i) size, (ii) interconnectedness, (iii) cross-jurisdictional activity, (iv) substitutability/financial institution infrastructure, and (v) complexity. With the exception of size, each of the other categories is composed of multiple indicators, amounting to 12 indicators in total.
The proposal, which reflects the results of the Basel Committee’s planned initial review, sets forth several modifications to its GSIB framework, the most significant of
which for Citi would be the removal of the existing cap on the substitutability/financial institution infrastructure category. Among the other changes proposed by the Basel Committee and estimated to be of lesser impact to Citi, would be the introduction within the substitutability/financial institution infrastructure category of a trading volume indicator, accompanied by an equivalent reduction in the current weighting of the existing underwriting indicator. Moreover, the Basel Committee’s proposed requirement to expand the scope of consolidation to include exposures of insurance subsidiaries within the size, interconnectedness, and complexity categories would raise the global aggregate of these respective measures of systemic importance to which all GSIBs are subject, and as a result it is estimated that Citi would benefit on a relative basis vis-a-vis certain other GSIBs, given that its insurance subsidiaries are presently consolidated under U.S. generally accepted accounting principles and for regulatory purposes. Aside from these proposed modifications, the Basel Committee is also separately seeking feedback on the potential for a new indicator regarding short-term wholesale funding.
In contrast, a U.S. bank holding company that is designated a GSIB under the Federal Reserve Board’s rule is required, on an annual basis, to calculate a surcharge using two methods, and is subject to the higher of the resulting two surcharges. The first method (“method 1”) is based on the same five broad categories of systemic importance resident under the Basel Committee’s framework to identify a GSIB and derive a surcharge. Under the second method (“method 2”), the substitutability category is replaced with a quantitative measure intended to assess the extent of a GSIB’s reliance on short-term wholesale funding.
Accordingly, if the Federal Reserve Board were to adopt the Basel Committee’s proposed revisions with respect to the U.S. GSIB framework, Citi’s method 1 GSIB surcharge could potentially increase, while its method 2 GSIB surcharge would remain unchanged. Further, while it is currently estimated that under these circumstances method 2 would remain Citi’s binding constraint for GSIB surcharge purposes, nonetheless an increase in Citi’s method 1 GSIB surcharge could impact the extent to which Citi satisfies certain TLAC minimum requirements in the future.
Revisions to the Securitization Framework
In July 2017, the Basel Committee issued two consultative documents: one which establishes criteria for identifying “simple, transparent, and comparable” (STC) short-term securitizations, and another which provides for an alternative, and potentially preferential, regulatory capital treatment for short-term securitizations identified as STC. The Basel Committee had previously issued criteria solely for identifying STC securitizations in July 2015, and also previously issued an alternative regulatory capital treatment for STC securitizations in July 2016. The July 2017 consultative documents, however, introduce identification criteria and regulatory capital treatments that are uniquely tailored to short-term securitizations, with a focus on exposures related to asset-backed commercial paper conduits.
The U.S. banking agencies may revise the regulatory capital treatment of STC short-term securitizations in the future, based upon any revisions adopted by the Basel Committee.
Identification and Management of Step-in Risk
In October 2017, the Basel Committee issued final guidelines regarding the identification and management of so-called “step-in risk,” which is defined as “the risk that a bank decides to provide financial support to an unconsolidated entity that is facing stress, in the absence of, or in excess of, any contractual obligations to provide such support.” The guidelines establish a framework to be used by banks for conducting a self-assessment of step-in risk, which would also be reported to each bank’s respective national supervisors. The self-assessment of step-in risk should consider the risk characteristics of certain unconsolidated entities, as well as the bank’s relationship to such entities. The framework, however, does not require any additional regulatory capital or liquidity charges beyond the current Basel III rules.
The Basel Committee expects the guidelines to be enacted by member jurisdictions no later than 2020. The U.S. banking agencies may issue guidelines regarding the identification and measurement of step-in risk in the future, as a result of the Basel Committee’s guidelines.
Tangible Common Equity, Tangible Book Value Per Share, Book Value Per Share and Returns on Equity
Tangible common equity (TCE), as defined by Citi, represents common equity less goodwill and other intangible assets (other than MSRs). Other companies may calculate TCE in a different manner. TCE, tangible book value per share and returns on average TCE are non-GAAP financial measures. Citi believes these capital metrics provide alternative measures of capital strength and performance and are commonly used by investors and industry analysts.
|
|
|
|
|
|
|
|
In millions of dollars or shares, except per share amounts |
December 31,
2017 |
December 31,
2016 |
Total Citigroup stockholders’ equity |
$ |
200,740 |
|
$ |
225,120 |
|
Less: Preferred stock |
19,253 |
|
19,253 |
|
Common stockholders’ equity |
$ |
181,487 |
|
$ |
205,867 |
|
Less: |
|
|
Goodwill |
22,256 |
|
21,659 |
|
Intangible assets (other than MSRs) |
4,588 |
|
5,114 |
|
Goodwill and intangible assets (other than MSRs) related to assets held-for-sale (HFS) |
32 |
|
72 |
|
Tangible common equity (TCE) |
$ |
154,611 |
|
$ |
179,022 |
|
Common shares outstanding (CSO) |
2,569.9 |
|
2,772.4 |
|
Book value per share (common equity/CSO) |
$ |
70.62 |
|
$ |
74.26 |
|
Tangible book value per share (TCE/CSO) |
60.16 |
|
64.57 |
|
In millions of dollars |
Year ended December 31, 2017(1)
|
Year ended December 31, 2016 |
Net income less preferred dividends |
$ |
14,583 |
|
$ |
13,835 |
|
Average common stockholders’ equity |
$ |
207,747 |
|
$ |
209,629 |
|
Average TCE |
$ |
180,458 |
|
$ |
182,135 |
|
Less: Average net DTAs excluded from Common Equity Tier 1 Capital(2)
|
28,569 |
|
29,013 |
|
Average TCE, excluding net DTAs excluded from Common Equity Tier 1 Capital |
$ |
151,889 |
|
$ |
153,122 |
|
Return on average common stockholders’ equity |
7.0 |
% |
6.6 |
% |
Return on average TCE (ROTCE)(3)
|
8.1 |
|
7.6 |
|
Return on average TCE, excluding net DTAs excluded from Common Equity Tier 1 Capital |
9.6 |
|
9.0 |
|
|
|
(1) |
Year ended December 31, 2017 excludes the impact of Tax Reform. For a reconciliation of these measures, see “Impact of Tax Reform” above. |
|
|
(2) |
Represents average net DTAs excluded in arriving at Common Equity Tier 1 Capital under full implementation of the U.S. Basel III rules. |
|
|
(3) |
ROTCE represents net income available to common shareholders as a percentage of average TCE. |
RISK FACTORS
The following discussion sets forth what management currently believes could be the most significant risks and uncertainties that could impact Citi’s businesses, results of operations and financial condition. Other risks and uncertainties, including those not currently known to Citi or its management, could also negatively impact Citi’s businesses, results of operations and financial condition. Thus, the following should not be considered a complete discussion of all of the risks and uncertainties Citi may face.
STRATEGIC RISKS
Citi’s Ability to Return Capital to Common Shareholders Consistent with Its Capital Optimization Efforts Substantially Depends on the CCAR Process and the Results of Regulatory Stress Tests.
In addition to Board of Director approval, Citi’s ability to return capital to its common shareholders consistent with its capital optimization efforts, whether through its common stock dividend or through a share repurchase program, substantially depends on regulatory approval, including through the CCAR process required by the Federal Reserve Board and the supervisory stress tests required under the Dodd-Frank Act. For additional information on Citi’s return of capital to common shareholders in 2017 as well as the CCAR process and supervisory stress test requirements, see “Capital Resources—Overview” and “Capital Resources—Stress Testing Component of Capital Planning” above.
Citi’s ability to accurately predict, interpret or explain to stakeholders the outcome of the CCAR process, and thus address any such market or investor perceptions, is difficult as the Federal Reserve Board’s assessment of Citi’s capital adequacy is conducted using the Board’s proprietary stress test models, as well as a number of qualitative factors, including a detailed assessment of Citi’s “capital adequacy process,” as defined by the Board. The Federal Reserve Board has stated that it expects leading capital adequacy practices will continue to evolve and will likely be determined by the Board each year as a result of its cross-firm review of capital plan submissions. Similarly, the Federal Reserve Board has indicated that, as part of its stated goal to continually evolve its annual stress testing requirements, several parameters of the annual stress testing process may be altered from time to time, including the severity of the stress test scenario, the Federal Reserve Board modeling of Citi’s balance sheet and the addition of components deemed important by the Federal Reserve Board (e.g., additional macroprudential considerations such as funding and liquidity shocks).
Moreover, in 2016, senior officials at the Federal Reserve Board indicated that the Board was considering integration of the annual stress testing requirements with ongoing regulatory capital requirements. While there has been no formal proposal from the Federal Reserve Board to date, changes to the stress testing regime being discussed, among others, include introduction of a firm-specific “stress capital buffer” (SCB), which would be equal to the maximum decline in a firm’s Common Equity Tier 1 Capital ratio under a severely adverse
scenario over a nine-quarter CCAR measurement period, subject to a minimum requirement of 2.5%. Accordingly, a firm’s SCB would change annually based on its stress test results in the prior year. Officials discussed the idea that the SCB would replace the capital conservation buffer in both the firm’s ongoing regulatory capital requirements and as part of the floor for capital distributions in the CCAR process. Federal Reserve Board senior officials also noted that introduction of the SCB would have the effect of incorporating a firm’s then-effective GSIB surcharge into its post-stress test minimum capital requirements, which the Board has previously indicated it is considering.
Although various uncertainties exist regarding the extent of, and the ultimate impact to Citi from, these changes to the Federal Reserve Board’s stress testing and CCAR regimes, these changes would likely increase the level of capital Citi is required to hold, thus potentially impacting the extent to which Citi is able to return capital to shareholders.
Citi, Its Management and Businesses Must Continually Review, Analyze and Successfully Adapt to Ongoing Regulatory and Other Uncertainties and Changes in the U.S. and Globally.
Despite the adoption of final regulations in numerous areas impacting Citi and its businesses over the past several years, Citi, its management and businesses continually face ongoing regulatory uncertainties and changes, both in the U.S. and globally. While the areas of ongoing regulatory uncertainties and changes facing Citi are too numerous to list completely, various examples include, but are not limited to (i) uncertainties and potential fiscal, monetary and regulatory changes arising from the U.S. Presidential administration and Congress; (ii) potential changes to various aspects of the regulatory capital framework applicable to Citi (see the CCAR risk factor and “Capital Resources—Regulatory Capital Standards Developments” above); and (iii) the terms of and other uncertainties resulting from the U.K.’s potential exit from the European Union (EU) (see the macroeconomic challenges and uncertainties risk factor below).
Ongoing regulatory uncertainties and changes make Citi’s and its management’s long-term business, balance sheet and budget planning difficult or subject to change. For example, the U.S. Presidential administration has discussed various changes to certain regulatory requirements, which would require ongoing assessment by management as to the impact to Citi, its businesses and business planning. Business planning is required to be based on possible or proposed rules or outcomes, which can change dramatically upon finalization, or upon implementation or interpretive guidance from numerous regulatory bodies worldwide, and such guidance can change.
Moreover, U.S. and international regulatory initiatives have not always been undertaken or implemented on a coordinated basis, and areas of divergence have developed and continue to develop with respect to the scope, interpretation, timing, structure or approach, leading to inconsistent or even conflicting regulations, including within a single jurisdiction. For example, in 2016, the European Commission proposed to introduce a new requirement for major banking groups
headquartered outside the EU (which would include Citi) to establish an intermediate EU holding company where the foreign bank has two or more institutions (broadly meaning banks, broker-dealers and similar financial firms) established in the EU. While the proposal mirrors an existing U.S. requirement for non-U.S. banking organizations to form U.S. intermediate holding companies, if adopted, it could lead to additional complexity with respect to Citi’s resolution planning, capital and liquidity allocation and efficiency in various jurisdictions. Regulatory changes have also significantly increased Citi’s compliance risks and costs (see the implementation and interpretation of regulatory changes risk factor below).
Citi’s Ability to Utilize Its DTAs, and Thus Reduce the Negative Impact of the DTAs on Citi’s Regulatory Capital, Will Be Driven by Its Ability to Generate U.S. Taxable Income and by the Provisions of and Guidance Issued in Connection with Tax Reform.
At December 31, 2017, after the $22.6 billion remeasurement of DTAs due to the impact of Tax Reform, Citi’s net DTAs were $22.5 billion, net of a valuation allowance of $9.4 billion, of which $12.3 billion was excluded from Citi’s Common Equity Tier 1 Capital, on a fully implemented basis, under the U.S. Basel III rules (for additional information, see “Capital Resources—Components of Citigroup Capital Under Basel III (Advanced Approaches with Full Implementation)” above). Of the net DTAs at December 31, 2017, $7.6 billion related to foreign tax credit carry-forwards (FTCs), net of a valuation allowance. The carry-forward utilization period for FTCs is 10 years and represents the most time-sensitive component of Citi’s DTAs. The FTC carry-forwards at December 31, 2017 expire over the period of 2018–2027. Citi must utilize any FTCs generated in the then-current year tax return prior to utilizing any carry-forward FTCs.
The accounting treatment for realization of DTAs, including FTCs, is complex and requires significant judgment and estimates regarding future taxable earnings in the jurisdictions in which the DTAs arise and available tax planning strategies. Citi’s ability to utilize its DTAs, including the FTC components, will be dependent upon Citi’s ability to generate U.S. taxable income in the relevant tax carry-forward periods. Failure to realize any portion of the DTAs would also have a corresponding negative impact on Citi’s net income.
Citi expects transitional guidance from the U.S. Department of the Treasury (U.S. Treasury) in 2018 regarding the required allocation of existing FTC carry-forwards to the appropriate FTC baskets as redefined by Tax Reform. The U.S. Treasury is also expected to provide transitional guidance that addresses the allocation of the overall domestic loss (ODL) to these FTC baskets. An ODL allows a company to recharacterize domestic income as income from sources outside the U.S., which enables a taxpayer to use FTC carry-forwards and FTCs generated in future years, assuming the generation of sufficient U.S. taxed income. If the guidance issued by the U.S. Treasury differs from Citi’s assumptions, the valuation allowance against Citi’s FTC carry-forwards would increase or decrease, depending upon the guidance received. Citi’s net income would change by a corresponding
amount. However, a change in recognized FTC carry-forwards would not impact Citi’s regulatory capital, given that such amounts are already fully disallowed.
Citi does not expect to be subject to the Base Erosion Anti-Abuse Tax (BEAT) added by Tax Reform. However, U.S. Treasury guidance regarding BEAT could affect Citi’s decisions as to how to structure its non-U.S. operations, possibly in a less cost efficient manner. In addition, if BEAT were to be applicable to Citi in any given year, it could have a significantly adverse effect on both Citi’s net income and regulatory capital.
For additional information on the impact of Tax Reform and on Citi’s DTAs, including the FTCs, see “Significant Accounting Policies and Significant Estimates—Income Taxes” below and Notes 1 and 9 to the Consolidated Financial Statements.
Citi’s Interpretation or Application of the Complex Tax Laws to Which It Is Subject Could Differ from Those of the Relevant Governmental Authorities, Which Could Result in the Payment of Additional Taxes, Penalties or Interest.
Citi is subject to the various tax laws of the U.S. and its states and municipalities, as well as the numerous non-U.S. jurisdictions in which it operates. These tax laws are inherently complex and Citi must make judgments and interpretations about the application of these laws, including Tax Reform as mentioned above, to its entities, operations and businesses. Citi’s interpretations and application of the tax laws, including with respect to Tax Reform, withholding tax obligations and stamp and other transactional taxes, could differ from that of the relevant governmental taxing authority, which could result in the payment of additional taxes, penalties or interest, which could be material.
Citi’s Ongoing Investments and Efficiency Initiatives May Not Be as Successful as It Projects or Expects.
Citi continues to make important investments to streamline its infrastructure and improve its client experience. For example, Citi has been investing in higher return businesses, including the U.S. cards and wealth management businesses in Global Consumer Banking as well as certain businesses in Institutional Clients Group, such as equities. Citi continues to invest in its technology systems to enhance its digital capabilities across the franchise. In addition, in 2016, Citi announced a more than $1 billion investment in Citibanamex that is expected to be completed by 2020. Citi’s investment strategy will likely continue to evolve and change as its business strategy and priorities change. Citi also has been pursuing efficiency savings through its technology and digital initiatives, location strategy and organizational simplification.
These investments and efficiency initiatives are being undertaken as part of Citi’s overall strategy to meet operational and financial objectives and targets, including earnings growth expectations. There is no guarantee that these or other initiatives Citi may pursue in its businesses or operations will be as productive or effective as Citi expects, or at all. Further, Citi’s ability to achieve expected returns on its investments and costs savings depends, in part, on factors that it cannot control, such as macroeconomic conditions, customer
and client reactions and ongoing regulatory changes, among others.
Citi Has Co-Branding and Private Label Credit Card Relationships with Various Retailers and Merchants and the Failure to Maintain These Relationships Could Have a Negative Impact on Citi’s Results of Operations or Financial Condition.
Citi has co-branding and private label relationships through its Citi-branded cards and Citi retail services credit card businesses with various retailers and merchants globally in the ordinary course of business whereby Citi issues credit cards to customers of the retailers or merchants. Citi’s co-branding and private label agreements provide for shared economics between the parties and generally have a fixed term. The five largest relationships constituted an aggregate of approximately 11% of Citi’s revenues for 2017.
These relationships could be negatively impacted due to, among other things, declining sales and revenues or other difficulties of the retailer or merchant, termination due to a breach by Citi, the retailer or merchant of its responsibilities, or external factors, including bankruptcies, liquidations, restructurings, consolidations and other similar events. Over the last several years, a number of retailers in the U.S. have continued to experience declining sales, which has resulted in significant numbers of store closures and, in a number of cases, bankruptcies, as retailers attempt to cut costs and compete with online retailers. In addition, as has been widely reported, competition among card issuers, including Citi, for these relationships is significant, and it has become increasingly difficult in recent years to maintain such relationships on the same terms or at all. While various mitigating factors could be available to Citi if any of these events were to occur—such as by replacing the retailer or merchant or offering other card products—such events could negatively impact Citi’s results of operations or financial condition, including as a result of loss of revenues, higher cost of credit, impairment of purchased credit card relationships and contract-related intangibles or other losses (for information on Citi’s credit card related intangibles generally, see Note 16 to the Consolidated Financial Statements).
Macroeconomic and Geopolitical Challenges and Uncertainties Globally Could Have a Negative Impact on Citi’s Businesses and Results of Operations.
Citi has experienced, and could experience in the future, negative impacts to its businesses and results of operations as a result of macroeconomic and geopolitical challenges, uncertainties and volatility. As a result of a 2016 U.K. referendum, the U.K. triggered Article 50 in March 2017, beginning the two-year period in which the U.K. will negotiate its exit from the EU. Since then, numerous uncertainties have arisen, including, among others, (i) potential changes to Citi’s legal entity and booking model strategy and/or structure in both the U.K. and the EU based on the outcome of negotiations relating to the regulation of financial services; (ii) the potential impact of the exit to the U.K. and European economies and other financial markets; and (iii) the potential
impact to Citi’s exposures to counterparties as a result of any economic slowdown in the U.K. or Europe.
In addition, governmental fiscal and monetary actions, or expected actions, such as changes in the federal funds rate and any balance sheet normalization program implemented by the Federal Reserve Board or other central banks, could impact interest rates, economic growth rates, the volatilities of global financial markets, foreign exchange rates and capital flows among countries. Although Citi estimates its overall net interest revenue would generally increase due to higher interest rates, higher rates could adversely affect Citi’s funding costs, levels of deposits in its consumer and institutional businesses and certain business or product revenues. Also, the U.S. Presidential administration has indicated it may pursue protectionist trade and other policies, which could result in additional macroeconomic and/or geopolitical challenges, uncertainties and volatilities. Further, the economic and fiscal situations of certain European countries have remained fragile, and concerns and uncertainties remain in Europe over the potential exit of additional countries from the EU.
These and other global macroeconomic and geopolitical challenges, uncertainties and volatilities have negatively impacted, and could continue to negatively impact, Citi’s businesses, results of operations and financial condition, including its credit costs, revenues in its Markets and securities services and other businesses, and AOCI (which would in turn negatively impact Citi’s book and tangible book value).
Citi’s Presence in the Emerging Markets Subjects It to Various Risks as well as Increased Compliance and Regulatory Risks and Costs.
During 2017, emerging markets revenues accounted for approximately 36% of Citi’s total revenues (Citi generally defines emerging markets as countries in Latin America, Asia (other than Japan, Australia and New Zealand), Central and Eastern Europe, the Middle East and Africa).
Citi’s presence in the emerging markets subjects it to a number of risks, including sovereign volatility, political events, foreign exchange controls, limitations on foreign investment, sociopolitical instability (including from hyper-inflation), fraud, nationalization or loss of licenses, business restrictions, sanctions or asset freezes, potential criminal charges, closure of branches or subsidiaries and confiscation of assets. For example, Citi operates in several countries that have, or have had in the past, strict foreign exchange controls, such as Argentina, that limit its ability to convert local currency into U.S. dollars and/or transfer funds outside the country. In prior years, Citi has also discovered fraud in certain emerging markets in which it operates. Political turmoil and other instability have occurred in certain regions and countries, including Asia, the Middle East and Latin America, which have required management time and attention in prior years (e.g., monitoring the impact of sanctions on the Venezuelan and other countries’ economies as well as Citi’s businesses and results of operations).
Citi’s emerging markets presence also increases its compliance and regulatory risks and costs. For example, Citi’s operations in emerging markets, including facilitating cross-
border transactions on behalf of its clients, subject it to higher compliance risks under U.S. regulations primarily focused on various aspects of global corporate activities, such as anti-money laundering regulations and the Foreign Corrupt Practices Act. These risks can be more acute in less-developed markets and thus require substantial investment in compliance infrastructure or could result in a reduction in certain of Citi’s business activities. Any failure by Citi to comply with applicable U.S. regulations, as well as the regulations in the countries and markets in which it operates as a result of its global footprint, could result in fines, penalties, injunctions or other similar restrictions, any of which could negatively impact Citi’s results of operations and reputation.
Citi’s Inability in Its Resolution Plan Submissions to Address Any Deficiencies Identified or Future Guidance Provided by the Federal Reserve Board and FDIC Could Subject Citi to More Stringent Capital, Leverage or Liquidity Requirements, or Restrictions on Its Growth, Activities or Operations, and Could Eventually Require Citi to Divest Assets or Operations.
Title I of the Dodd-Frank Act requires Citi to prepare and submit a plan to the Federal Reserve Board and the FDIC for the orderly resolution of Citigroup (the bank holding company) and its significant legal entities, under the U.S. Bankruptcy Code in the event of future material financial distress or failure. Citi submitted its most recent resolution plan in July 2017. On December 19, 2017, the Federal Reserve and the FDIC informed Citi that (i) the agencies jointly decided that Citi’s 2017 resolution plan submission satisfactorily addressed the shortcomings identified in the 2015 resolution plan submission, and (ii) the agencies did not identify any deficiencies in the 2017 resolution plan submission. Citi’s next resolution plan submission is due July 1, 2019. For additional information on Citi’s 2017 resolution plan submission, see “Managing Global Risk—Liquidity Risk” below.
Under Title I, if the Federal Reserve Board and the FDIC jointly determine that Citi’s resolution plan is not “credible” (which, although not defined, is generally believed to mean the regulators do not believe the plan is feasible or would otherwise allow the regulators to resolve Citi in a way that protects systemically important functions without severe systemic disruption), or would not facilitate an orderly resolution of Citi under the U.S. Bankruptcy Code, and Citi fails to resubmit a resolution plan that remedies any identified deficiencies, Citi could be subjected to more stringent capital, leverage or liquidity requirements, or restrictions on its growth, activities or operations. If within two years from the imposition of any requirements or restrictions Citi has still not remediated any identified deficiencies, then Citi could eventually be required to divest certain assets or operations. Any such restrictions or actions would negatively impact Citi’s reputation, market and investor perception, operations and strategy.
Citi’s Performance and the Performance of Its Individual Businesses Could Be Negatively Impacted if Citi Is Not Able to Hire and Retain Highly Qualified Employees for Any Reason.
Citi’s performance and the performance of its individual businesses largely depends on the talents and efforts of its highly skilled employees. Specifically, Citi’s continued ability to compete in its businesses, to manage its businesses effectively and to continue to execute its overall global strategy depends on its ability to attract new employees and to retain and motivate its existing employees. If Citi is unable to continue to attract and retain the most highly qualified employees for any reason, Citi’s performance, including its competitive position, the successful execution of its overall strategy and its results of operations could be negatively impacted.
Citi’s ability to attract and retain employees depends on numerous factors, some of which are outside of its control. For example, the banking industry generally is subject to more stringent regulation of executive and employee compensation than other industries, including deferral and clawback requirements for incentive compensation. Citi often competes in the market for talent with entities that are not subject to such significant regulatory restrictions on the structure of incentive compensation. Other factors that could impact Citi’s ability to attract and retain employees include its culture, compensation, and the management and leadership of the company as well as its individual businesses, presence in the particular market or region at issue and the professional opportunities it offers.
U.S. and Non-U.S. Financial Services Companies and Others Pose Increasingly Competitive Challenges to Citi.
Citi operates in an increasingly competitive environment, which includes both financial and non-financial services firms. These companies compete on the basis of, among other factors, quality and type of products and services offered, price, technology and reputation. Citi competes with financial services companies in the U.S. and globally, which continually develop and introduce new products and services. In addition, in recent years, non-financial services firms, such as financial technology firms, have begun to offer services traditionally provided by financial institutions, such as Citi. These firms attempt to use technology and mobile platforms to enhance the ability of companies and individuals to borrow money, save and invest. To the extent it is not able to effectively compete with these and other firms, Citi could be placed at a competitive disadvantage, which could result in loss of customers and market share, and its businesses, results of operations and financial condition could suffer. For additional information on Citi’s competitors, see the co-brand and private label cards risk factor above and “Supervision, Regulation and Other—Competition” below.
CREDIT RISKS
Concentrations of Risk Can Increase the Potential for Citi to Incur Significant Losses.
Concentrations of risk, particularly credit and market risk, can increase Citi’s risk of significant losses. As of year-end 2017, Citi’s most significant concentration of credit risk was with the U.S. government and its agencies, which primarily results from trading assets and investments issued by the U.S. government and its agencies (for additional information, including concentrations of credit risk to other public sector entities, see Note 23 to the Consolidated Financial Statements). Citi also routinely executes a high volume of securities, trading, derivative and foreign exchange transactions with counterparties in the financial services industry, including banks, insurance companies, investment banks, governments, central banks and other financial institutions.
As regulatory or market developments continue to lead to increased centralization of trading activity through particular clearing houses, central agents, exchanges or other financial market utilities, Citi could also experience an increase in concentration of risk to these industries. These concentrations of risk as well as the risk of failure of a large counterparty, central counterparty clearing house or financial market utility could limit the effectiveness of Citi’s hedging strategies and cause Citi to incur significant losses.
LIQUIDITY RISKS
The Maintenance of Adequate Liquidity and Funding Depends on Numerous Factors, Including Those Outside of Citi’s Control, Such as Market Disruptions and Increases in Citi’s Credit Spreads.
As a global financial institution, adequate liquidity and sources of funding are essential to Citi’s businesses. Citi’s liquidity and sources of funding can be significantly and negatively impacted by factors it cannot control, such as general disruptions in the financial markets, governmental fiscal and monetary policies, regulatory changes or negative investor perceptions of Citi’s creditworthiness.
In addition, Citi’s costs to obtain and access secured funding and long-term unsecured funding are directly related to its credit spreads. Changes in credit spreads constantly occur and are market driven, including both external market factors and factors specific to Citi, and can be highly volatile.
Moreover, Citi’s ability to obtain funding may be impaired if other market participants are seeking to access the markets at the same time, or if market appetite is reduced, as is likely to occur in a liquidity or other market crisis. A sudden drop in market liquidity could also cause a temporary or lengthier dislocation of underwriting and capital markets activity. In addition, clearing organizations, regulators, clients and financial institutions with which Citi interacts may exercise the right to require additional collateral based on these market perceptions or market conditions, which could further impair Citi’s access to and cost of funding.
As a holding company, Citi relies on interest, dividends, distributions and other payments from its subsidiaries to fund
dividends as well as to satisfy its debt and other obligations. Several of Citi’s U.S. and non-U.S. subsidiaries are or may be subject to capital adequacy or other regulatory or contractual restrictions on their ability to provide such payments, including any local regulatory stress test requirements. Limitations on the payments that Citi receives from its subsidiaries could also impact its liquidity.
The Credit Rating Agencies Continuously Review the Credit Ratings of Citi and Certain of Its Subsidiaries, and Ratings Downgrades Could Have a Negative Impact on Citi’s Funding and Liquidity Due to Reduced Funding Capacity and Increased Funding Costs, Including Derivatives Triggers That Could Require Cash Obligations or Collateral Requirements.
The credit rating agencies, such as Fitch, Moody’s and S&P, continuously evaluate Citi and certain of its subsidiaries, and their ratings of Citi and its more significant subsidiaries’ long-term/senior debt and short-term/commercial paper, as applicable, are based on a number of factors, including standalone financial strength, as well as factors not entirely within the control of Citi and its subsidiaries, such as the agencies’ proprietary rating agency methodologies and assumptions and conditions affecting the financial services industry and markets generally.
Citi and its subsidiaries may not be able to maintain their current respective ratings. Ratings downgrades could negatively impact Citi’s ability to access the capital markets and other sources of funds as well as the costs of those funds, and its ability to maintain certain deposits. A ratings downgrade could also have a negative impact on Citi’s funding and liquidity due to reduced funding capacity, as well as the impact of derivative triggers, which could require Citi to meet cash obligations and collateral requirements. In addition, a ratings downgrade could also have a negative impact on other funding sources, such as secured financing and other margined transactions for which there may be no explicit triggers, as well as on contractual provisions and other credit requirements of Citi’s counterparties and clients, which may contain minimum ratings thresholds in order for Citi to hold third-party funds.
Moreover, credit ratings downgrades can have impacts that may not be currently known to Citi or are not possible to quantify. For example, some entities may have ratings limitations as to their permissible counterparties, of which Citi may or may not be aware. In addition, certain of Citi’s corporate customers and trading counterparties, among other clients, could re-evaluate their business relationships with Citi and limit the trading of certain contracts or market instruments with Citi in response to ratings downgrades. Changes in customer and counterparty behavior could impact not only Citi’s funding and liquidity but also the results of operations of certain Citi businesses. For additional information on the potential impact of a reduction in Citi’s or Citibank’s credit ratings, see “Managing Global Risk—Liquidity Risk” below.
OPERATIONAL RISKS
A Disruption of Citi’s Operational Systems Could Negatively Impact Citi’s Reputation, Customers, Clients, Businesses or Results of Operations and Financial Condition.
A significant portion of Citi’s operations relies heavily on the secure processing, storage and transmission of confidential and other information as well as the monitoring of a large number of complex transactions on a minute-by-minute basis. For example, through its Global Consumer Banking and credit card and securities services businesses in Institutional Clients Group, Citi obtains and stores an extensive amount of personal and client-specific information for its retail, corporate and governmental customers and clients and must accurately record and reflect their extensive account transactions.
With the evolving proliferation of new technologies and the increasing use of the Internet, mobile devices and cloud technologies to conduct financial transactions, large global financial institutions such as Citi have been, and will continue to be, subject to an increasing risk of operational disruption or cyber or information security incidents from these activities (for additional information on cybersecurity risk, see the discussion below). These incidents are unpredictable and can arise from numerous sources, not all of which are in Citi’s control, including among others human error, fraud or malice on the part of employees, accidental technological failure, electrical or telecommunication outages, failures of computer servers or other similar damage to Citi’s property or assets. These issues can also arise as a result of failures by third parties with which Citi does business, such as failures by Internet, mobile technology and cloud service providers or other vendors to adequately safeguard their systems and prevent system disruptions or cyber attacks.
Such events could cause interruptions or malfunctions in the operations of Citi (such as the temporary loss of availability of Citi’s online banking system or mobile banking platform), as well as the operations of its clients, customers or other third parties. Given Citi’s global footprint and the high volume of transactions processed by Citi, certain errors or actions may be repeated or compounded before they are discovered and rectified, which would further increase these costs and consequences. Any such events could also result in financial losses as well as misappropriation, corruption or loss of confidential and other information or assets, which could negatively impact Citi’s reputation, customers, clients, businesses or results of operations and financial condition, perhaps significantly.
Citi’s and Third Parties’ Computer Systems and Networks Have Been, and Will Continue to Be, Subject to an Increasing Risk of Continually Evolving, Sophisticated Cybersecurity Risks That Could Result in the Theft, Loss, Misuse or Disclosure of Confidential Client or Customer Information, Damage to Citi’s Reputation, Additional Costs to Citi, Regulatory Penalties, Legal Exposure and Financial Losses.
Citi’s computer systems, software and networks are subject to ongoing cyber incidents such as unauthorized access, loss or destruction of data (including confidential client information),
account takeovers, unavailability of service, computer viruses or other malicious code, cyber attacks and other similar events. These threats can arise from external parties, including criminal organizations, extremist parties and certain foreign state actors that engage in cyber activities.
Third parties with which Citi does business, as well as retailers and other third parties with which Citi’s customers do business, may also be sources of cybersecurity risks, particularly where activities of customers are beyond Citi’s security and control systems. For example, Citi outsources certain functions, such as processing customer credit card transactions, uploading content on customer-facing websites, and developing software for new products and services. These relationships allow for the storage and processing of customer information by third-party hosting of or access to Citi websites, which could result in compromise or the potential to introduce vulnerable or malicious code, resulting in security breaches impacting Citi customers. Furthermore, because financial institutions are becoming increasingly interconnected with central agents, exchanges and clearing houses, including as a result of the derivatives reforms over the last few years, Citi has increased exposure to cyber attacks through third parties.
As further evidence of the increasing and potentially significant impact of cyber incidents, in 2017, a credit bureau reported a cyber incident that impacted sensitive information of an estimated 143 million consumers. In addition, in recent years, several U.S. retailers and financial institutions and other multinational companies reported cyber incidents that compromised customer data or resulted in theft of funds or theft or destruction of corporate information or other assets. Moreover, the U.S. government as well as several multinational companies reported cyber incidents in prior years that affected their computer systems resulting in the data of millions of customers and employees being compromised. These incidents have resulted in increased legislative and regulatory scrutiny of firms’ cybersecurity protection services and calls for additional laws and regulations to further enhance protection of consumers’ personal data.
While Citi has not been materially impacted by these reported or other cyber incidents, Citi has been subject to other intentional cyber incidents from external sources over the last several years, including (i) denial of service attacks, which attempted to interrupt service to clients and customers, (ii) data breaches, which obtained unauthorized access to customer account data and (iii) malicious software attacks on client systems, which attempted to allow unauthorized entrance to Citi’s systems under the guise of a client and the extraction of client data. While Citi’s monitoring and protection services were able to detect and respond to the incidents targeting its systems before they became significant, they still resulted in limited losses in some instances as well as increases in expenditures to monitor against the threat of similar future cyber incidents. There can be no assurance that such cyber incidents will not occur again, and they could occur more frequently and on a more significant scale.
Further, although Citi devotes significant resources to implement, maintain, monitor and regularly upgrade its systems and networks with measures such as intrusion
detection and prevention and firewalls to safeguard critical business applications, there is no guarantee that these measures or any other measures can provide absolute security. Because the methods used to cause cyber attacks change frequently or, in some cases, are not recognized until launched, Citi may be unable to implement effective preventive measures or proactively address these methods until they are discovered. In addition, while Citi engages in certain actions to reduce the exposure resulting from outsourcing, such as performing onsite security control assessments and limiting third-party access to the least privileged level necessary to perform job functions, these actions cannot prevent all external cyber attacks, information breaches or similar losses.
Cyber incidents can result in the disclosure of personal, confidential or proprietary customer or client information, damage to Citi’s reputation with its clients and the market, customer dissatisfaction, additional costs (including credit costs) to Citi (such as repairing systems, replacing customer payment cards or adding new personnel or protection technologies), regulatory penalties, loss of revenues, exposure to litigation and other financial losses, including loss of funds, to both Citi and its clients and customers (for additional information on the potential impact from cyber incidents, see the operational systems risk factor above).
While Citi maintains insurance coverage that may, subject to policy terms and conditions including significant self-insured deductibles, cover certain aspects of cyber risks, such insurance coverage may be insufficient to cover all losses.
Incorrect Assumptions or Estimates in Citi’s Financial Statements Could Cause Significant Unexpected Losses in the Future, and Changes to Financial Accounting and Reporting Standards or Interpretations Could Have a Material Impact on How Citi Records and Reports Its Financial Condition and Results of Operations.
U.S. GAAP requires Citi to use certain assumptions and estimates in preparing its financial statements, including reserves related to litigation and regulatory exposures, valuation of DTAs, the estimate of the allowance for credit losses and the fair values of certain assets and liabilities, among other items. If Citi’s assumptions or estimates underlying its financial statements are incorrect or differ from actual future events, Citi could experience unexpected losses, some of which could be significant.
The Financial Accounting Standards Board (FASB) has issued several financial accounting and reporting standards that will govern key aspects of Citi’s financial statements or interpretations thereof when those standards become effective, including those areas where Citi is required to make assumptions or estimates. For example, the FASB’s new accounting standard on credit losses, which will become effective for Citi on January 1, 2020, will require earlier recognition of credit losses on financial assets. The new accounting model requires that lifetime “expected credit losses” on financial assets not recorded at fair value through net income, such as loans and held-to-maturity securities, be recorded at inception of the financial asset, replacing the
multiple existing impairment models under U.S. GAAP that generally require that a loss be “incurred” before it is recognized (for additional information on this and other accounting standards, see “Significant Accounting Policies and Significant Estimates” below).
Changes to financial accounting or reporting standards or interpretations, whether promulgated or required by the FASB or other regulators, could present operational challenges and could require Citi to change certain of the assumptions or estimates it previously used in preparing its financial statements, which could negatively impact how it records and reports its financial condition and results of operations generally and/or with respect to particular businesses. For additional information on the key areas for which assumptions and estimates are used in preparing Citi’s financial statements, see “Significant Accounting Policies and Significant Estimates” below and Notes 1 and 27 to the Consolidated Financial Statements.
Citi May Incur Significant Losses and Its Regulatory Capital and Capital Ratios Could be Negatively Impacted if Its Risk Management Process, Strategies or Models Are Deficient or Ineffective.
Citi utilizes a broad and diversified set of risk management and mitigation processes and strategies, including the use of various risk models in analyzing and monitoring the various risks Citi assumes in conducting its activities. For example, Citi uses models as part of its various stress testing initiatives across Citi. Citi also relies on data to aggregate, assess and manage various risk exposures. Management of these risks is made even more challenging within a global financial institution such as Citi, particularly given the complex, diverse and rapidly changing financial markets and conditions in which Citi operates.
These processes, strategies and models are inherently limited because they involve techniques, including the use of historical data in many circumstances, and judgments that cannot anticipate every economic and financial outcome in the markets in which Citi operates, nor can they anticipate the specifics and timing of such outcomes. Citi could incur significant losses and its regulatory capital and capital ratios could be negatively impacted, if Citi’s risk management processes, including its ability to manage and aggregate data in a timely and accurate manner, strategies or models are deficient or ineffective. Such deficiencies or ineffectiveness could also result in inaccurate financial, regulatory or risk reporting.
Moreover, Citi’s Basel III regulatory capital models, including its credit, market and operational risk models, currently remain subject to ongoing regulatory review and approval, which may result in refinements, modifications or enhancements (required or otherwise) to these models. Modifications or requirements resulting from these ongoing reviews, as well as any future changes or guidance provided by the U.S. banking agencies regarding the regulatory capital framework applicable to Citi, have resulted in, and could continue to result in, significant changes to Citi’s risk-weighted assets. These changes can negatively impact Citi’s
capital ratios and its ability to achieve its regulatory capital requirements as it projects or as required.
COMPLIANCE, CONDUCT AND LEGAL RISKS
Ongoing Implementation and Interpretation of Regulatory Changes and Requirements in the U.S. and Globally Have Increased Citi’s Compliance Risks and Costs.
As referenced above, over the past several years, Citi has been required to implement a significant number of regulatory changes across all of its businesses and functions, and these changes continue. In some cases, Citi’s implementation of a regulatory requirement is occurring simultaneously with changing or conflicting regulatory guidance, legal challenges or legislative action to modify or repeal existing rules or enact new rules. Moreover, in many cases, these are entirely new regulatory requirements or regimes, resulting in much uncertainty regarding regulatory expectations as to what is definitely required in order to be in compliance. Accompanying this compliance uncertainty is heightened regulatory scrutiny and expectations in the U.S. and globally for the financial services industry with respect to governance and risk management practices, including its compliance and regulatory risks (for a discussion of heightened regulatory expectations on “conduct risk” at, and the overall “culture” of, financial institutions such as Citi, see the legal and regulatory proceedings risk factor below). All of these factors have resulted in increased compliance risks and costs for Citi.
Examples of regulatory changes that have resulted in increased compliance risks and costs include (i) the Federal Reserve Board’s “total loss absorbing capacity” (TLAC) requirements, including consequences of a breach of the external long-term debt (LTD) requirement and the clean holding company requirements, given there are no cure periods for the requirements, and the new “anti-evasion” provision that authorizes the Federal Reserve Board to exclude from a bank holding company’s outstanding external LTD any debt having certain features that would, in the Board’s view, “significantly impair” the debt’s ability to absorb losses; (ii) the Volcker Rule, which requires Citi to maintain an extensive global compliance regime, including significant documentation to support the prohibition against proprietary trading; and (iii) a proliferation of laws relating to the limitation of cross-border data movement, including data localization and protection and privacy laws, which can conflict with or increase compliance complexity with respect to anti-money laundering laws.
Extensive compliance requirements can result in increased reputational and legal risks, as failure to comply with regulations and requirements, or failure to comply as expected, can result in enforcement and/or regulatory proceedings (for additional discussion, see the legal and regulatory proceedings risk factor below). In addition, increased and ongoing compliance requirements and uncertainties have resulted in higher costs for Citi. For example, Citi employed roughly 30,000 risk, regulatory and compliance staff as of year-end 2017, out of a total employee population of 209,000, compared to approximately 14,000 as of year-end 2008 with a total employee population of 323,000.
These higher regulatory and compliance costs can impede Citi’s ongoing, business-as-usual cost reduction efforts, and can also require management to reallocate resources, including potentially away from ongoing business investment initiatives, as discussed above.
Citi Is Subject to Extensive Legal and Regulatory Proceedings, Investigations and Inquiries That Could Result in Significant Penalties and Other Negative Impacts on Citi, Its Businesses and Results of Operations.
At any given time, Citi is defending a significant number of legal and regulatory proceedings and is subject to numerous governmental and regulatory examinations, investigations and other inquiries. Over the last several years, the frequency with which such proceedings, investigations and inquiries are initiated have increased substantially, and the global judicial, regulatory and political environment has generally been unfavorable for large financial institutions. The complexity of the federal and state regulatory and enforcement regimes in the U.S., coupled with the global scope of Citi’s operations, also means that a single event or issue may give rise to a large number of overlapping investigations and regulatory proceedings, either by multiple federal and state agencies in the U.S. or by multiple regulators and other governmental entities in different jurisdictions.
Moreover, U.S. and non-U.S. regulators have been increasingly focused on “conduct risk,” a term used to describe the risks associated with behavior by employees and agents, including third-party vendors utilized by Citi, that could harm clients, customers, investors or the markets, such as improperly creating, selling, marketing or managing products and services or improper incentive compensation programs with respect thereto, failures to safeguard a party’s personal information, or failures to identify and manage conflicts of interest. In addition to increasing Citi’s compliance and reputational risks, this focus on conduct risk could lead to more regulatory or other enforcement proceedings and civil litigation, including for practices which historically were acceptable but are now receiving greater scrutiny. Further, while Citi takes numerous steps to prevent and detect conduct by employees and agents that could potentially harm clients, customers, investors or the markets, such behavior may not always be deterred or prevented. Banking regulators have also focused on the overall culture of financial services firms, including Citi. In addition to regulatory restrictions or structural changes that could result from perceived deficiencies in Citi’s culture, such focus could also lead to additional regulatory proceedings.
Further, the severity of the remedies sought in legal and regulatory proceedings to which Citi is subject has increased substantially in recent years. U.S. and certain international governmental entities have increasingly brought criminal actions against, or have sought criminal convictions from, financial institutions, and criminal prosecutors in the U.S. have increasingly sought and obtained criminal guilty pleas or deferred prosecution agreements against corporate entities and other criminal sanctions from those institutions. For example, in 2015, an affiliate of Citi pleaded guilty to an antitrust violation and paid a substantial fine to resolve a U.S.
Department of Justice investigation into Citi’s foreign exchange business practices. These types of actions by U.S. and international governmental entities may, in the future, have significant collateral consequences for a financial institution, including loss of customers and business, and the inability to offer certain products or services and/or operate certain businesses. Citi may be required to accept or be subject to similar types of criminal remedies, consent orders, sanctions, substantial fines and penalties, remediation and other financial costs or other requirements in the future, including for matters or practices not yet known to Citi, any of which could materially and negatively affect Citi’s businesses, business practices, financial condition or results of operations, require material changes in Citi’s operations or cause Citi reputational harm.
Further, many large claims—both private civil and regulatory—asserted against Citi are highly complex, slow to develop and may involve novel or untested legal theories. The outcome of such proceedings is difficult to predict or estimate until late in the proceedings. Although Citi establishes accruals for its legal and regulatory matters according to accounting requirements, Citi’s estimates of, and changes to, these accruals involve significant judgment and may be subject to significant uncertainty, and the amount of loss ultimately incurred in relation to those matters may be substantially higher than the amounts accrued. In addition, certain settlements are subject to court approval and may not be approved.
For additional information relating to Citi’s legal and regulatory proceedings and matters, including Citi’s policies on establishing legal accruals, see Note 27 to the Consolidated Financial Statements.
Managing Global Risk Table of Contents
|
|
|
|
MANAGING GLOBAL RISK |
|
|
Overview |
|
|
CREDIT RISK(1)
|
|
|
Overview |
|
|
Consumer Credit |
|
|
Corporate Credit |
|
|
Additional Consumer and Corporate Credit Details |
|
|
Loans Outstanding |
|
|
Details of Credit Loss Experience |
|
|
Allowance for Loan Losses |
|
85 |
Non-Accrual Loans and Assets and Renegotiated Loans |
|
|
Forgone Interest Revenue on Loans |
|
89 |
LIQUIDITY RISK |
|
|
Overview |
|
|
High-Quality Liquid Assets (HQLA) |
|
91 |
Loans |
|
91 |
Deposits |
|
92 |
Long-Term Debt |
|
92 |
Secured Funding Transactions and Short-Term Borrowings |
|
95 |
Liquidity Monitoring and Measurement |
|
97 |
Credit Ratings |
|
98 |
MARKET RISK(1)
|
|
|
Overview |
|
|
Market Risk of Non-Trading Portfolios |
|
|
Net Interest Revenue at Risk |
|
|
Interest Rate Risk of Investment Portfolios—Impact on AOCI |
|
|
Changes in Foreign Exchange Rates—Impacts on AOCI and Capital |
|
102 |
Interest Revenue/Expense and Net Interest Margin |
|
|
Additional Interest Rate Details |
|
105 |
Market Risk of Trading Portfolios |
|
|
Factor Sensitivities |
|
110 |
Value at Risk (VAR) |
|
110 |
Stress Testing |
|
114 |
OPERATIONAL RISK |
|
|
COMPLIANCE RISK |
|
|
CONDUCT RISK |
|
116 |
LEGAL RISK |
|
116 |
REPUTATIONAL RISK |
|
|
STRATEGIC RISK |
|
117 |
Country Risk |
|
|
|
|
(1) |
For additional information regarding certain credit risk, market risk and other quantitative and qualitative information, refer to Citi’s Pillar 3 Basel III Advanced Approaches Disclosures, as required by the rules of the Federal Reserve Board, on Citi’s Investor Relations website. |
MANAGING GLOBAL RISK
Overview
For Citi, effective risk management is of primary importance to its overall operations. Accordingly, Citi’s risk management process has been designed to monitor, evaluate and manage the principal risks it assumes in conducting its activities. Specifically, the activities that Citi engages in, and the risks those activities generate, must be consistent with Citi’s mission and value proposition, the key principles that guide it, and Citi's risk appetite.
Risk management must be built on a foundation of ethical culture. Under Citi’s mission and value proposition, which was developed by Citi’s senior leadership and distributed throughout the Company, Citi strives to serve its clients as a trusted partner by responsibly providing financial services that enable growth and economic progress while earning and maintaining the public’s trust by constantly adhering to the highest ethical standards. As such, Citi asks all employees to ensure that their decisions pass three tests: they are in our clients’ interests, create economic value and are always systemically responsible. Additionally, Citi evaluates employees’ performance against behavioral expectations set out in Citi’s leadership standards, which were designed in part to effectuate Citi’s mission and value proposition. Other culture-related efforts in connection with conduct risk, ethics and leadership, escalation, and treating customers fairly help Citi to execute its mission and value proposition.
Citi’s Company-wide risk governance framework consists of the policies, procedures, and processes through which Citi identifies, measures, manages, monitors, reports and controls risks across the Company. It also emphasizes Citi’s risk culture and lays out standards, procedures and programs that are designed and undertaken to enhance the Company’s risk culture, embed this culture deeply within the organization, and give employees tools to make sound and ethical risk decisions and to escalate issues appropriately. The risk governance framework has been developed in alignment with the expectations of the Office of the Comptroller of the Currency (OCC) Heightened Standards. It is also aligned with the relevant components of the Basel Committee on Banking Supervision’s corporate governance principles for banks and relevant components of the Federal Reserve’s Enhanced Prudential Standards for Bank Holding Companies and Foreign Banking Organizations.
Four key principles—common purpose, responsible finance, ingenuity and leadership—guide Citi as it performs its mission. Citi’s risk appetite, which is approved by the Citigroup Board of Directors, specifies the aggregate levels and types of risk the Board and management are willing to assume to achieve Citi’s strategic objectives and business plan, consistent with applicable capital, liquidity and other regulatory requirements.
Citi selectively takes risks in support of its underlying business strategy, while striving to ensure it operates within its mission and value proposition and risk appetite.
Citi’s risks are generally categorized and summarized as follows:
|
|
• |
Credit risk is the risk of loss resulting from the decline in credit quality or failure of a borrower, counterparty, third party or issuer to honor its financial or contractual obligations.
|
|
|
• |
Liquidity risk is the risk that the Company will not be able to efficiently meet both expected and unexpected current and future cash flow and collateral needs without adversely affecting either daily operations or financial condition of the Company. The risk may be exacerbated by the inability of the Company to access funding sources or monetize assets and the composition of liability funding and liquid assets.
|
|
|
• |
Market risk is the risk of loss arising from changes in the value of Citi’s assets and liabilities resulting from changes in market variables, such as interest rates, exchange rates or credit spreads. Losses can be exacerbated by the presence of basis or correlation risks.
|
|
|
• |
Operational risk is the risk of loss resulting from inadequate or failed internal processes, systems, human factors, or from external events. It includes risk of failing to comply with applicable laws and regulations, but excludes strategic risk (see below). It also includes the reputation and franchise risk associated with business practices or market conduct in which Citi is involved as well as compliance, conduct and legal risks. Operational risk is inherent in Citi’s global business activities, as well as related support, and can result in losses arising from events related to fraud, theft and unauthorized activity; employment practices and workplace environment; clients, products and business practices; physical assets and infrastructure; and execution, delivery and process management.
|
|
|
• |
Compliance risk is the risk arising from violations of, or non-conformance with, local, national or cross-border laws, rules or regulations, Citi’s internal policies or other relevant standards of conduct or risk of harming customers, clients or the integrity of the market.
|
|
|
• |
Conduct risk is the risk that Citi’s employees or agents may (intentionally or through negligence) harm customers, clients or the integrity of the markets, and thereby the integrity of Citi.
|
|
|
• |
Legal risk includes the risk from uncertainty due to legal or regulatory actions, proceedings or investigations, or uncertainty in the applicability or interpretation of contracts, laws or regulations.
|
|
|
• |
Reputational risk is the risk to current or anticipated earnings, capital, or franchise or enterprise value arising from negative public opinion.
|
|
|
• |
Strategic risk is the risk to current or anticipated earnings, capital, or franchise or enterprise value arising from poor, but authorized business decisions, an inability to adapt to changes in the operating environment or other external factors that may impair the ability to carry out a business strategy. Strategic risk also includes:
|
|
|
• |
Country risk which is the risk that an event in a country (precipitated by developments within or external to a country) will impair the value of Citi’s franchise or will adversely affect the ability of obligors within that country to honor their
|
obligations. Country risk events may include sovereign defaults, banking crises, currency crises, currency convertibility and/or transferability restrictions, or political events.
Citi manages its risks through each of its three lines of defense: (i) business management, (ii) independent control functions and (iii) internal audit. The three lines of defense collaborate with each other in structured forums and processes to bring various perspectives together and to lead the organization toward outcomes that are in clients’ interests, create economic value and are systemically responsible.
First Line of Defense: Business Management
Each of Citi’s businesses owns its risks and is responsible for assessing and managing its risks. Each business is also responsible for establishing and operating controls to mitigate key risks, assessing internal controls and promoting a culture of compliance and control. In doing so, a business is required to maintain appropriate staffing and implement appropriate procedures to fulfill its risk governance responsibilities.
The CEOs of each region and business report to the Citigroup CEO. The Head of Operations and Technology and the Head of Productivity, who are considered part of the first line of defense, also report to the Citigroup CEO.
Businesses at Citi organize and chair committees and councils that cover risk considerations with participation from independent control functions, including committees or councils that are designed to consider matters related to capital, assets and liabilities, business practices, business risks and controls, mergers and acquisitions, the Community Reinvestment Act and fair lending and incentives.
Second Line of Defense: Independent Control Functions
Citi’s independent control functions, including Risk, Independent Compliance Risk Management, Human Resources, Legal, Finance and Finance & Risk Infrastructure, set standards by which Citi and its businesses manage and oversee risks, including compliance with applicable laws, regulatory requirements, policies and other relevant standards of conduct. Additionally, among other responsibilities, the independent control functions provide advice and training to Citi’s businesses and establish tools, methodologies, processes and oversight for controls used by the businesses to foster a culture of compliance and control.
Risk
The Risk organization is designed to act as an independent partner of the business to manage market, credit and operational risk in a manner consistent with Citi’s risk appetite. Risk establishes policies and guidelines for risk assessments and risk management and contributes to controls and tools to manage, measure and mitigate risks taken by the Company.
The Chief Risk Officer reports to the Citigroup CEO and the Risk Management Committee of the Citigroup Board of Directors. The Chief Risk Officer has regular and unrestricted access to the Risk Management Committee of the Board and
also to the Citigroup Board of Directors to address risks and issues identified through Risk’s activities.
Independent Compliance Risk Management
The Independent Compliance Risk Management (ICRM) organization is designed to protect Citi by overseeing senior management, the businesses, and other control functions in managing compliance risk, as well as promoting business conduct and activity that is consistent with Citi’s mission and value proposition. Citi’s objective is to embed an enterprise-wide compliance risk management framework and culture that identifies, measures, monitors, mitigates and controls compliance risk across the three lines of defense. For further information on Citi’s compliance risk framework, see “Compliance Risk” below.
The Chief Compliance Officer reports to the Citigroup CEO and has regular and unrestricted access to the committees of the Citigroup Board of Directors, including the Audit Committee and the Ethics and Culture Committee.
Human Resources
The Human Resources organization provides personnel support and governance in connection with, among other things: recognizing and rewarding employees who demonstrate Citi’s values and excel in their roles and responsibilities; setting ethical- and performance-related expectations and developing and promoting employees who meet those expectations; and searching for, assessing and hiring staff who exemplify Citi’s leadership standards, which outline Citi’s expectations of its employees’ behavior.
The Head of Human Resources reports to the Citigroup CEO and interacts regularly with the Personnel and Compensation Committee of the Citigroup Board of Directors.
Legal
The Legal organization is involved in a number of activities designed to promote the appropriate management of Citi’s exposure to legal risk, which includes the risk of loss, whether financial or reputational, due to legal or regulatory actions, proceedings or investigations, or uncertainty in the applicability or interpretation of contracts, laws or regulations. Activities designed to promote appropriate management of legal risk include, among others: promoting and supporting Citigroup’s governance processes; advising business management, other independent control functions, the Citigroup Board of Directors and committees of the Board regarding analysis of laws and regulations, regulatory matters, disclosure matters, and potential risks and exposures on key litigation and transactional matters, among other things; advising other independent control functions in their efforts to ensure compliance with applicable laws and regulations as well as internal standards of conduct; serving on key management committees; reporting and escalating key legal issues to senior management or other independent control functions; participating in internal investigations and overseeing regulatory investigations; and advising businesses on a day-to-day basis on legal, regulatory and contractual matters.
The General Counsel reports to the Citigroup CEO and is responsible to the full Citigroup Board. In addition to having regular and unrestricted access to the full Citigroup Board of Directors, the General Counsel or his/her delegates regularly attend meetings of the Risk Management Committee, Audit Committee, Personnel and Compensation Committee, Ethics and Culture Committee, Operations and Technology Committee, and Nomination, Governance and Public Affairs Committee, as well as other ad hoc committees of the Citigroup Board of Directors.
Finance
The Finance organization is primarily composed of the following disciplines: treasury, controllers, tax and financial planning and analysis. These disciplines partner with the businesses, providing key data and consultation to facilitate sound decisions in support of the businesses’ objectives. Through these activities, Finance serves as an independent control function advising business management, escalating identified risks and establishing policies or processes to manage risk.
Through the treasury discipline, Finance has overall responsibility for managing Citi’s balance sheet and accordingly partners with the businesses to manage Citi’s liquidity and interest rate risk (price risk for non-trading portfolios). Treasury works with the businesses to establish balance sheet targets and limits, as well as sets policies on funding costs charged for business assets based on their liquidity and duration.
Principally through the controllers discipline, Finance is responsible for establishing a strong control environment over Citi’s financial reporting processes consistent with the 2013 Committee of Sponsoring Organizations of the Treadway Commission, or COSO, Internal Control-Integrated Framework.
Finance is led by Citi’s Chief Financial Officer (CFO), who reports directly to the Citigroup CEO. The CFO chairs or co-chairs several management committees that serve as key governance and oversight forums for business activities. In addition, the CFO has regular and unrestricted access to the full Citigroup Board of Directors as well as to the Audit Committee of the Board of Directors.
Finance & Risk Infrastructure
Finance & Risk Infrastructure (FRI) is a Citi global function that was formed in April 2016 from groups within the Finance and Risk global functions. FRI was established to globally implement common data and data standards, common processes and integrated technology platforms as well as integrate infrastructure activities across both Finance and Risk. FRI works to drive straight through data processing and produce more effective and efficient processes and governance aimed at supporting both the Finance and Risk organizations.
The head of the FRI global function reports jointly to Citi’s CFO and Chief Risk Officer.
Third Line of Defense: Internal Audit
Citi’s Internal Audit function independently reviews activities of the first two lines of defense based on a risk-based audit plan and methodology approved by the Audit Committee of the Citigroup Board of Directors. Internal Audit also provides independent assurance to the Citigroup Board of Directors, the Audit Committee of the Board, senior management and regulators regarding the effectiveness of Citi’s governance and controls designed to mitigate Citi’s exposure to risks and to enhance Citi’s culture of compliance and control.
The Chief Auditor reports functionally to the Chairman of the Citigroup Audit Committee and administratively to the CEO of Citigroup. Internal Audit’s responsibilities are carried out independently under the oversight of the Audit Committee. Internal Audit’s employees accordingly report to the Chief Auditor and do not have reporting lines to front-line units or senior management. Internal Audit’s staff members are not permitted to provide internal-audit services for a business line or function in which they had business line or function responsibilities within the previous 12 months.
Three Lines of Defense
Citigroup Board of Directors and Committees of the Board
Citigroup’s Board of Directors oversees Citi’s risk-taking activities and holds management accountable for adhering to the risk governance framework. To do so, directors review reports prepared by the businesses, Risk, Independent Compliance Risk Management, Internal Audit and others, and exercise sound independent judgment to question, probe and challenge recommendations and decisions made by management.
The standing committees of the Citigroup Board of Directors are the Executive Committee, Risk Management Committee, Audit Committee, Personnel and Compensation Committee, Ethics and Culture Committee, Operations and Technology Committee and Nomination, Governance and Public Affairs Committee. In addition to the standing committees, the Board creates ad hoc committees from time to time in response to regulatory, legal or other requirements.
Overview
Credit risk is the risk of loss resulting from the decline in credit quality or the failure of a borrower, counterparty, third party or issuer to honor its financial or contractual obligations. Credit risk arises in many of Citigroup’s business activities, including:
|
|
• |
consumer, commercial and corporate lending; |
|
|
• |
capital markets derivative transactions; |
|
|
• |
structured finance; and |
|
|
• |
securities financing transactions (repurchase and reverse repurchase agreements, securities loaned and borrowed). |
Credit risk also arises from settlement and clearing activities, when Citi transfers an asset in advance of receiving its counter-value or advances funds to settle a transaction on behalf of a client. Concentration risk, within credit risk, is the risk associated with having credit exposure concentrated within a specific client, industry, region or other category.
Credit risk is one of the most significant risks Citi faces as an institution. As a result, Citi has a well-established framework in place for managing credit risk across all businesses. This includes a defined risk appetite, credit limits and credit policies, both at the business level as well as at the company-wide level. Citi’s credit risk management also includes processes and policies with respect to problem recognition, including “watch lists,” portfolio reviews, stress tests, updated risk ratings and classification triggers.
With respect to Citi’s settlement and clearing activities, intra-day client usage of lines is monitored against limits, as well as against usage patterns. To the extent a problem develops, Citi typically moves the client to a secured (collateralized) operating model. Generally, Citi’s intra-day settlement and clearing lines are uncommitted and cancelable at any time.
To manage concentration of risk within credit risk, Citi has in place a correlation framework consisting of industry limits, an idiosyncratic framework consisting of single name concentrations for each business and across Citigroup and a specialized framework consisting of product limits.
Credit exposures are generally reported in notional terms for accrual loans, reflecting the value at which the loans as well as loan and other off-balance sheet commitments are carried on the Consolidated Balance Sheet. Credit exposure arising from capital markets activities is generally expressed as the current mark-to-market, net of margin, reflecting the net value owed to Citi by a given counterparty.
The credit risk associated with these credit exposures is a function of the idiosyncratic creditworthiness of the obligor, as well as the terms and conditions of the specific obligation. Citi assesses the credit risk associated with its credit exposures on a regular basis through its loan loss reserve process (see “Significant Accounting Policies and Significant Estimates—Allowance for Credit Losses” below and Notes 1 and 15 to the Consolidated Financial Statements), as well as through regular stress testing at the company, business, geography and product levels. These stress-testing processes typically estimate
potential incremental credit costs that would occur as a result of either downgrades in the credit quality or defaults of the obligors or counterparties.
There is an independent Chief Risk Officer for each of Citi’s consumer, commercial and corporate lending businesses within ICG and GCB (Business CROs). Each of these Business CROs reports directly to Citi’s Chief Risk Officer. The Business CROs are the focal point for most day-to-day risk decisions, such as setting risk limits and approving transactions within the businesses. In addition there are Regional and Legal Entity Chief Risk Officers. There is an independent Chief Risk Officer for Asia, EMEA and Latin America, including Mexico (Regional CROs). Each of these Regional CROs reports directly to Citi’s Chief Risk Officer. The Regional CROs are accountable for overseeing the management of all risks in their geographic areas and across businesses, and are the primary risk contacts for the Regional Chief Executive Officers and local regulators. Legal Entity Chief Risk Officers are responsible for identifying and managing risks in Citibank as well as other specific legal entities, with Citibank’s Chief Risk Officer reporting directly to Citi’s Chief Risk Officer.
For additional information on Citi’s credit risk management, see Note 14 to the Consolidated Financial Statements.
Consumer Credit
Citi provides traditional retail banking, including commercial banking, and credit card products in 19 countries and jurisdictions through North America GCB, Latin America GCB and Asia GCB. The retail banking products include consumer mortgages, home equity, personal and commercial loans and lines of credit and similar related products with a focus on lending to prime customers. Citi uses its risk appetite framework to define its lending parameters. In addition, Citi uses proprietary scoring models for new customer approvals. As stated in “Global Consumer Banking” above, GCB’s overall strategy is to leverage Citi’s global footprint and be the pre-eminent bank for the affluent and emerging affluent consumers in large urban centers. In credit cards and in certain retail markets, Citi serves customers in a somewhat broader set of segments and geographies. GCB’s commercial banking business focuses on small to mid-sized businesses.
Consumer Credit Portfolio
The following table shows Citi’s quarterly end-of-period consumer loans:(1)
|
|
|
|
|
|
|
|
|
|
|
|
|
|
|
|
|
In billions of dollars |
4Q’16 |
1Q’17 |
2Q’17 |
3Q’17 |
4Q’17 |
Retail banking: |
|
|
|
|
|
Mortgages |
$ |
79.4 |
|
$ |
81.2 |
|
$ |
81.4 |
|
$ |
81.4 |
|
$ |
81.7 |
|
Commercial banking |
32.0 |
|
33.9 |
|
34.8 |
|
35.5 |
|
36.3 |
|
Personal and other |
24.9 |
|
26.3 |
|
27.2 |
|
27.3 |
|
27.9 |
|
Total retail banking |
$ |
136.3 |
|
$ |
141.4 |
|
$ |
143.4 |
|
$ |
144.2 |
|
$ |
145.9 |
|
Cards: |
|
|
|
|
|
Citi-branded cards |
$ |
108.3 |
|
$ |
105.7 |
|
$ |
109.9 |
|
$ |
110.7 |
|
$ |
115.7 |
|
Citi retail services |
47.3 |
|
44.2 |
|
45.2 |
|
45.9 |
|
49.2 |
|
Total cards |
$ |
155.6 |
|
$ |
149.9 |
|
$ |
155.1 |
|
$ |
156.6 |
|
$ |
164.9 |
|
Total GCB
|
$ |
291.9 |
|
$ |
291.3 |
|
$ |
298.5 |
|
$ |
300.8 |
|
$ |
310.8 |
|
GCB regional distribution:
|
|
|
|
|
|
North America |
64 |
% |
62 |
% |
62 |
% |
62 |
% |
63 |
% |
Latin America |
8 |
|
9 |
|
9 |
|
9 |
|
8 |
|
Asia(2)
|
28 |
|
29 |
|
29 |
|
29 |
|
29 |
|
Total GCB
|
100 |
% |
100 |
% |
100 |
% |
100 |
% |
100 |
% |
Corporate/Other |
$ |
33.2 |
|
$ |
29.3 |
|
$ |
26.8 |
|
$ |
24.8 |
|
$ |
22.9 |
|
Total consumer loans |
$ |
325.1 |
|
$ |
320.6 |
|
$ |
325.3 |
|
$ |
325.6 |
|
$ |
333.7 |
|
|
|
(1) |
End-of-period loans include interest and fees on credit cards. |
|
|
(2) |
Asia includes loans and leases in certain EMEA countries for all periods presented.
|
For information on changes to Citi’s average consumer loans, see “Liquidity Risk—Loans” below.
Overall Consumer Credit Trends
The following charts show the quarterly trends in delinquencies and net credit losses across both retail banking, including commercial banking, and cards for total GCB and by region.
North America GCB provides mortgages, home equity loans, personal loans and commercial banking products through Citi’s retail banking network and card products through Citi-branded cards and Citi retail services businesses. The retail bank is concentrated in six major metropolitan cities in the United States (for additional information on the U.S. retail bank, see “North America GCB” above).
As of December 31, 2017, approximately 71% of North America GCB consumer loans consisted of Citi-branded and Citi retail services cards, which generally drives the overall credit performance of North America GCB, including the credit performance year-over-year as of the fourth quarter of 2017 (for additional information on North America GCB’s cards portfolios, including delinquency and net credit loss rates, see “Credit Card Trends” below).
Quarter-over-quarter, 90+ days past due delinquency rates increased, primarily due to seasonality in the cards portfolios and the hurricane-related impact to the mortgage portfolio. The net credit loss rate decreased quarter-over-quarter, primarily reflecting the absence of an episodic charge-off in the commercial portfolio that occurred in the third quarter of 2017. The net credit loss rate increased year-over-year primarily due to seasoning in both cards portfolios.
Latin America GCB operates in Mexico through Citibanamex, one of Mexico’s largest banks, and provides credit cards, consumer mortgages, personal loans and commercial banking products. Latin America GCB serves a more mass market segment in Mexico and focuses on developing multi-product relationships with customers.
As set forth in the chart above, 90+ days past due
delinquency rates improved year-over-year and quarter-over-quarter, largely driven by the commercial portfolio. The improvement year-over-year was partially offset by a higher delinquency rate in cards due to the seasoning of the portfolio. The net credit loss rate increased in Latin America GCB year-over-year and quarter-over-quarter as of the fourth quarter of 2017, primarily due to an episodic charge-off in the commercial portfolio as well as seasoning in the cards portfolio.
|
|
(1) |
Asia includes GCB activities in certain EMEA countries for all periods presented.
|
Asia GCB operates in 17 countries in Asia and EMEA and provides credit cards, consumer mortgages, personal loans and commercial banking products. As shown in the chart above, 90+ days past due delinquency and net credit loss rates were largely stable in Asia GCB year-over-year and quarter-over-quarter as of the fourth quarter of 2017. This stability reflects the strong credit profiles in Asia GCB’s target customer segments. In addition, regulatory changes in many markets in Asia over the past few years have resulted in stable or improved portfolio credit quality, despite weaker macroeconomic conditions in several countries.
For additional information on cost of credit, loan delinquency and other information for Citi’s consumer loan portfolios, see each respective business’s results of operations above and Note 14 to the Consolidated Financial Statements.
Credit Card Trends
The following charts show the quarterly trends in delinquencies and net credit losses for total GCB cards, Citi’s North America Citi-branded cards and Citi retail services portfolios as well as for Citi’s Latin America and Asia Citi-branded cards portfolios.
|
|
North America Citi-Branded Cards |

North America GCB’s Citi-branded cards portfolio issues proprietary and co-branded cards. As shown in the chart above, the 90+ days past due delinquency rate in Citi-branded cards was stable year-over-year and seasonally higher quarter-over-quarter. The net credit loss rate increased year-over-year primarily due to seasoning, and decreased quarter-over-quarter primarily due to seasonality as well as higher asset sales.
|
|
North America Citi Retail Services |
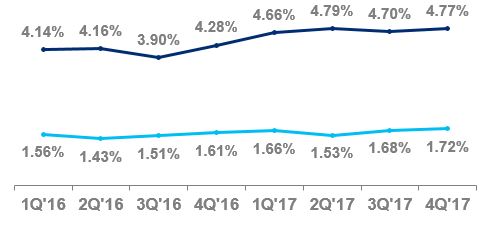
Citi retail services partners directly with more than 20 retailers and dealers to offer private-label and co-branded consumer and commercial cards. Citi retail services’ target market is focused on select industry segments such as home improvement, specialty retail, consumer electronics and fuel. Citi retail services continually evaluates opportunities to add partners within target industries that have strong loyalty, lending or payment programs and growth potential.
Citi retail services’ delinquency and net credit loss rates increased year-over-year, primarily due to seasoning as well as softness in the collections rates experienced once an account reaches mid-stage delinquency. The quarter-over-quarter increase in both loss and delinquency rates is also due to the seasonal movements observed in Citi retail services.
|
|
Latin America Citi-Branded Cards |
Latin America GCB issues proprietary and co-branded cards. As set forth in the chart above, the net credit loss and delinquency rates increased year-over-year due to seasoning. The decrease quarter-over-quarter of the net credit loss and delinquency rates was primarily driven by higher payment rates reflecting the payment of year-end bonuses.
|
|
Asia Citi-Branded Cards(1)
|
|
|
(1) |
Asia includes loans and leases in certain EMEA countries for all periods presented.
|
Asia GCB issues proprietary and co-branded cards. As set forth in the chart above, 90+ days past due delinquency and net credit loss rates have remained broadly stable, driven by the mature and well-diversified nature of the cards portfolio.
For additional information on cost of credit, delinquency and other information for Citi’s cards portfolios, see each respective business’s results of operations above and Note 14 to the Consolidated Financial Statements.
North America Cards FICO Distribution
The following tables show the current FICO score distributions for Citi’s North America Citi-branded cards and Citi retail services portfolios. FICO scores are updated monthly for substantially all of the portfolio and on a quarterly basis for the remaining portfolio.
Citi-Branded
|
|
|
|
|
|
|
December 31, |
FICO distribution |
2017 |
2016 |
> 760 |
42 |
% |
42 |
% |
680 - 760 |
41 |
|
43 |
|
< 680 |
17 |
|
15 |
|
Total |
100 |
% |
100 |
% |
Citi Retail Services
|
|
|
|
|
|
|
December 31, |
FICO distribution |
2017 |
2016 |
> 760 |
24 |
% |
24 |
% |
680 - 760 |
43 |
|
43 |
|
< 680 |
33 |
|
33 |
|
Total |
100 |
% |
100 |
% |
Both the Citi-branded cards’ and Citi retail services’ cards FICO distributions remained stable as of year-end 2017.
For additional information on FICO scores, see Note 14 to the Consolidated Financial Statements.
North America Consumer Mortgage Portfolio
Citi’s North America consumer mortgage portfolio consists of both residential first mortgages and home equity loans. The following table shows the outstanding quarterly end-of-period loans for Citi’s North America residential first mortgage and home equity loan portfolios:
|
|
|
|
|
|
|
|
|
|
|
|
|
|
|
|
|
In billions of dollars |
4Q’16 |
1Q’17 |
2Q’17 |
3Q’17 |
4Q’17 |
GCB: |
|
|
|
|
|
Residential firsts |
$ |
40.2 |
|
$ |
40.3 |
|
$ |
40.2 |
|
$ |
40.1 |
|
$ |
40.1 |
|
Home equity |
4.0 |
|
4.0 |
|
4.1 |
|
4.1 |
|
4.2 |
|
Total GCB
|
$ |
44.2 |
|
$ |
44.3 |
|
$ |
44.3 |
|
$ |
44.2 |
|
$ |
44.3 |
|
Corporate/Other: |
|
|
|
|
|
Residential firsts |
$ |
13.4 |
|
$ |
12.3 |
|
$ |
11.0 |
|
$ |
10.1 |
|
$ |
9.3 |
|
Home equity |
15.0 |
|
13.4 |
|
12.4 |
|
11.5 |
|
10.6 |
|
Total Corporate/Other
|
$ |
28.4 |
|
$ |
25.7 |
|
$ |
23.4 |
|
$ |
21.6 |
|
$ |
19.9 |
|
Total Citigroup— North America
|
$ |
72.6 |
|
$ |
70.0 |
|
$ |
67.7 |
|
$ |
65.8 |
|
$ |
64.2 |
|
For additional information on delinquency and net credit loss trends in Citi’s consumer mortgage portfolio, see “Additional Consumer Credit Details” below.
Home Equity Loans—Revolving HELOCs
As set forth in the table above, Citi had $14.8 billion of home equity loans as of December 31, 2017, of which $3.4 billion are fixed-rate home equity loans and $11.4 billion are extended under home equity lines of credit (Revolving HELOCs). Fixed-rate home equity loans are fully amortizing. Revolving HELOCs allow for amounts to be drawn for a period of time with the payment of interest only and then, at the end of the draw period, the outstanding amount is converted to an amortizing loan, or “reset” (the interest-only payment feature during the revolving period is standard for this product across the industry). Upon reset, these borrowers will be required to pay both interest, usually at a variable rate, and principal that amortizes typically over 20 years, rather than the standard 30-year amortization.
Of the Revolving HELOCs at December 31, 2017, $6.8 billion had reset (compared to $6.2 billion at December 31, 2016) and $4.6 billion were still within their revolving period and had not reset (compared to $7.8 billion at December 31, 2016). The following chart indicates the FICO and combined loan-to-value (CLTV) characteristics of Citi’s Revolving HELOCs portfolio and the year in which they reset:
|
|
|
North America Home Equity Lines of Credit Amortization – Citigroup
Total ENR by Reset Year
In billions of dollars as of December 31, 2017
|
Note: Totals may not sum due to rounding.
Approximately 59% of Citi’s total Revolving HELOCs portfolio had reset as of December 31, 2017 (compared to 44% as of December 31, 2016). Of the remaining Revolving HELOCs portfolio, approximately 29% will reset during 2018.
Citi’s customers with Revolving HELOCs that reset could experience “payment shock” due to the higher required payments on the loans. Citi currently estimates that the monthly loan payment for its Revolving HELOCs that reset during 2018 could increase on average by approximately $308, or 118%. Increases in interest rates could further increase these payments given the variable nature of the interest rates on these loans post-reset. Of the Revolving HELOCs that will reset during 2018, approximately $10 million, or 1%, of the loans have a CLTV greater than 100% as of December 31, 2017. Borrowers’ high loan-to-value positions, as well as the cost and availability of refinancing options, could limit borrowers’ ability to refinance their Revolving HELOCs as these loans reset.
Approximately 5.9% of the Revolving HELOCs that have reset as of December 31, 2017 were 30+ days past due, compared to 3.9% of the total outstanding home equity loan portfolio (amortizing and non-amortizing). This compared to 6.7% and 3.9%, respectively, as of December 31, 2016. As newly amortizing loans continue to season, the delinquency rate of Citi’s total home equity loan portfolio could increase. In addition, resets to date have generally occurred during a period of historically low interest rates, which Citi believes has likely reduced the overall “payment shock” to the borrower.
Citi monitors this reset risk closely and will continue to consider any potential impact in determining its allowance for loan loss reserves. In addition, management continues to review and take additional actions to offset potential reset risk, such as a borrower outreach program to provide reset risk education and proactively working with high-risk borrowers through a specialized single point of contact unit.
Additional Consumer Credit Details
Consumer Loan Delinquency Amounts and Ratios
|
|
|
|
|
|
|
|
|
|
|
|
|
|
|
|
|
|
|
|
|
|
|
|
EOP
loans(1)
|
90+ days past due(2)
|
30–89 days past due(2)
|
|
December 31, |
December 31, |
December 31, |
In millions of dollars, except EOP loan amounts in billions |
2017 |
2017 |
2016 |
2015 |
2017 |
2016 |
2015 |
Global Consumer Banking(3)(4)
|
|
|
|
|
|
|
|
Total |
$ |
310.8 |
|
$ |
2,478 |
|
$ |
2,293 |
|
$ |
2,119 |
|
$ |
2,762 |
|
$ |
2,540 |
|
$ |
2,418 |
|
Ratio |
|
0.80 |
% |
0.79 |
% |
0.77 |
% |
0.89 |
% |
0.87 |
% |
0.88 |
% |
Retail banking |
|
|
|
|
|
|
|
Total |
$ |
145.9 |
|
$ |
515 |
|
$ |
474 |
|
$ |
523 |
|
$ |
822 |
|
$ |
726 |
|
$ |
739 |
|
Ratio |
|
0.35 |
% |
0.35 |
% |
0.38 |
% |
0.57 |
% |
0.54 |
% |
0.53 |
% |
North America |
56.0 |
|
199 |
|
181 |
|
165 |
|
306 |
|
214 |
|
221 |
|
Ratio |
|
0.36 |
% |
0.33 |
% |
0.32 |
% |
0.55 |
% |
0.39 |
% |
0.43 |
% |
Latin America |
19.9 |
|
130 |
|
136 |
|
185 |
|
195 |
|
185 |
|
184 |
|
Ratio |
|
0.65 |
% |
0.76 |
% |
0.94 |
% |
0.98 |
% |
1.03 |
% |
0.93 |
% |
Asia(5)
|
70.0 |
|
186 |
|
157 |
|
173 |
|
321 |
|
327 |
|
334 |
|
Ratio |
|
0.27 |
% |
0.25 |
% |
0.25 |
% |
0.46 |
% |
0.52 |
% |
0.49 |
% |
Cards |
|
|
|
|
|
|
|
Total |
$ |
164.9 |
|
$ |
1,963 |
|
$ |
1,819 |
|
$ |
1,596 |
|
$ |
1,940 |
|
$ |
1,814 |
|
$ |
1,679 |
|
Ratio |
|
1.19 |
% |
1.17 |
% |
1.17 |
% |
1.18 |
% |
1.17 |
% |
1.23 |
% |
North America—Citi-branded |
90.5 |
|
768 |
|
748 |
|
538 |
|
698 |
|
688 |
|
523 |
|
Ratio |
|
0.85 |
% |
0.87 |
% |
0.80 |
% |
0.77 |
% |
0.80 |
% |
0.78 |
% |
North America—Citi retail services |
49.2 |
|
845 |
|
761 |
|
705 |
|
830 |
|
777 |
|
773 |
|
Ratio |
|
1.72 |
% |
1.61 |
% |
1.53 |
% |
1.69 |
% |
1.64 |
% |
1.68 |
% |
Latin America |
5.4 |
|
151 |
|
130 |
|
173 |
|
153 |
|
125 |
|
157 |
|
Ratio |
|
2.80 |
% |
2.71 |
% |
3.20 |
% |
2.83 |
% |
2.60 |
% |
2.91 |
% |
Asia(5)
|
19.8 |
|
199 |
|
180 |
|
180 |
|
259 |
|
224 |
|
226 |
|
Ratio |
|
1.01 |
% |
1.03 |
% |
1.02 |
% |
1.31 |
% |
1.28 |
% |
1.28 |
% |
Corporate/Other—Consumer(6)(7)
|
|
|
|
|
|
|
|
Total |
$ |
22.9 |
|
$ |
557 |
|
$ |
834 |
|
$ |
927 |
|
$ |
542 |
|
$ |
735 |
|
$ |
1,036 |
|
Ratio |
|
2.57 |
% |
2.62 |
% |
1.99 |
% |
2.50 |
% |
2.31 |
% |
2.23 |
% |
International |
1.6 |
|
43 |
|
94 |
|
157 |
|
40 |
|
49 |
|
179 |
|
Ratio |
|
2.69 |
% |
3.92 |
% |
1.91 |
% |
2.50 |
% |
2.04 |
% |
2.18 |
% |
North America |
21.3 |
|
514 |
|
740 |
|
770 |
|
502 |
|
686 |
|
857 |
|
Ratio |
|
2.56 |
% |
2.52 |
% |
2.01 |
% |
2.50 |
% |
2.33 |
% |
2.24 |
% |
Total Citigroup |
$ |
333.7 |
|
$ |
3,035 |
|
$ |
3,127 |
|
$ |
3,046 |
|
$ |
3,304 |
|
$ |
3,275 |
|
$ |
3,454 |
|
Ratio |
|
0.91 |
% |
0.97 |
% |
0.94 |
% |
1.00 |
% |
1.01 |
% |
1.07 |
% |
|
|
(1) |
End-of-period (EOP) loans include interest and fees on credit cards. |
|
|
(2) |
The ratios of 90+ days past due and 30–89 days past due are calculated based on EOP loans, net of unearned income. |
|
|
(3) |
The 90+ days past due balances for North America—Citi-branded and North America—Citi retail services are generally still accruing interest. Citigroup’s policy is generally to accrue interest on credit card loans until 180 days past due, unless notification of bankruptcy filing has been received earlier.
|
|
|
(4) |
The 90+ days and 30–89 days past due and related ratios for GCB North America retail banking exclude U.S. mortgage loans that are guaranteed by U.S. government-sponsored entities since the potential loss predominantly resides within the U.S. government-sponsored entities. The amounts excluded for loans 90+ days past due and (EOP loans) were $298 million ($0.7 billion), $327 million ($0.7 billion) and $491 million ($1.1 billion) at December 31, 2017, 2016 and 2015, respectively. The amounts excluded for loans 30–89 days past due (EOP loans have the same adjustment as above) were $88 million, $70 million and $87 million at December 31, 2017, 2016 and 2015, respectively.
|
|
|
(5) |
Asia includes delinquencies and loans in certain EMEA countries for all periods presented.
|
|
|
(6) |
The 90+ days and 30–89 days past due and related ratios for Corporate/Other—Consumer North America exclude U.S. mortgage loans that are guaranteed by U.S. government-sponsored entities since the potential loss predominantly resides within the U.S. government-sponsored entities. The amounts excluded for loans 90+ days past due (and EOP loans) were $0.6 billion ($1.1 billion), $0.9 billion ($1.4 billion) and $1.5 billion ($2.2 billion) at December 31, 2017, 2016 and 2015, respectively. The amounts excluded for loans 30–89 days past due (EOP loans have the same adjustment as above) for each period were $0.1 billion, $0.2 billion and $0.2 billion at December 31, 2017, 2016 and 2015, respectively.
|
|
|
(7) |
The December 31, 2017, 2016 and 2015, loans 90+ days past due and 30–89 days past due and related ratios for North America exclude $4 million, $7 million and $11 million, respectively, of loans that are carried at fair value.
|
Consumer Loan Net Credit Losses and Ratios
|
|
|
|
|
|
|
|
|
|
|
|
|
|
|
Average
loans(1)
|
Net credit losses(2)(3)(4)
|
In millions of dollars, except average loan amounts in billions |
2017 |
2017 |
2016 |
2015 |
Global Consumer Banking |
|
|
|
|
Total |
$ |
296.8 |
|
$ |
6,562 |
|
$ |
5,610 |
|
$ |
5,752 |
|
Ratio |
|
2.21 |
% |
2.01 |
% |
2.12 |
% |
Retail banking |
|
|
|
|
Total |
$ |
142.7 |
|
$ |
1,023 |
|
$ |
1,007 |
|
$ |
1,058 |
|
Ratio |
|
0.72 |
% |
0.72 |
% |
0.75 |
% |
North America |
55.7 |
|
$ |
194 |
|
$ |
205 |
|
$ |
150 |
|
Ratio |
|
0.35 |
% |
0.38 |
% |
0.30 |
% |
Latin America |
20.0 |
|
$ |
584 |
|
$ |
541 |
|
$ |
589 |
|
Ratio |
|
2.92 |
% |
2.85 |
% |
2.89 |
% |
Asia(5)
|
67.0 |
|
$ |
245 |
|
$ |
261 |
|
$ |
319 |
|
Ratio |
|
0.37 |
% |
0.39 |
% |
0.45 |
% |
Cards |
|
|
|
|
Total |
$ |
154.1 |
|
$ |
5,539 |
|
$ |
4,603 |
|
$ |
4,694 |
|
Ratio |
|
3.60 |
% |
3.30 |
% |
3.59 |
% |
North America—Citi-branded |
84.6 |
|
$ |
2,447 |
|
$ |
1,909 |
|
$ |
1,892 |
|
Ratio |
|
2.89 |
% |
2.61 |
% |
2.96 |
% |
North America—Retail services |
45.6 |
|
$ |
2,155 |
|
$ |
1,805 |
|
$ |
1,709 |
|
Ratio |
|
4.73 |
% |
4.12 |
% |
3.94 |
% |
Latin America |
5.3 |
|
$ |
533 |
|
$ |
499 |
|
$ |
691 |
|
Ratio |
|
10.06 |
% |
9.78 |
% |
11.71 |
% |
Asia(5)
|
18.6 |
|
$ |
404 |
|
$ |
390 |
|
$ |
402 |
|
Ratio |
|
2.17 |
% |
2.24 |
% |
2.28 |
% |
Corporate/Other—Consumer(3)(4)
|
|
|
|
|
Total |
$ |
27.2 |
|
$ |
156 |
|
$ |
438 |
|
$ |
1,306 |
|
Ratio |
|
0.57 |
% |
1.06 |
% |
1.96 |
% |
International |
1.9 |
|
$ |
82 |
|
$ |
269 |
|
$ |
443 |
|
Ratio |
|
4.32 |
% |
5.17 |
% |
4.43 |
% |
North America |
25.3 |
|
$ |
74 |
|
$ |
169 |
|
$ |
863 |
|
Ratio |
|
0.29 |
% |
0.47 |
% |
1.52 |
% |
Other(6)
|
— |
|
$ |
(21 |
) |
$ |
— |
|
$ |
— |
|
Total Citigroup |
$ |
324.0 |
|
$ |
6,697 |
|
$ |
6,048 |
|
$ |
7,058 |
|
Ratio |
|
2.07 |
% |
1.88 |
% |
2.08 |
% |
|
|
(1) |
Average loans include interest and fees on credit cards. |
|
|
(2) |
The ratios of net credit losses are calculated based on average loans, net of unearned income. |
|
|
(3) |
As a result of Citigroup's entry into agreements in October 2016 to sell its Argentina and Brazil consumer banking businesses, these businesses were classified as HFS at the end of the fourth quarter 2016. Loans HFS are excluded from this table as they are recorded in Other assets. In addition, as a result of HFS accounting treatment, approximately $128 million and $42 million of net credit losses (NCLs) were recorded as a reduction in revenue (Other revenue) during 2017 and 2016, respectively. Accordingly, these NCLs are not included in this table. The sales of the Argentina and Brazil consumer banking businesses were completed in the first and fourth quarters of 2017, respectively.
|
|
|
(4) |
As a result of the entry into an agreement to sell OneMain Financial (OneMain), OneMain was classified as HFS beginning March 31, 2015. Loans HFS are excluded from this table as they are recorded in Other assets. In addition, as a result of HFS accounting treatment, approximately $350 million of NCLs were recorded as a reduction in revenue (Other revenue) during 2015. Accordingly, these NCLs are not included in this table. The OneMain sale was completed on November 15, 2015.
|
|
|
(5) |
Asia includes average loans and NCLs in certain EMEA countries for all periods presented.
|
|
|
(6) |
2017 NCLs represent a recovery related to legacy assets. |
Loan Maturities and Fixed/Variable Pricing
U.S. Consumer Mortgages
|
|
|
|
|
|
|
|
|
|
|
|
|
|
In millions of dollars at year-end 2017 |
Due
within
1 year
|
Greater
than 1 year
but within
5 years
|
Greater
than 5
years
|
Total |
U.S. consumer mortgage loan portfolio |
|
|
|
|
Residential first mortgages |
$ |
96 |
|
$ |
543 |
|
$ |
50,248 |
|
$ |
50,887 |
|
Home equity loans |
15 |
|
856 |
|
13,709 |
|
14,580 |
|
Total |
$ |
111 |
|
$ |
1,399 |
|
$ |
63,957 |
|
$ |
65,467 |
|
Fixed/variable pricing of U.S. consumer mortgage loans with maturities due after one year |
|
|
|
|
Loans at fixed interest rates |
|
$ |
1,187 |
|
$ |
39,084 |
|
|
Loans at floating or adjustable interest rates |
|
212 |
|
24,873 |
|
|
Total |
|
$ |
1,399 |
|
$ |
63,957 |
|
|
Corporate Credit
Consistent with its overall strategy, Citi’s corporate clients are typically large, multinational corporations that value Citi’s global network. Citi aims to establish relationships with these clients that encompass multiple products, consistent with client needs, including cash management and trade services, foreign exchange, lending, capital markets and M&A advisory.
Corporate Credit Portfolio
The following table sets forth Citi’s corporate credit portfolio within ICG (excluding private bank), before consideration of collateral or hedges, by remaining tenor for the periods indicated:
|
|
|
|
|
|
|
|
|
|
|
|
|
|
|
|
|
|
|
|
|
|
|
|
|
|
|
|
|
|
|
|
|
|
|
|
|
|
|
At December 31, 2017 |
At September 30, 2017 |
At December 31, 2016 |
In billions of dollars |
Due
within
1 year
|
Greater
than 1 year
but within
5 years
|
Greater
than
5 years
|
Total
exposure
|
Due
within
1 year |
Greater
than 1 year
but within
5 years |
Greater
than
5 years |
Total
exposure |
Due
within
1 year
|
Greater
than 1 year
but within
5 years
|
Greater
than
5 years
|
Total
exposure
|
|
Direct outstandings
(on-balance sheet)(1)
|
$ |
127 |
|
$ |
96 |
|
$ |
22 |
|
$ |
245 |
|
$ |
124 |
|
$ |
96 |
|
$ |
23 |
|
$ |
243 |
|
$ |
109 |
|
$ |
94 |
|
$ |
22 |
|
$ |
225 |
|
|
Unfunded lending commitments
(off-balance sheet)(2)
|
111 |
|
222 |
|
20 |
|
353 |
|
104 |
|
219 |
|
20 |
|
343 |
|
103 |
|
218 |
|
23 |
|
344 |
|
Total exposure |
$ |
238 |
|
$ |
318 |
|
$ |
42 |
|
$ |
598 |
|
$ |
228 |
|
$ |
315 |
|
$ |
43 |
|
$ |
586 |
|
$ |
212 |
|
$ |
312 |
|
$ |
45 |
|
$ |
569 |
|
|
|
(1) |
Includes drawn loans, overdrafts, bankers’ acceptances and leases. |
|
|
(2) |
Includes unused commitments to lend, letters of credit and financial guarantees. |
Portfolio Mix—Geography, Counterparty and Industry
Citi’s corporate credit portfolio is diverse across geography and counterparty. The following table shows the percentage by region based on Citi’s internal management geography:
|
|
|
|
|
|
|
|
|
December 31,
2017 |
September 30,
2017 |
December 31,
2016 |
North America |
54 |
% |
55 |
% |
55 |
% |
EMEA |
27 |
|
26 |
|
26 |
|
Asia |
12 |
|
12 |
|
12 |
|
Latin America |
7 |
|
7 |
|
7 |
|
Total |
100 |
% |
100 |
% |
100 |
% |
The maintenance of accurate and consistent risk ratings across the corporate credit portfolio facilitates the comparison of credit exposure across all lines of business, geographic regions and products. Counterparty risk ratings reflect an estimated probability of default for a counterparty and are derived primarily through the use of validated statistical models, scorecard models and external agency ratings (under defined circumstances), in combination with consideration of factors specific to the obligor or market, such as management experience, competitive position, regulatory environment and commodity prices. Facility risk ratings are assigned that reflect the probability of default of the obligor and factors that affect the loss-given-default of the facility, such as support or collateral. Internal obligor ratings that generally correspond to BBB and above are considered investment grade, while those below are considered non-investment grade.
Citigroup also has incorporated climate risk assessment and reporting criteria for certain obligors, as necessary. Factors evaluated include consideration of climate risk to an
obligor’s business and physical assets and, when relevant, consideration of cost-effective options to reduce greenhouse gas emissions.
The following table presents the corporate credit portfolio by facility risk rating as a percentage of the total corporate credit portfolio:
|
|
|
|
|
|
|
|
|
Total exposure |
|
December 31,
2017 |
September 30,
2017 |
December 31,
2016 |
AAA/AA/A |
49 |
% |
49 |
% |
48 |
% |
BBB |
34 |
|
34 |
|
34 |
|
BB/B |
16 |
|
16 |
|
16 |
|
CCC or below |
1 |
|
1 |
|
2 |
|
Total |
100 |
% |
100 |
% |
100 |
% |
Note: Total exposure includes direct outstandings and unfunded lending commitments.
Citi’s corporate credit portfolio is also diversified by industry. The following table shows the allocation of Citi’s total corporate credit portfolio by industry:
|
|
|
|
|
|
|
|
|
Total exposure |
|
December 31,
2017 |
September 30,
2017 |
December 31,
2016 |
|
Transportation and
industrial
|
22 |
% |
22 |
% |
22 |
% |
Consumer retail and health |
16 |
|
16 |
|
16 |
|
Technology, media and telecom |
12 |
|
11 |
|
12 |
|
|
Power, chemicals,
metals and mining
|
10 |
|
10 |
|
11 |
|
Energy and commodities |
8 |
|
8 |
|
9 |
|
|
Banks/broker-dealers/finance companies
|
8 |
|
8 |
|
6 |
|
Real estate |
8 |
|
7 |
|
7 |
|
|
Insurance and special purpose entities
|
5 |
|
5 |
|
5 |
|
Public sector |
5 |
|
5 |
|
5 |
|
Hedge funds |
4 |
|
4 |
|
5 |
|
Other industries |
2 |
|
4 |
|
2 |
|
Total |
100 |
% |
100 |
% |
100 |
% |
Note: Total exposure includes direct outstandings and unfunded lending commitments.
Credit Risk Mitigation
As part of its overall risk management activities, Citigroup uses credit derivatives and other risk mitigants to hedge portions of the credit risk in its corporate credit portfolio, in addition to outright asset sales. The results of the mark-to-market and any realized gains or losses on credit derivatives are reflected primarily in Other revenue on the Consolidated Statement of Income.
As of December 31, 2017, September 30, 2017 and December 31, 2016, $16.3 billion, $22.2 billion and $29.5 billion, respectively, of the corporate credit portfolio was economically hedged. Citigroup’s expected loss model used in the calculation of its loan loss reserve does not include the favorable impact of credit derivatives and other mitigants that are marked-to-market. In addition, the reported amounts of direct outstandings and unfunded lending commitments in the tables above do not reflect the impact of these hedging transactions. The credit protection was economically hedging underlying corporate credit portfolio exposures with the following risk rating distribution:
Rating of Hedged Exposure
|
|
|
|
|
|
|
|
|
December 31,
2017 |
September 30,
2017 |
December 31,
2016 |
AAA/AA/A |
23 |
% |
16 |
% |
16 |
% |
BBB |
43 |
|
48 |
|
49 |
|
BB/B |
31 |
|
33 |
|
31 |
|
CCC or below |
3 |
|
3 |
|
4 |
|
Total |
100 |
% |
100 |
% |
100 |
% |
The credit protection was economically hedging underlying corporate credit portfolio exposures with the following industry distribution:
Industry of Hedged Exposure
|
|
|
|
|
|
|
|
|
December 31,
2017 |
September 30,
2017 |
December 31,
2016 |
Transportation and industrial |
27 |
% |
27 |
% |
29 |
% |
Energy and commodities |
15 |
|
17 |
|
20 |
|
Power, chemicals, metals and mining |
14 |
|
12 |
|
12 |
|
Technology, media and telecom |
12 |
|
14 |
|
13 |
|
Public sector |
12 |
|
8 |
|
5 |
|
Consumer retail and health |
10 |
|
12 |
|
10 |
|
Banks/broker-dealers |
6 |
|
5 |
|
4 |
|
Insurance and special purpose entities |
2 |
|
2 |
|
3 |
|
Other industries |
2 |
|
3 |
|
4 |
|
Total |
100 |
% |
100 |
% |
100 |
% |
Loan Maturities and Fixed/Variable Pricing of Corporate
Loans
|
|
|
|
|
|
|
|
|
|
|
|
|
|
In millions of dollars at December 31, 2017 |
Due
within
1 year
|
Over 1
year
but
within
5 years
|
Over 5
years
|
Total |
Corporate loans |
|
|
|
|
In U.S. offices |
|
|
|
|
Commercial and industrial loans |
$ |
20,679 |
|
$ |
18,474 |
|
$ |
12,166 |
|
$ |
51,319 |
|
Financial institutions |
15,767 |
|
14,085 |
|
9,276 |
|
39,128 |
|
Mortgage and real estate |
18,005 |
|
16,085 |
|
10,593 |
|
44,683 |
|
Installment, revolving credit and other |
13,369 |
|
11,945 |
|
7,867 |
|
33,181 |
|
Lease financing |
593 |
|
529 |
|
348 |
|
1,470 |
|
In offices outside the U.S. |
106,000 |
|
49,295 |
|
9,065 |
|
164,360 |
|
Total corporate loans |
$ |
174,413 |
|
$ |
110,413 |
|
$ |
49,315 |
|
$ |
334,141 |
|
|
Fixed/variable
pricing of corporate
loans with
maturities due after
one year(1)
|
|
|
|
|
|
Loans at fixed
interest rates
|
|
$ |
21,048 |
|
$ |
15,276 |
|
|
|
Loans at floating or
adjustable interest
rates
|
|
89,365 |
|
34,039 |
|
|
Total |
|
$ |
110,413 |
|
$ |
49,315 |
|
|
|
|
(1) |
Based on contractual terms. Repricing characteristics may effectively |
be modified from time to time using derivative contracts. See Note 22
to the Consolidated Financial Statements.
Additional Consumer and Corporate Credit Details
Loans Outstanding
|
|
|
|
|
|
|
|
|
|
|
|
|
|
|
|
|
|
December 31, |
In millions of dollars |
2017 |
2016 |
2015 |
2014 |
2013 |
Consumer loans |
|
|
|
|
|
In U.S. offices |
|
|
|
|
|
Mortgage and real estate(1)
|
$ |
65,467 |
|
$ |
72,957 |
|
$ |
80,281 |
|
$ |
96,533 |
|
$ |
108,453 |
|
Installment, revolving credit and other |
3,398 |
|
3,395 |
|
3,480 |
|
14,450 |
|
13,398 |
|
Cards |
139,006 |
|
132,654 |
|
112,800 |
|
112,982 |
|
115,651 |
|
Commercial and industrial |
7,840 |
|
7,159 |
|
6,407 |
|
5,895 |
|
6,592 |
|
Total |
$ |
215,711 |
|
$ |
216,165 |
|
$ |
202,968 |
|
$ |
229,860 |
|
$ |
244,094 |
|
In offices outside the U.S. |
|
|
|
|
|
Mortgage and real estate(1)
|
$ |
44,081 |
|
$ |
42,803 |
|
$ |
47,062 |
|
$ |
54,462 |
|
$ |
55,511 |
|
Installment, revolving credit and other |
26,556 |
|
24,887 |
|
29,480 |
|
31,128 |
|
33,182 |
|
Cards |
26,257 |
|
23,783 |
|
27,342 |
|
32,032 |
|
36,740 |
|
Commercial and industrial |
20,238 |
|
16,568 |
|
17,410 |
|
18,294 |
|
20,623 |
|
Lease financing |
76 |
|
81 |
|
362 |
|
546 |
|
710 |
|
|
Total
|
$ |
117,208 |
|
$ |
108,122 |
|
$ |
121,656 |
|
$ |
136,462 |
|
$ |
146,766 |
|
Total consumer loans |
$ |
332,919 |
|
$ |
324,287 |
|
$ |
324,624 |
|
$ |
366,322 |
|
$ |
390,860 |
|
Unearned income(2)
|
737 |
|
776 |
|
830 |
|
(679 |
) |
(567 |
) |
Consumer loans, net of unearned income |
$ |
333,656 |
|
$ |
325,063 |
|
$ |
325,454 |
|
$ |
365,643 |
|
$ |
390,293 |
|
Corporate loans |
|
|
|
|
|
In U.S. offices |
|
|
|
|
|
Commercial and industrial |
$ |
51,319 |
|
$ |
49,586 |
|
$ |
46,011 |
|
$ |
39,542 |
|
$ |
36,993 |
|
Financial institutions |
39,128 |
|
35,517 |
|
36,425 |
|
36,324 |
|
25,130 |
|
Mortgage and real estate(1)
|
44,683 |
|
38,691 |
|
32,623 |
|
27,959 |
|
25,075 |
|
Installment, revolving credit and other |
33,181 |
|
34,501 |
|
33,423 |
|
29,246 |
|
34,467 |
|
Lease financing |
1,470 |
|
1,518 |
|
1,780 |
|
1,758 |
|
1,647 |
|
|
Total
|
$ |
169,781 |
|
$ |
159,813 |
|
$ |
150,262 |
|
$ |
134,829 |
|
$ |
123,312 |
|
In offices outside the U.S. |
|
|
|
|
|
Commercial and industrial |
$ |
93,750 |
|
$ |
81,882 |
|
$ |
82,689 |
|
$ |
83,506 |
|
$ |
86,147 |
|
Financial institutions |
35,273 |
|
26,886 |
|
28,704 |
|
33,269 |
|
38,372 |
|
Mortgage and real estate(1)
|
7,309 |
|
5,363 |
|
5,106 |
|
6,031 |
|
6,274 |
|
Installment, revolving credit and other |
22,638 |
|
19,965 |
|
20,853 |
|
19,259 |
|
18,714 |
|
Lease financing |
190 |
|
251 |
|
303 |
|
419 |
|
586 |
|
Governments and official institutions |
5,200 |
|
5,850 |
|
4,911 |
|
2,236 |
|
2,341 |
|
|
Total
|
$ |
164,360 |
|
$ |
140,197 |
|
$ |
142,566 |
|
$ |
144,720 |
|
$ |
152,434 |
|
Total corporate loans |
$ |
334,141 |
|
$ |
300,010 |
|
$ |
292,828 |
|
$ |
279,549 |
|
$ |
275,746 |
|
Unearned income(3)
|
(763 |
) |
(704 |
) |
(665 |
) |
(557 |
) |
(567 |
) |
Corporate loans, net of unearned income |
$ |
333,378 |
|
$ |
299,306 |
|
$ |
292,163 |
|
$ |
278,992 |
|
$ |
275,179 |
|
Total loans—net of unearned income |
$ |
667,034 |
|
$ |
624,369 |
|
$ |
617,617 |
|
$ |
644,635 |
|
$ |
665,472 |
|
Allowance for loan losses—on drawn exposures |
(12,355 |
) |
(12,060 |
) |
(12,626 |
) |
(15,994 |
) |
(19,648 |
) |
Total loans—net of unearned income
and allowance for credit losses |
$ |
654,679 |
|
$ |
612,309 |
|
$ |
604,991 |
|
$ |
628,641 |
|
$ |
645,824 |
|
Allowance for loan losses as a percentage of total loans—
net of unearned income(4)
|
1.87 |
% |
1.94 |
% |
2.06 |
% |
2.50 |
% |
2.97 |
% |
Allowance for consumer loan losses as a percentage of
total consumer loans—net of unearned income(4)
|
2.96 |
% |
2.88 |
% |
3.02 |
% |
3.71 |
% |
4.36 |
% |
Allowance for corporate loan losses as a percentage of
total corporate loans—net of unearned income(4)
|
0.76 |
% |
0.91 |
% |
0.97 |
% |
0.90 |
% |
0.99 |
% |
|
|
(1) |
Loans secured primarily by real estate. |
|
|
(2) |
Unearned income on consumer loans primarily represents unamortized origination fees, costs, premiums and discounts. Prior to December 31, 2015, these items were more than offset by prepaid interest on loans outstanding issued by OneMain Financial. The sale of OneMain Financial was completed on November 15, 2015. |
|
|
(3) |
Unearned income on corporate loans primarily represents interest received in advance, but not yet earned on loans originated on a discount basis. |
|
|
(4) |
All periods exclude loans that are carried at fair value. |
Details of Credit Loss Experience
|
|
|
|
|
|
|
|
|
|
|
|
|
|
|
|
|
In millions of dollars |
2017 |
2016 |
2015 |
2014 |
2013 |
Allowance for loan losses at beginning of period |
$ |
12,060 |
|
$ |
12,626 |
|
$ |
15,994 |
|
$ |
19,648 |
|
$ |
25,455 |
|
Provision for loan losses |
|
|
|
|
|
Consumer |
$ |
7,363 |
|
$ |
6,321 |
|
$ |
6,228 |
|
$ |
6,699 |
|
$ |
7,591 |
|
Corporate |
140 |
|
428 |
|
880 |
|
129 |
|
13 |
|
|
Total
|
$ |
7,503 |
|
$ |
6,749 |
|
$ |
7,108 |
|
$ |
6,828 |
|
$ |
7,604 |
|
Gross credit losses |
|
|
|
|
|
Consumer |
|
|
|
|
|
In U.S. offices |
$ |
5,736 |
|
$ |
4,970 |
|
$ |
5,500 |
|
$ |
6,780 |
|
$ |
8,402 |
|
In offices outside the U.S. |
2,447 |
|
2,672 |
|
3,192 |
|
3,874 |
|
3,926 |
|
Corporate |
|
|
|
|
|
Commercial and industrial, and other |
|
|
|
|
|
In U.S. offices |
151 |
|
274 |
|
112 |
|
66 |
|
125 |
|
In offices outside the U.S. |
331 |
|
256 |
|
182 |
|
310 |
|
216 |
|
Loans to financial institutions |
|
|
|
|
|
In U.S. offices |
3 |
|
5 |
|
— |
|
2 |
|
2 |
|
In offices outside the U.S. |
1 |
|
5 |
|
4 |
|
13 |
|
7 |
|
Mortgage and real estate |
|
|
|
|
|
In U.S offices |
2 |
|
34 |
|
8 |
|
8 |
|
62 |
|
In offices outside the U.S. |
2 |
|
6 |
|
43 |
|
55 |
|
29 |
|
|
Total
|
$ |
8,673 |
|
$ |
8,222 |
|
$ |
9,041 |
|
$ |
11,108 |
|
$ |
12,769 |
|
Credit recoveries(1)
|
|
|
|
|
|
Consumer |
|
|
|
|
|
In U.S. offices |
$ |
903 |
|
$ |
980 |
|
$ |
975 |
|
$ |
1,122 |
|
$ |
1,073 |
|
In offices outside the U.S. |
583 |
|
614 |
|
659 |
|
853 |
|
1,008 |
|
Corporate |
|
|
|
|
|
Commercial and industrial, and other |
|
|
|
|
|
In U.S. offices |
20 |
|
23 |
|
22 |
|
64 |
|
62 |
|
In offices outside the U.S. |
86 |
|
41 |
|
67 |
|
84 |
|
109 |
|
Loans to financial institutions |
|
|
|
|
|
In U.S. offices |
1 |
|
1 |
|
7 |
|
1 |
|
1 |
|
In offices outside the U.S. |
1 |
|
1 |
|
2 |
|
11 |
|
20 |
|
Mortgage and real estate |
|
|
|
|
|
In U.S. offices |
2 |
|
1 |
|
7 |
|
— |
|
31 |
|
In offices outside the U.S. |
1 |
|
— |
|
— |
|
— |
|
2 |
|
|
Total
|
$ |
1,597 |
|
$ |
1,661 |
|
$ |
1,739 |
|
$ |
2,135 |
|
$ |
2,306 |
|
Net credit losses |
|
|
|
|
|
In U.S. offices |
$ |
4,966 |
|
$ |
4,278 |
|
$ |
4,609 |
|
$ |
5,669 |
|
$ |
7,424 |
|
In offices outside the U.S. |
2,110 |
|
2,283 |
|
2,693 |
|
3,304 |
|
3,039 |
|
Total |
$ |
7,076 |
|
$ |
6,561 |
|
$ |
7,302 |
|
$ |
8,973 |
|
$ |
10,463 |
|
Other—net(2)(3)(4)(5)(6)(7)(8)
|
$ |
(132 |
) |
$ |
(754 |
) |
$ |
(3,174 |
) |
$ |
(1,509 |
) |
$ |
(2,948 |
) |
Allowance for loan losses at end of period |
$ |
12,355 |
|
$ |
12,060 |
|
$ |
12,626 |
|
$ |
15,994 |
|
$ |
19,648 |
|
Allowance for loan losses as a percentage of total loans(9)
|
1.87 |
% |
1.94 |
% |
2.06 |
% |
2.50 |
% |
2.97 |
% |
Allowance for unfunded lending commitments(8)(10)
|
$ |
1,258 |
|
$ |
1,418 |
|
$ |
1,402 |
|
$ |
1,063 |
|
$ |
1,229 |
|
Total allowance for loan losses and unfunded lending commitments |
$ |
13,613 |
|
$ |
13,478 |
|
$ |
14,028 |
|
$ |
17,057 |
|
$ |
20,877 |
|
Net consumer credit losses |
$ |
6,697 |
|
$ |
6,048 |
|
$ |
7,058 |
|
$ |
8,679 |
|
$ |
10,247 |
|
As a percentage of average consumer loans |
2.07 |
% |
1.88 |
% |
2.08 |
% |
2.31 |
% |
2.63 |
% |
Net corporate credit losses |
$ |
379 |
|
$ |
513 |
|
$ |
244 |
|
$ |
294 |
|
$ |
216 |
|
|
|
|
|
|
|
|
|
|
|
|
|
|
|
|
|
|
As a percentage of average corporate loans |
0.12 |
% |
0.17 |
% |
0.08 |
% |
0.10 |
% |
0.08 |
% |
Allowance by type(11)
|
|
|
|
|
|
Consumer |
$ |
9,869 |
|
$ |
9,358 |
|
$ |
9,835 |
|
$ |
13,547 |
|
$ |
16,974 |
|
Corporate |
2,486 |
|
2,702 |
|
2,791 |
|
2,447 |
|
2,674 |
|
Total Citigroup |
$ |
12,355 |
|
$ |
12,060 |
|
$ |
12,626 |
|
$ |
15,994 |
|
$ |
19,648 |
|
|
|
(1) |
Recoveries have been reduced by certain collection costs that are incurred only if collection efforts are successful. |
|
|
(2) |
Includes all adjustments to the allowance for credit losses, such as changes in the allowance from acquisitions, dispositions, securitizations, FX translation, purchase accounting adjustments, etc. |
|
|
(3) |
2017 includes reductions of approximately $261 million related to the sale or transfer to HFS of various loan portfolios, which includes approximately $106 million related to the transfer of various real estate loan portfolios to HFS. Additionally, 2017 includes an increase of approximately $115 million related to FX translation. |
|
|
(4) |
2016 includes reductions of approximately $574 million related to the sale or transfer to HFS of various loan portfolios, which includes approximately $106 million related to the transfer of various real estate loan portfolios to HFS. Additionally, 2016 includes a reduction of approximately $199 million related to FX translation. |
|
|
(5) |
2015 includes reductions of approximately $2.4 billion related to the sale or transfer to HFS of various loan portfolios, which includes approximately $1.5 billion related to the transfer of various real estate loan portfolios to HFS. Additionally, 2015 includes a reduction of approximately $474 million related to FX translation. |
|
|
(6) |
2014 includes reductions of approximately $1.1 billion related to the sale or transfer to HFS of various loan portfolios, which includes approximately $411 million related to the transfer of various real estate loan portfolios to HFS, approximately $204 million related to the transfer to HFS of a business in Greece, approximately $177 million related to the transfer to HFS of a business in Spain, approximately $29 million related to the transfer to HFS of a business in Honduras, and approximately $108 million related to the transfer to HFS of various EMEA loan portfolios. Additionally, 2014 includes a reduction of approximately $463 million related to FX translation.
|
|
|
(7) |
2013 includes reductions of approximately $2.4 billion related to the sale or transfer to HFS of various loan portfolios, which includes approximately $360 million related to the sale of Credicard and approximately $255 million related to a transfer to HFS of a loan portfolio in Greece, approximately $230 million related to a non-provision transfer of reserves associated with deferred interest to other assets which includes deferred interest and approximately $220 million related to FX translation. |
|
|
(8) |
2015 includes a reclassification of $271 million of Allowance for loan losses to allowance for unfunded lending commitments, included in the Other line item. This reclassification reflects the re-attribution of $271 million in allowance for credit losses between the funded and unfunded portions of the corporate credit portfolios and does not reflect a change in the underlying credit performance of these portfolios.
|
|
|
(9) |
December 31, 2017, December 31, 2016, December 31, 2015, December 31, 2014 and December 31, 2013 exclude $4.4 billion, $3.5 billion, $5.0 billion, $5.9 billion and $5.0 billion, respectively, of loans which are carried at fair value. |
|
|
(10) |
Represents additional credit reserves recorded as Other liabilities on the Consolidated Balance Sheet.
|
|
|
(11) |
Allowance for loan losses represents management’s best estimate of probable losses inherent in the portfolio, as well as probable losses related to large individually evaluated impaired loans and troubled debt restructurings. See “Significant Accounting Policies and Significant Estimates” and Note 1 to the Consolidated Financial Statements below. Attribution of the allowance is made for analytical purposes only and the entire allowance is available to absorb probable credit losses inherent in the overall portfolio. |
Allowance for Loan Losses
The following tables detail information on Citi’s allowance for loan losses, loans and coverage ratios:
|
|
|
|
|
|
|
|
|
|
|
December 31, 2017 |
In billions of dollars |
Allowance for
loan losses
|
Loans, net of
unearned income
|
Allowance as a
percentage of loans(1)
|
North America cards(2)
|
$ |
6.1 |
|
$ |
139.7 |
|
4.4 |
% |
North America mortgages(3)
|
0.7 |
|
64.2 |
|
1.1 |
|
North America other
|
0.3 |
|
13.0 |
|
2.3 |
|
International cards |
1.3 |
|
25.7 |
|
5.1 |
|
International other(4)
|
1.5 |
|
91.1 |
|
1.6 |
|
Total consumer |
$ |
9.9 |
|
$ |
333.7 |
|
3.0 |
% |
Total corporate |
2.5 |
|
333.3 |
|
0.8 |
|
Total Citigroup |
$ |
12.4 |
|
$ |
667.0 |
|
1.9 |
% |
|
|
(1) |
Allowance as a percentage of loans excludes loans that are carried at fair value. |
|
|
(2) |
Includes both Citi-branded cards and Citi retail services. The $6.1 billion of loan loss reserves represented approximately 16 months of coincident net credit loss coverage. |
|
|
(3) |
Of the $0.7 billion, approximately $0.6 billion was allocated to North America mortgages in Corporate/Other. Of the $0.7 billion, approximately $0.2 billion and $0.5 billion are determined in accordance with ASC 450-20 and ASC 310-10-35 (troubled debt restructurings), respectively. Of the $64.2 billion in loans, approximately $60.4 billion and $3.7 billion of the loans are evaluated in accordance with ASC 450-20 and ASC 310-10-35 (troubled debt restructurings), respectively. For additional information, see Note 15 to the Consolidated Financial Statements.
|
|
|
(4) |
Includes mortgages and other retail loans. |
|
|
|
|
|
|
|
|
|
|
|
December 31, 2016 |
In billions of dollars |
Allowance for
loan losses
|
Loans, net of
unearned income
|
Allowance as a
percentage of loans(1)
|
North America cards(2)
|
$ |
5.2 |
|
$ |
133.3 |
|
3.9 |
% |
North America mortgages(3)
|
1.1 |
|
72.6 |
|
1.5 |
|
North America other
|
0.5 |
|
13.6 |
|
3.7 |
|
International cards |
1.2 |
|
23.1 |
|
5.2 |
|
International other(4)
|
1.4 |
|
82.5 |
|
1.7 |
|
Total consumer |
$ |
9.4 |
|
$ |
325.1 |
|
2.9 |
% |
Total corporate |
2.7 |
|
299.3 |
|
0.9 |
|
Total Citigroup |
$ |
12.1 |
|
$ |
624.4 |
|
1.9 |
% |
|
|
(1) |
Allowance as a percentage of loans excludes loans that are carried at fair value. |
|
|
(2) |
Includes both Citi-branded cards and Citi retail services. The $5.2 billion of loan loss reserves represented approximately 15 months of coincident net credit loss coverage. |
|
|
(3) |
Of the $1.1 billion, approximately $1.0 billion was allocated to North America mortgages in Corporate/Other. Of the $1.1 billion, approximately $0.4 billion and $0.7 billion are determined in accordance with ASC 450-20 and ASC 310-10-35 (troubled debt restructurings), respectively. Of the $72.6 billion in loans, approximately $67.7 billion and $4.8 billion of the loans are evaluated in accordance with ASC 450-20 and ASC 310-10-35 (troubled debt restructurings), respectively. For additional information, see Note 15 to the Consolidated Financial Statements.
|
|
|
(4) |
Includes mortgages and other retail loans. |
Non-Accrual Loans and Assets and Renegotiated Loans
There is a certain amount of overlap among non-accrual loans and assets and renegotiated loans. The following summary provides a general description of each category:
Non-Accrual Loans and Assets:
|
|
• |
Corporate and consumer (including commercial banking) non-accrual status is based on the determination that payment of interest or principal is doubtful. |
|
|
• |
A corporate loan may be classified as non-accrual and still be performing under the terms of the loan structure. Payments received on corporate non-accrual loans are generally applied to loan principal and not reflected as interest income. Approximately 74%, 69% and 64% of Citi’s corporate non-accrual loans were performing at December 31, 2017, September 30, 2017 and December 31, 2016, respectively.
|
|
|
• |
Consumer non-accrual status is generally based on aging, i.e., the borrower has fallen behind on payments. |
|
|
• |
Consumer mortgage loans, other than Federal Housing Administration (FHA) insured loans, are classified as non-accrual within 60 days of notification that the borrower has filed for bankruptcy. In addition, home equity loans are classified as non-accrual if the related residential first mortgage loan is 90 days or more past due. |
|
|
• |
North America Citi-branded cards and Citi retail services are not included because, under industry standards, credit card loans accrue interest until such loans are charged off, which typically occurs at 180 days of contractual delinquency.
|
Renegotiated Loans:
|
|
• |
Includes both corporate and consumer loans whose terms have been modified in a troubled debt restructuring (TDR). |
|
|
• |
Includes both accrual and non-accrual TDRs. |
Non-Accrual Loans
The table below summarizes Citigroup’s non-accrual loans as of the periods indicated. Non-accrual loans may still be current on interest payments. In situations where Citi reasonably expects that only a portion of the principal owed
will ultimately be collected, all payments received are reflected as a reduction of principal and not as interest income. For all other non-accrual loans, cash interest receipts are generally recorded as revenue.
|
|
|
|
|
|
|
|
|
|
|
|
|
|
|
|
|
|
December 31, |
In millions of dollars |
2017 |
2016 |
2015 |
2014 |
2013 |
Corporate non-accrual loans(1)(2)
|
|
|
|
|
|
North America |
$ |
784 |
|
$ |
984 |
|
$ |
818 |
|
$ |
321 |
|
$ |
735 |
|
EMEA |
849 |
|
904 |
|
347 |
|
285 |
|
812 |
|
Latin America |
280 |
|
379 |
|
303 |
|
417 |
|
132 |
|
Asia |
29 |
|
154 |
|
128 |
|
179 |
|
279 |
|
Total corporate non-accrual loans |
$ |
1,942 |
|
$ |
2,421 |
|
$ |
1,596 |
|
$ |
1,202 |
|
$ |
1,958 |
|
Consumer non-accrual loans(1)(3)
|
|
|
|
|
|
North America |
$ |
1,650 |
|
$ |
2,160 |
|
$ |
2,515 |
|
$ |
4,411 |
|
$ |
5,239 |
|
Latin America |
756 |
|
711 |
|
874 |
|
1,188 |
|
1,420 |
|
Asia(4)
|
284 |
|
287 |
|
269 |
|
306 |
|
386 |
|
Total consumer non-accrual loans |
$ |
2,690 |
|
$ |
3,158 |
|
$ |
3,658 |
|
$ |
5,905 |
|
$ |
7,045 |
|
Total non-accrual loans |
$ |
4,632 |
|
$ |
5,579 |
|
$ |
5,254 |
|
$ |
7,107 |
|
$ |
9,003 |
|
|
|
(1) |
Excludes purchased distressed loans, as they are generally accreting interest. The carrying value of these loans was $167 million at December 31, 2017, $187 million at December 31, 2016, $250 million at December 31, 2015, $421 million at December 31, 2014 and $703 million at December 31, 2013. |
|
|
(2) |
The increase in corporate non-accrual loans from December 31, 2015 to December 31, 2016 was primarily related to Citi’s North America and EMEA energy and energy-related corporate credit exposure during 2016.
|
(3) 2015 decline includes the impact related to the transfer of approximately $8 billion of mortgage loans to Loans HFS (included within Other assets).
(4) Asia includes balances in certain EMEA countries for all periods presented.
The changes in Citigroup’s non-accrual loans were as follows:
|
|
|
|
|
|
|
|
|
|
|
|
|
|
|
|
|
|
|
|
|
Year ended |
Year ended |
|
December 31, 2017 |
December 31, 2016 |
In millions of dollars |
Corporate |
Consumer |
Total |
Corporate |
Consumer |
Total |
Non-accrual loans at beginning of period |
$ |
2,421 |
|
$ |
3,158 |
|
$ |
5,579 |
|
$ |
1,596 |
|
$ |
3,658 |
|
$ |
5,254 |
|
Additions |
1,347 |
|
3,508 |
|
4,855 |
|
2,713 |
|
4,460 |
|
7,173 |
|
Sales and transfers to held-for-sale |
(134 |
) |
(379 |
) |
(513 |
) |
(82 |
) |
(738 |
) |
(820 |
) |
Returned to performing |
(47 |
) |
(634 |
) |
(681 |
) |
(150 |
) |
(606 |
) |
(756 |
) |
Paydowns/settlements |
(1,400 |
) |
(1,163 |
) |
(2,563 |
) |
(1,198 |
) |
(1,648 |
) |
(2,846 |
) |
Charge-offs |
(144 |
) |
(1,869 |
) |
(2,013 |
) |
(386 |
) |
(1,855 |
) |
(2,241 |
) |
Other |
(101 |
) |
69 |
|
(32 |
) |
(72 |
) |
(113 |
) |
(185 |
) |
Ending balance |
$ |
1,942 |
|
$ |
2,690 |
|
$ |
4,632 |
|
$ |
2,421 |
|
$ |
3,158 |
|
$ |
5,579 |
|
The table below summarizes Citigroup’s other real estate owned (OREO) assets as of the periods indicated. This represents the carrying value of all real estate property acquired by foreclosure or other legal proceedings when Citi has taken possession of the collateral:
|
|
|
|
|
|
|
|
|
|
|
|
|
|
|
|
|
|
December 31, |
In millions of dollars |
2017 |
2016 |
2015 |
2014 |
2013 |
OREO(1)
|
|
|
|
|
|
North America |
$ |
89 |
|
$ |
161 |
|
$ |
166 |
|
$ |
196 |
|
$ |
304 |
|
EMEA |
2 |
|
— |
|
1 |
|
7 |
|
59 |
|
Latin America |
35 |
|
18 |
|
38 |
|
47 |
|
47 |
|
Asia |
18 |
|
7 |
|
4 |
|
10 |
|
6 |
|
Total OREO |
$ |
144 |
|
$ |
186 |
|
$ |
209 |
|
$ |
260 |
|
$ |
416 |
|
Non-accrual assets |
|
|
|
|
|
Corporate non-accrual loans |
$ |
1,942 |
|
$ |
2,421 |
|
$ |
1,596 |
|
$ |
1,202 |
|
$ |
1,958 |
|
Consumer non-accrual loans(2)
|
2,690 |
|
3,158 |
|
3,658 |
|
5,905 |
|
7,045 |
|
Non-accrual loans (NAL) |
$ |
4,632 |
|
$ |
5,579 |
|
$ |
5,254 |
|
$ |
7,107 |
|
$ |
9,003 |
|
OREO |
$ |
144 |
|
$ |
186 |
|
$ |
209 |
|
$ |
260 |
|
$ |
416 |
|
Non-accrual assets (NAA) |
$ |
4,776 |
|
$ |
5,765 |
|
$ |
5,463 |
|
$ |
7,367 |
|
$ |
9,419 |
|
NAL as a percentage of total loans |
0.69 |
% |
0.89 |
% |
0.85 |
% |
1.10 |
% |
1.35 |
% |
NAA as a percentage of total assets |
0.26 |
|
0.32 |
|
0.32 |
|
0.40 |
|
0.50 |
|
Allowance for loan losses as a percentage of NAL(3)
|
267 |
|
216 |
|
240 |
|
225 |
|
218 |
|
|
|
(1) |
Reflects a decrease of $130 million related to the adoption of ASU 2014-14 in the fourth quarter of 2014, which requires certain government guaranteed mortgage loans to be recognized as separate other receivables upon foreclosure. Prior periods have not been restated. |
|
|
(2) |
2015 decline includes the impact related to the transfer of approximately $8 billion of mortgage loans to Loans HFS (included within Other assets).
|
|
|
(3) |
The allowance for loan losses includes the allowance for Citi’s credit card portfolios and purchased distressed loans, while the non-accrual loans exclude credit card balances (with the exception of certain international portfolios) and purchased distressed loans as these continue to accrue interest until charge-off. |
Renegotiated Loans
The following table presents Citi’s loans modified in TDRs:
|
|
|
|
|
|
|
|
In millions of dollars |
Dec. 31, 2017 |
Dec. 31, 2016 |
Corporate renegotiated loans(1)
|
|
|
In U.S. offices |
|
|
Commercial and industrial(2)
|
$ |
225 |
|
$ |
89 |
|
Mortgage and real estate |
90 |
|
84 |
|
Financial institutions |
33 |
|
9 |
|
Other |
45 |
|
228 |
|
|
$ |
393 |
|
$ |
410 |
|
In offices outside the U.S. |
|
|
Commercial and industrial(2)
|
$ |
392 |
|
$ |
319 |
|
Mortgage and real estate |
11 |
|
3 |
|
Financial institutions |
15 |
|
— |
|
Lease Financing |
7 |
|
— |
|
|
$ |
425 |
|
$ |
322 |
|
Total corporate renegotiated loans |
$ |
818 |
|
$ |
732 |
|
Consumer renegotiated loans(3)(4)(5)
|
|
|
In U.S. offices |
|
|
Mortgage and real estate(6)
|
$ |
3,709 |
|
$ |
4,695 |
|
Cards |
1,246 |
|
1,313 |
|
Installment and other |
169 |
|
117 |
|
|
$ |
5,124 |
|
$ |
6,125 |
|
In offices outside the U.S. |
|
|
Mortgage and real estate |
$ |
345 |
|
$ |
447 |
|
Cards |
541 |
|
435 |
|
Installment and other |
427 |
|
443 |
|
|
$ |
1,313 |
|
$ |
1,325 |
|
Total consumer renegotiated loans |
$ |
6,437 |
|
$ |
7,450 |
|
|
|
(1) |
Includes $715 million and $445 million of non-accrual loans included in the non-accrual loans table above at December 31, 2017 and December 31, 2016, respectively. The remaining loans are accruing interest. |
|
|
(2) |
In addition to modifications reflected as TDRs at December 31, 2017 and December 31, 2016, Citi also modified $51 million and $257 million, respectively, and $95 million and $217 million, respectively, of commercial loans risk rated “Substandard Non-Performing” or worse (asset category defined by banking regulators) in offices inside and outside the U.S. These modifications were not considered TDRs because the modifications did not involve a concession (a required element of a TDR for accounting purposes). |
|
|
(3) |
Includes $1,376 million and $1,502 million of non-accrual loans included in the non-accrual loans table above at December 31, 2017 and 2016, respectively. The remaining loans are accruing interest. |
|
|
(4) |
Includes $26 million and $58 million of commercial real estate loans at December 31, 2017 and 2016, respectively. |
|
|
(5) |
Includes $165 million and $105 million of other commercial loans at December 31, 2017 and 2016, respectively. |
|
|
(6) |
Reduction in 2017 includes $892 million related to TDRs sold or transferred to held-for-sale. |
Forgone Interest Revenue on Loans(1)
|
|
|
|
|
|
|
|
|
|
|
In millions of dollars |
In U.S.
offices |
In non-
U.S.
offices |
2017
total |
Interest revenue that would have been accrued at original contractual rates(2)
|
$ |
637 |
|
$ |
416 |
|
$ |
1,053 |
|
Amount recognized as interest revenue(2)
|
299 |
|
133 |
|
432 |
|
Forgone interest revenue |
$ |
338 |
|
$ |
283 |
|
$ |
621 |
|
|
|
(1) |
Relates to corporate non-accrual loans, renegotiated loans and consumer loans on which accrual of interest has been suspended. |
|
|
(2) |
Interest revenue in offices outside the U.S. may reflect prevailing local interest rates, including the effects of inflation and monetary correction in certain countries. |
LIQUIDITY RISK
Overview
Adequate and diverse sources of funding and liquidity are essential to Citi’s businesses. Funding and liquidity risks arise from several factors, many of which are mostly or entirely outside Citi’s control, such as disruptions in the financial markets, changes in key funding sources, credit spreads, changes in Citi’s credit ratings and geopolitical and macroeconomic conditions. For additional information, see “Risk Factors” above.
Citi’s funding and liquidity objectives are aimed at (i) funding its existing asset base, (ii) growing its core businesses, (iii) maintaining sufficient liquidity, structured appropriately, so that Citi can operate under a variety of adverse circumstances, including potential Company-specific and/or market liquidity events in varying durations and severity, and (iv) satisfying regulatory requirements, including, among other things, those related to resolution and resolution planning (for additional information, see “Resolution Plan” and “Total Loss-Absorbing Capacity (TLAC)” below). Citigroup’s primary liquidity objectives are established by entity, and in aggregate, across two major categories:
|
|
• |
Citibank (including Citibank Europe plc, Citibank Singapore Ltd. and Citibank (Hong Kong) Ltd.); and |
|
|
• |
the non-bank and other, which includes the parent holding company (Citigroup), Citi’s primary intermediate holding company (Citicorp LLC), Citi’s broker-dealer subsidiaries (including Citigroup Global Markets Inc., Citigroup Global Markets Ltd. and Citigroup Global Markets Japan Inc.) and other bank and non-bank subsidiaries that are consolidated into Citigroup (including Citibanamex). |
At an aggregate level, Citigroup’s goal is to maintain sufficient funding in amount and tenor to fully fund customer assets and to provide an appropriate amount of cash and high-quality liquid assets (as discussed further below), even in
times of stress. The liquidity risk management framework provides that in addition to the aggregate requirements, certain entities be self-sufficient or net providers of liquidity, including in conditions established under their designated stress tests.
Citi’s primary sources of funding include (i) deposits via Citi’s bank subsidiaries, which are Citi’s most stable and lowest cost source of long-term funding, (ii) long-term debt (primarily senior and subordinated debt) primarily issued at the parent and certain bank subsidiaries, and (iii) stockholders’ equity. These sources may be supplemented by short-term borrowings, primarily in the form of secured funding transactions.
As referenced above, Citi works to ensure that the tenor of these funding sources is sufficiently long in relation to the tenor of its asset base. The goal of Citi’s asset/liability management is to ensure that there is excess liquidity and tenor in the liability structure relative to the liquidity profile of the assets. This reduces the risk that liabilities will become due before asset maturities or monetizations through sale. This excess liquidity is held primarily in the form of high-quality liquid assets (HQLA), as set forth in the table below.
Citi’s Treasurer has overall responsibility for management of Citi’s HQLA. Citi’s liquidity is managed via a centralized treasury model by Corporate Treasury, in conjunction with regional and in-country treasurers. Pursuant to this approach, Citi’s HQLA is managed with emphasis on asset-liability management and entity-level liquidity adequacy throughout Citi.
Citi’s Chief Risk Officer is responsible for the overall liquidity risk profile of Citi. The Chief Risk Officer and Citi’s CFO co-chair Citi’s Asset Liability Management Committee (ALCO), which includes Citi’s Treasurer and other senior executives. ALCO sets the strategy of the liquidity portfolio and monitors its performance. Significant changes to portfolio asset allocations need to be approved by ALCO.
High-Quality Liquid Assets (HQLA)
|
|
|
|
|
|
|
|
|
|
|
|
|
|
|
|
|
|
|
|
|
|
|
|
|
|
|
|
|
|
Citibank |
Non-bank and Other |
Total |
In billions of dollars |
Dec. 31, 2017 |
Sept. 30, 2017 |
Dec. 31, 2016 |
Dec. 31, 2017 |
Sept. 30, 2017 |
Dec. 31, 2016 |
Dec. 31, 2017 |
Sept. 30, 2017 |
Dec. 31, 2016 |
Available cash |
$ |
94.3 |
|
$ |
92.7 |
|
$ |
80.9 |
|
$ |
30.9 |
|
$ |
32.9 |
|
$ |
18.4 |
|
$ |
125.2 |
|
$ |
125.6 |
|
$ |
99.2 |
|
U.S. sovereign |
113.2 |
|
108.4 |
|
113.6 |
|
27.9 |
|
26.6 |
|
22.5 |
|
141.1 |
|
135.0 |
|
136.1 |
|
U.S. agency/agency MBS |
80.8 |
|
68.1 |
|
62.8 |
|
0.5 |
|
0.6 |
|
0.1 |
|
81.3 |
|
68.7 |
|
63.0 |
|
Foreign government debt(1)
|
80.5 |
|
101.3 |
|
87.5 |
|
16.4 |
|
16.3 |
|
15.5 |
|
96.9 |
|
117.6 |
|
103.0 |
|
Other investment grade |
0.7 |
|
0.5 |
|
0.9 |
|
1.2 |
|
1.2 |
|
1.5 |
|
1.9 |
|
1.7 |
|
2.5 |
|
Total HQLA (AVG) |
$ |
369.5 |
|
$ |
371.0 |
|
$ |
345.7 |
|
$ |
76.9 |
|
$ |
77.6 |
|
$ |
58.0 |
|
$ |
446.4 |
|
$ |
448.6 |
|
$ |
403.7 |
|
Note: The amounts set forth in the table above are presented on an average basis. For securities, the amounts represent the liquidity value that potentially could be realized and, therefore, exclude any securities that are encumbered and incorporate any haircuts that would be required for securities financing transactions.
|
|
(1) |
Foreign government debt includes securities issued or guaranteed by foreign sovereigns, agencies and multilateral development banks. Foreign government debt securities are held largely to support local liquidity requirements and Citi’s local franchises and primarily include government bonds from Hong Kong, Singapore, Korea, India and Mexico. |
As set forth in the table above, Citi’s total HQLA increased year-over-year, primarily driven by an increase in cash related to resolution planning. Sequentially, Citi’s HQLA decreased modestly, primarily driven by loan growth, partially offset by growth in deposits.
Citi’s HQLA as set forth above does not include Citi’s available borrowing capacity from the Federal Home Loan Banks (FHLB) of which Citi is a member, which was approximately $10 billion as of December 31, 2017 (compared to $16 billion as of September 30, 2017 and $21 billion as of December 31, 2016) and maintained by eligible collateral pledged to such banks. The HQLA also does not include Citi’s borrowing capacity at the U.S. Federal Reserve Bank discount window or other central banks, which would be in addition to the resources noted above.
In general, Citi’s liquidity is fungible across legal entities within its bank group. Citi’s bank subsidiaries, including Citibank, can lend to the Citi parent and broker-dealer entities in accordance with Section 23A of the Federal Reserve Act. As of December 31, 2017, the capacity available for lending to these entities under Section 23A was approximately $15 billion, unchanged from both September 30, 2017 and December 31, 2016, subject to certain eligible non-cash collateral requirements.
Loans
As part of its funding and liquidity objectives, Citi seeks to fund its existing asset base appropriately as well as maintain sufficient liquidity to grow its GCB and ICG businesses, including its loan portfolio. Citi maintains a diversified portfolio of loans to its consumer and institutional clients. The table below sets forth the average loans, by business and/or segment, and the total end-of-period loans for each of the periods indicated:
|
|
|
|
|
|
|
|
|
|
|
In billions of dollars |
Dec. 31, 2017 |
Sept. 30, 2017 |
Dec. 31, 2016 |
Global Consumer Banking |
|
|
|
North America |
$ |
189.7 |
|
$ |
186.7 |
|
$ |
182.0 |
|
Latin America |
25.7 |
|
26.8 |
|
23.5 |
|
Asia(1)
|
87.9 |
|
86.2 |
|
81.9 |
|
Total |
$ |
303.3 |
|
$ |
299.7 |
|
$ |
287.4 |
|
Institutional Clients Group |
|
|
|
Corporate lending |
124.8 |
|
123.3 |
|
118.9 |
|
Treasury and trade solutions (TTS) |
77.0 |
|
74.9 |
|
71.5 |
|
Private Bank |
85.9 |
|
82.6 |
|
75.2 |
|
Markets and securities services and other
|
40.4 |
|
40.1 |
|
38.6 |
|
Total |
$ |
328.2 |
|
$ |
320.9 |
|
$ |
304.3 |
|
Total Corporate/Other
|
23.6 |
|
25.8 |
|
34.6 |
|
Total Citigroup loans (AVG) |
$ |
655.1 |
|
$ |
646.3 |
|
$ |
626.3 |
|
Total Citigroup loans (EOP) |
$ |
667.0 |
|
$ |
653.2 |
|
$ |
624.4 |
|
|
|
(1) |
Includes loans in certain EMEA countries for all periods presented.
|
As set forth in the table above, end-of-period loans increased 7% year-over-year and 2% sequentially in the fourth quarter. On an average basis, loans increased 5% year-over-year and 1% sequentially.
Excluding the impact of FX translation, average loans increased 3% year-over-year, driven by 5% aggregate across GCB and ICG. Within GCB, loans grew 4%, with growth across all regions.
Average ICG loans increased 6% year-over-year, driven primarily by client-led growth in the private bank. Treasury and trade solutions and corporate lending increased 6% and 4%, respectively, both driven by growth in Asia and EMEA.
Average Corporate/Other loans decreased 32% year-over-year, driven by the continued wind-down of legacy assets.
Deposits
Deposits are Citi’s primary and lowest-cost funding source. The table below sets forth the average deposits, by business and/or segment, and the total end-of-period deposits for each of the periods indicated:
|
|
|
|
|
|
|
|
|
|
|
In billions of dollars |
Dec. 31, 2017 |
Sept. 30, 2017 |
Dec. 31, 2016 |
Global Consumer Banking |
|
|
|
North America |
$ |
182.7 |
|
$ |
184.1 |
|
$ |
186.0 |
|
Latin America |
27.8 |
|
28.8 |
|
25.2 |
|
Asia(1)
|
96.0 |
|
95.2 |
|
89.9 |
|
Total |
$ |
306.5 |
|
$ |
308.1 |
|
$ |
301.1 |
|
Institutional Clients Group |
|
|
|
Treasury and trade solutions (TTS) |
444.5 |
|
427.8 |
|
415.4 |
|
Banking ex-TTS |
126.9 |
|
122.4 |
|
122.4 |
|
Markets and securities services |
82.9 |
|
84.7 |
|
81.7 |
|
Total |
$ |
654.4 |
|
$ |
634.9 |
|
$ |
619.5 |
|
Total Corporate/Other
|
12.4 |
|
22.9 |
|
14.6 |
|
Total Citigroup deposits (AVG) |
$ |
973.3 |
|
$ |
965.9 |
|
$ |
935.1 |
|
Total Citigroup deposits (EOP) |
$ |
959.8 |
|
$ |
964.0 |
|
$ |
929.4 |
|
|
|
(1) |
Includes deposits in certain EMEA countries for all periods presented.
|
End-of-period deposits increased 3% year-over-year and remained unchanged sequentially in the fourth quarter. On an average basis, deposits increased 4% year-over-year and 1% sequentially.
Excluding the impact of FX translation, average deposits increased 3% year-over-year, driven primarily by 6% growth in TTS, as well as 4% aggregate growth in Asia GCB and Latin America GCB. North America GCB deposits declined 2% year-over-year, with half of the decline coming from lower escrow balances as a result of lower mortgage activity. Growth in checking deposits was more than offset by a reduction in money market balances, as clients transferred cash to investment accounts.
Long-Term Debt
Long-term debt (generally defined as debt with original maturities of one year or more) represents the most significant component of Citi’s funding for the parent entities and is a supplementary source of funding for the bank entities.
Long-term debt is an important funding source due in part to its multi-year contractual maturity structure. The weighted-average maturity of unsecured long-term debt issued by Citigroup and its affiliates (including Citibank) with a remaining life greater than one year (excluding remaining trust preferred securities outstanding) was approximately 6.8 years as of December 31, 2017, unchanged sequentially and a modest decline from 7.0 years from the prior year.
Citi’s long-term debt outstanding at the parent includes senior and subordinated debt and what Citi refers to as customer-related debt, consisting of structured notes, such as equity- and credit-linked notes, as well as non-structured notes. Citi’s issuance of customer-related debt is generally driven by customer demand and supplements benchmark debt issuance as a source of funding for Citi’s parent entities. Citi’s long-term debt at the bank also includes benchmark senior debt, FHLB advances and securitizations.
Long-Term Debt Outstanding
The following table sets forth Citi’s total long-term debt outstanding for the periods indicated:
|
|
|
|
|
|
|
|
|
|
|
In billions of dollars |
Dec. 31, 2017 |
Sept. 30, 2017 |
Dec. 31, 2016 |
Parent and other(1)
|
|
|
|
Benchmark debt: |
|
|
|
Senior debt |
$ |
109.8 |
|
$ |
109.8 |
|
$ |
99.9 |
|
Subordinated debt |
26.9 |
|
27.0 |
|
26.8 |
|
Trust preferred |
1.7 |
|
1.7 |
|
1.7 |
|
Customer-related debt |
30.7 |
|
30.3 |
|
25.8 |
|
Local country and other(2)
|
1.8 |
|
1.8 |
|
2.5 |
|
Total parent and other |
$ |
170.9 |
|
$ |
170.6 |
|
$ |
156.7 |
|
Bank |
|
|
|
FHLB borrowings |
$ |
19.3 |
|
$ |
19.8 |
|
$ |
21.6 |
|
Securitizations(3)
|
30.3 |
|
28.6 |
|
23.5 |
|
CBNA benchmark senior debt |
12.5 |
|
9.5 |
|
— |
|
Local country and other(2)
|
3.7 |
|
4.2 |
|
4.4 |
|
Total bank |
$ |
65.8 |
|
$ |
62.1 |
|
$ |
49.5 |
|
Total long-term debt |
$ |
236.7 |
|
$ |
232.7 |
|
$ |
206.2 |
|
Note: Amounts represent the current value of long-term debt on Citi’s Consolidated Balance Sheet which, for certain debt instruments, includes consideration of fair value, hedging impacts and unamortized discounts and premiums.
|
|
(1) |
“Parent and other” includes long-term debt issued to third parties by the parent holding company (Citigroup) and Citi’s non-bank subsidiaries (including broker-dealer subsidiaries) that are consolidated into Citigroup. As of December 31, 2017 “parent and other” included $18.7 billion of long-term debt issued by Citi’s broker-dealer subsidiaries. |
|
|
(2) |
Local country debt includes debt issued by Citi’s affiliates in support of their local operations. |
|
|
(3) |
Predominantly credit card securitizations, primarily backed by Citi-branded credit card receivables. |
Citi’s total long-term debt outstanding increased both year-over-year and quarter-over-quarter. The increase year-over-year was primarily driven by an increase in senior debt at
the parent, as well as increases in both Citibank benchmark senior debt and securitizations at the bank. In addition, the year-over-year increase in outstanding customer-related debt was driven by stronger customer demand and fewer maturities and redemptions. Sequentially, the increase was driven primarily by an increase in Citibank benchmark debt and securitizations at the bank.
As part of its liability management, Citi has considered, and may continue to consider, opportunities to repurchase its long-term debt pursuant to open market purchases, tender offers or other means. Such repurchases help reduce Citi’s overall funding costs and assist it in meeting regulatory changes and requirements. During 2017, Citi repurchased an aggregate of approximately $2.6 billion of its outstanding long-term debt, including early redemptions of FHLB advances.
Long-Term Debt Issuances and Maturities
The table below details Citi’s long-term debt issuances and maturities (including repurchases and redemptions) during the periods presented:
|
|
|
|
|
|
|
|
|
|
|
|
|
|
|
|
|
|
|
|
|
2017 |
2016 |
2015 |
In billions of dollars |
Maturities |
Issuances |
Maturities |
Issuances |
Maturities |
Issuances |
Parent and other |
|
|
|
|
|
|
Benchmark debt: |
|
|
|
|
|
|
Senior debt |
$ |
14.1 |
|
$ |
21.6 |
|
$ |
14.9 |
|
$ |
26.0 |
|
$ |
23.9 |
|
$ |
20.2 |
|
Subordinated debt |
1.6 |
|
1.3 |
|
3.2 |
|
4.0 |
|
4.0 |
|
7.5 |
|
Trust preferred |
— |
|
— |
|
— |
|
— |
|
— |
|
— |
|
Customer-related debt |
7.6 |
|
12.3 |
|
10.2 |
|
10.5 |
|
9.9 |
|
9.5 |
|
Local country and other |
1.1 |
|
0.1 |
|
2.1 |
|
2.2 |
|
0.4 |
|
1.9 |
|
Total parent and other |
$ |
24.5 |
|
$ |
35.3 |
|
$ |
30.4 |
|
$ |
42.7 |
|
$ |
38.2 |
|
$ |
39.1 |
|
Bank |
|
|
|
|
|
|
FHLB borrowings |
$ |
7.8 |
|
$ |
5.5 |
|
$ |
10.5 |
|
$ |
14.3 |
|
$ |
4.0 |
|
$ |
2.0 |
|
Securitizations |
5.3 |
|
12.2 |
|
10.7 |
|
3.3 |
|
7.9 |
|
0.8 |
|
CBNA benchmark senior debt |
— |
|
12.6 |
|
— |
|
— |
|
— |
|
— |
|
Local country and other |
3.4 |
|
2.3 |
|
3.9 |
|
3.4 |
|
2.8 |
|
2.7 |
|
Total bank |
$ |
16.5 |
|
$ |
32.6 |
|
$ |
25.1 |
|
$ |
21.0 |
|
$ |
14.7 |
|
$ |
5.5 |
|
Total |
$ |
41.0 |
|
$ |
68.0 |
|
$ |
55.5 |
|
$ |
63.7 |
|
$ |
52.9 |
|
$ |
44.6 |
|
The table below shows Citi’s aggregate long-term debt maturities (including repurchases and redemptions) in 2017, as well as its aggregate expected annual long-term debt maturities as of December 31, 2017:
|
|
|
|
|
|
|
|
|
|
|
|
|
|
|
|
|
|
|
|
|
|
|
|
|
|
|
Maturities |
In billions of dollars |
2017 |
2018 |
2019 |
2020 |
2021 |
2022 |
Thereafter |
Total |
Parent and other |
|
|
|
|
|
|
|
|
Benchmark debt: |
|
|
|
|
|
|
|
|
Senior debt |
$ |
14.1 |
|
$ |
18.4 |
|
$ |
14.8 |
|
$ |
8.9 |
|
$ |
14.4 |
|
$ |
8.1 |
|
$ |
45.3 |
|
$ |
109.8 |
|
Subordinated debt |
1.6 |
|
1.0 |
|
1.4 |
|
— |
|
— |
|
0.8 |
|
23.7 |
|
26.9 |
|
Trust preferred |
— |
|
— |
|
— |
|
— |
|
— |
|
— |
|
1.7 |
|
1.7 |
|
Customer-related debt |
7.6 |
|
4.2 |
|
2.8 |
|
3.9 |
|
2.5 |
|
2.0 |
|
15.4 |
|
30.7 |
|
Local country and other |
1.1 |
|
0.6 |
|
0.1 |
|
0.2 |
|
0.1 |
|
0.1 |
|
0.7 |
|
1.8 |
|
Total parent and other |
$ |
24.5 |
|
$ |
24.2 |
|
$ |
19.0 |
|
$ |
12.9 |
|
$ |
16.9 |
|
$ |
10.9 |
|
$ |
86.8 |
|
$ |
170.9 |
|
Bank |
|
|
|
|
|
|
|
|
FHLB borrowings |
$ |
7.8 |
|
$ |
16.8 |
|
$ |
2.6 |
|
$ |
— |
|
$ |
— |
|
$ |
— |
|
$ |
— |
|
$ |
19.3 |
|
Securitizations |
5.3 |
|
8.7 |
|
9.0 |
|
4.6 |
|
3.9 |
|
1.3 |
|
2.8 |
|
30.3 |
|
CBNA benchmark senior debt |
— |
|
2.2 |
|
4.7 |
|
5.2 |
|
— |
|
— |
|
0.3 |
|
12.5 |
|
Local country and other |
3.4 |
|
1.5 |
|
1.0 |
|
0.5 |
|
0.2 |
|
0.2 |
|
0.3 |
|
3.7 |
|
Total bank |
$ |
16.5 |
|
$ |
29.3 |
|
$ |
17.2 |
|
$ |
10.3 |
|
$ |
4.1 |
|
$ |
1.5 |
|
$ |
3.5 |
|
$ |
65.8 |
|
Total long-term debt |
$ |
41.0 |
|
$ |
53.5 |
|
$ |
36.3 |
|
$ |
23.2 |
|
$ |
21.0 |
|
$ |
12.4 |
|
$ |
90.3 |
|
$ |
236.7 |
|
Resolution Plan
Under Title I of the Dodd-Frank Wall Street Reform and Consumer Protection Act of 2010 (Dodd-Frank Act), Citigroup has developed a “single point of entry” resolution strategy and plan under the U.S. Bankruptcy Code. On July 1, 2017, Citi submitted its 2017 resolution plan to the Federal Reserve and FDIC. On December 19, 2017, the Federal Reserve and FDIC informed Citi that (i) the agencies jointly decided that Citi’s 2017 resolution plan submission satisfactorily addressed the shortcomings identified in the 2015 resolution plan submission, and (ii) the agencies together did not identify any shortcomings or deficiencies in the 2017 resolution plan submission. Citi’s next resolution plan submission is due July 1, 2019. For additional information on Citi’s resolution plan submissions, see “Risk Factors—Strategic Risks” above.
Under Citi’s resolution plan, only Citigroup, the parent holding company, would enter into bankruptcy, while Citigroup’s material legal entities (as defined in the public section of its 2017 resolution plan, which can be found on the Federal Reserve and FDIC websites) would remain operational and outside of any resolution or insolvency proceedings. Citigroup believes its resolution plan has been designed to minimize the risk of systemic impact to the U.S. and global financial systems, while maximizing the value of the bankruptcy estate for the benefit of Citigroup’s creditors, including its unsecured long-term debt holders. In addition, in line with the Federal Reserve’s final total loss-absorbing capacity (TLAC) rule, Citigroup believes it has developed the resolution plan so that Citigroup’s shareholders and unsecured creditors—including its unsecured long-term debt holders—bear any losses resulting from Citigroup’s bankruptcy.
In response to feedback received from the Federal Reserve and FDIC on Citigroup’s 2015 resolution plan, Citigroup took the following actions in connection with its 2017 resolution plan submission (which, as noted above, did not contain any shortcomings or deficiencies):
|
|
(i) |
Citicorp LLC (Citicorp), an existing wholly owned subsidiary of Citigroup, was established as an intermediate holding company (an IHC) for certain of Citigroup’s operating material legal entities; |
|
|
(ii) |
Citigroup executed an inter-affiliate agreement with Citicorp, Citigroup’s operating material legal entities and certain other affiliated entities pursuant to which Citicorp is required to provide liquidity and capital support to Citigroup’s operating material legal entities in the event Citigroup were to enter bankruptcy proceedings (Citi Support Agreement); |
|
|
(iii) |
pursuant to the Citi Support Agreement: |
|
|
• |
Citigroup made an initial contribution of assets, including certain high-quality liquid assets and inter-affiliate loans (Contributable Assets), to Citicorp, and Citicorp became the business as usual funding vehicle for Citigroup’s operating material legal entities; |
|
|
• |
Citigroup will be obligated to continue to transfer Contributable Assets to Citicorp over time, subject to certain amounts retained by Citigroup to, among |
other things, meet Citigroup’s near-term cash needs;
|
|
• |
in the event of a Citigroup bankruptcy, Citigroup will be required to contribute most of its remaining assets to Citicorp; and |
|
|
(iv) |
the obligations of both Citigroup and Citicorp under the Citi Support Agreement, as well as the Contributable Assets, are secured pursuant to a security agreement. |
The Citi Support Agreement provides two mechanisms, besides Citicorp’s issuing of dividends to Citigroup, pursuant to which Citicorp will be required to transfer cash to Citigroup during business as usual so that Citigroup can fund its debt service as well as other operating needs: (i) one or more funding notes issued by Citicorp to Citigroup and (ii) a committed line of credit under which Citicorp may make loans to Citigroup.
Total Loss-Absorbing Capacity (TLAC)
In 2016, the Federal Reserve Board released a final rule that imposes minimum external loss-absorbing capacity (TLAC) and long-term debt (LTD) requirements on U.S. global systemically important bank holding companies (GSIBs), including Citi. The intended purpose of the final rule is to facilitate the orderly resolution of U.S. GSIBs under the U.S. Bankruptcy Code and Title II of the Dodd-Frank Act. The effective date for all requirements under the final rule is January 1, 2019. While Citi believes that it meets the final minimum TLAC and LTD requirements as of December, 31, 2017, there are uncertainties regarding certain key aspects of the final rule. For additional information, see “Risk Factors—Compliance, Conduct and Legal Risks” above. For additional discussion of the method 1 and method 2 GSIB capital surcharge methodology, see “Capital Resources—Current Regulatory Capital Standards” above.
Under the Federal Reserve Board’s final rule, U.S. GSIBs will be required to maintain minimum levels of TLAC and eligible LTD, each set by reference to the GSIB’s consolidated risk-weighted assets (RWA) and total leverage exposure and as described further below.
Minimum TLAC Requirements
The minimum TLAC requirement is the greater of (i) 18% of the GSIB’s RWA plus the then-applicable RWA-based TLAC buffer (see below) and (ii) 7.5% of the GSIB’s total leverage exposure plus a leveraged-based TLAC buffer of 2% (i.e., 9.5%). The RWA-based TLAC buffer equals the 2.5% capital conservation buffer, plus any applicable countercyclical capital buffer (currently 0%), plus the GSIB’s capital surcharge as determined under method 1 of the GSIB surcharge rule (2.0% for Citi as of January 1, 2018). Accordingly, Citi estimates its total current minimum TLAC requirement is 22.5% of RWA under the final rule. Pursuant to the final rule, TLAC may generally only consist of the GSIB’s (i) Common Equity Tier 1 Capital and Additional Tier 1 Capital issued directly by the bank holding company (excluding qualifying trust preferred securities) plus (ii) eligible LTD (as discussed below). Breach of either the RWA-
or leveraged-based TLAC buffer would result in restrictions on distributions and discretionary bonus payments.
Minimum Eligible LTD Requirements
The minimum LTD requirement is the greater of (i) 6% of the GSIB’s RWA plus its capital surcharge as determined under method 2 of the GSIB surcharge rule (3.0% for Citi as of January 1, 2018), for a total current requirement of 9% of RWA for Citi, and (ii) 4.5% of the GSIB’s total leverage exposure.
Generally, under the final rule, eligible LTD is defined as the unpaid principal balance of unsecured, “plain vanilla” debt securities (i.e., would not include certain of Citi’s customer-related debt) issued directly by the bank holding company, governed by U.S. law, with a remaining maturity greater than one year and which provides for acceleration only upon the occurrence of insolvency or non-payment of principal or interest for 30 days or more. Further, pursuant to what has been referred to as the “haircut” provision, otherwise eligible LTD with a remaining maturity between one and two years is subject to a 50% haircut for purposes of meeting the minimum LTD requirement (although such LTD would continue to count at full value for purposes of the minimum TLAC requirement; eligible LTD with a remaining maturity of less than one year would not count toward either the minimum TLAC or eligible LTD requirement). The final rule provides that debt issued prior to December 31, 2016 with acceleration provisions other than those summarized above or governed by non-U.S. law is permanently grandfathered and may count as eligible LTD, assuming it otherwise meets the requirements of eligible LTD.
Clean Holding Company Requirements
The final rule prohibits or limits certain financial arrangements at the bank holding company level, or what are referred to as “clean holding company” requirements. Pursuant to these requirements, Citi, as the bank holding company, is prohibited from having certain types of third-party liabilities, including short-term debt, certain derivatives and other qualified financial contracts, liabilities guaranteed by a subsidiary (i.e., upstream guarantees) and guarantees of subsidiary liabilities or similar arrangements, if the liability or guarantee includes a default right linked to the insolvency of the bank holding company (i.e., downstream guarantees with cross default provisions). In addition, the final rule limits third-party, non-contingent liabilities of the bank holding company (other than those related to TLAC or eligible LTD) to 5% of the U.S. GSIB’s outstanding TLAC. Examples of the types of liabilities subject to this 5% limit include structured notes and various operating liabilities, such as rent and obligations to employees, as well as litigation and similar liabilities.
Secured Funding Transactions and Short-Term Borrowings
As referenced above, Citi supplements its primary sources of funding with short-term borrowings. Short-term borrowings generally include (i) secured funding transactions (securities loaned or sold under agreements to repurchase, or repos) and (ii) to a lesser extent, short-term borrowings consisting of commercial paper and borrowings from the FHLB and other market participants (see Note 17 to the Consolidated Financial Statements for further information on Citigroup’s and its affiliates’ outstanding short-term borrowings).
Outside of secured funding transactions, Citi’s short-term borrowings increased both year-over-year (a 45% increase) and sequentially (a 17% increase), driven by an increase in FHLB borrowing, as Citi continued to optimize liquidity across its legal vehicles.
Secured Funding
Secured funding is primarily accessed through Citi’s broker-dealer subsidiaries to fund efficiently both secured lending activity and a portion of securities inventory held in the context of market making and customer activities. Citi also executes a smaller portion of its secured funding transactions through its bank entities, which is typically collateralized by foreign government debt securities. Generally, daily changes in the level of Citi’s secured funding are primarily due to fluctuations in secured lending activity in the matched book (as described below) and securities inventory.
Secured funding of $156 billion as of December 31, 2017 increased 10% from the prior-year period and declined 3% sequentially. Excluding the impact of FX translation, secured funding increased 5% from the prior-year period and decreased 3% sequentially, both driven by normal business activity. Average balances for secured funding were approximately $163 billion for the quarter ended December 31, 2017.
The portion of secured funding in the broker-dealer subsidiaries that funds secured lending is commonly referred to as “matched book” activity. The majority of this activity is secured by high-quality liquid securities such as U.S. Treasury securities, U.S. agency securities and foreign government debt securities. Other secured funding is secured by less-liquid securities, including equity securities, corporate bonds and asset-backed securities. The tenor of Citi’s matched book liabilities is generally equal to or longer than the tenor of the corresponding matched book assets.
The remainder of the secured funding activity in the broker-dealer subsidiaries serves to fund securities inventory held in the context of market making and customer activities. To maintain reliable funding under a wide range of market conditions, including under periods of stress, Citi manages these activities by taking into consideration the quality of the underlying collateral, and stipulating financing tenor. The weighted average maturity of Citi’s secured funding of less-liquid securities inventory was greater than 110 days as of December 31, 2017.
Citi manages the risks in its secured funding by conducting daily stress tests to account for changes in capacity, tenors, haircut, collateral profile and client actions.
Additionally, Citi maintains counterparty diversification by establishing concentration triggers and assessing counterparty reliability and stability under stress. Citi generally sources secured funding from more than 150 counterparties.
Overall Short-Term Borrowings
The following table contains the year-end, average and maximum month-end amounts for the following respective short-term borrowings categories at the end of each of the three prior fiscal years:
|
|
|
|
|
|
|
|
|
|
|
|
|
|
|
|
|
|
|
|
|
|
|
|
|
|
|
|
|
|
Federal funds purchased and securities sold under
agreements to repurchase
|
Short-term borrowings(1)
|
Commercial paper(2)
|
Other short-term borrowings(3)
|
In billions of dollars |
2017 |
2016 |
2015 |
2017 |
2016 |
2015 |
2017 |
2016 |
2015 |
Amounts outstanding at year end |
$ |
156.3 |
|
$ |
141.8 |
|
$ |
146.5 |
|
$ |
9.9 |
|
$ |
10.0 |
|
$ |
10.0 |
|
$ |
34.5 |
|
$ |
20.7 |
|
$ |
11.1 |
|
Average outstanding during the year(4)(5)
|
157.7 |
|
158.1 |
|
174.5 |
|
10.0 |
|
10.0 |
|
10.7 |
|
23.2 |
|
14.8 |
|
22.2 |
|
Maximum month-end outstanding |
163.0 |
|
171.7 |
|
186.2 |
|
10.1 |
|
10.2 |
|
15.3 |
|
34.5 |
|
20.9 |
|
41.9 |
|
Weighted-average interest rate |
|
|
|
|
|
|
|
|
|
During the year(4)(5)(6)
|
1.69 |
% |
1.21 |
% |
0.92 |
% |
1.27 |
% |
0.80 |
% |
0.36 |
% |
2.81 |
% |
2.32 |
% |
1.40 |
% |
At year end(7)
|
1.02 |
|
0.63 |
|
0.59 |
|
1.28 |
|
0.79 |
|
0.22 |
|
1.62 |
|
1.39 |
|
1.50 |
|
|
|
(1) |
Original maturities of less than one year. |
|
|
(2) |
Substantially all commercial paper outstanding was issued by certain Citibank entities for the periods presented. |
|
|
(3) |
Other short-term borrowings include borrowings from the FHLB and other market participants. |
|
|
(4) |
Interest rates and amounts include the effects of risk management activities associated with the respective liability categories. |
|
|
(5) |
Average volumes of securities loaned or sold under agreements to repurchase are reported net pursuant to ASC 210-20-45; average rates exclude the impact of ASC 210-20-45. |
|
|
(6) |
Average rates reflect prevailing local interest rates, including inflationary effects and monetary correction in certain countries. |
|
|
(7) |
Based on contractual rates at respective year ends; non-interest-bearing accounts are excluded from the weighted average interest rate calculated at year end. |
Liquidity Monitoring and Measurement
Stress Testing
Liquidity stress testing is performed for each of Citi’s major entities, operating subsidiaries and/or countries. Stress testing and scenario analyses are intended to quantify the potential impact of an adverse liquidity event on the balance sheet and liquidity position, and to identify viable funding alternatives that can be utilized. These scenarios include assumptions about significant changes in key funding sources, market triggers (such as credit ratings), potential uses of funding and geopolitical and macroeconomic conditions. These conditions include expected and stressed market conditions as well as Company-specific events.
Liquidity stress tests are conducted to ascertain potential mismatches between liquidity sources and uses over a variety of time horizons and over different stressed conditions. Liquidity limits are set accordingly. To monitor the liquidity of an entity, these stress tests and potential mismatches are calculated with varying frequencies, with several tests performed daily.
Given the range of potential stresses, Citi maintains contingency funding plans on a consolidated basis and for individual entities. These plans specify a wide range of readily available actions for a variety of adverse market conditions or idiosyncratic stresses.
Short-Term Liquidity Measurement: Liquidity Coverage Ratio (LCR)
In addition to internal liquidity stress metrics that Citi has developed for a 30-day stress scenario, Citi also monitors its liquidity by reference to the LCR, as calculated pursuant to the U.S. LCR rules.
Generally, the LCR is designed to ensure that banks maintain an adequate level of HQLA to meet liquidity needs under an acute 30-day stress scenario. The LCR is calculated by dividing HQLA by estimated net outflows over a stressed 30-day period, with the net outflows determined by applying prescribed outflow factors to various categories of liabilities, such as deposits, unsecured and secured wholesale borrowings, unused lending commitments and derivatives-related exposures, partially offset by inflows from assets maturing within 30 days. Banks are required to calculate an add-on to address potential maturity mismatches between contractual cash outflows and inflows within the 30-day period in determining the total amount of net outflows. The minimum LCR requirement is 100%, effective January 2017.
Pursuant to the Federal Reserve Board’s final rule regarding LCR disclosures, effective April 1, 2017, Citi began to disclose LCR in the prescribed format.
The table below sets forth the components of Citi’s LCR calculation and HQLA in excess of net outflows for the periods indicated:
|
|
|
|
|
|
|
|
|
|
|
In billions of dollars |
Dec. 31, 2017 |
Sept. 30, 2017 |
Dec. 31, 2016 |
HQLA |
$ |
446.4 |
|
$ |
448.6 |
|
$ |
403.7 |
|
Net outflows |
364.3 |
|
365.1 |
|
332.5 |
|
LCR |
123 |
% |
123 |
% |
121 |
% |
HQLA in excess of net outflows |
$ |
82.1 |
|
$ |
83.5 |
|
$ |
71.3 |
|
Note: Amounts set forth in the table above are presented on an average basis.
As set forth in the table above, Citi’s LCR increased year-over-year, as the increase in the HQLA (as discussed above) more than offset an increase in modeled net outflows. The increase in modeled net outflows was primarily driven by changes in assumptions, including changes in methodology to better align Citi’s outflow assumptions with those embedded in its resolution planning. Sequentially, Citi’s LCR remained unchanged.
Long-Term Liquidity Measurement: Net Stable Funding Ratio (NSFR)
In 2016, the Federal Reserve Board, the FDIC and the OCC issued a proposed rule to implement the Basel III NSFR requirement.
The U.S.-proposed NSFR is largely consistent with the Basel Committee’s final NSFR rules. In general, the NSFR assesses the availability of a bank’s stable funding against a required level. A bank’s available stable funding would include portions of equity, deposits and long-term debt, while its required stable funding would be based on the liquidity characteristics of its assets, derivatives and commitments. Prescribed factors would be required to be applied to the various categories of asset and liabilities classes. The ratio of available stable funding to required stable funding would be required to be greater than 100%. While Citi believes that it is compliant with the proposed U.S. NSFR rules as of December 31, 2017, it will need to evaluate a final version of the rules, which are expected to be released during 2018. Citi expects that the NSFR final rules implementation period will be communicated along with the final version of the rules.
Credit Ratings
Citigroup’s funding and liquidity, funding capacity, ability to access capital markets and other sources of funds, the cost of these funds and its ability to maintain certain deposits are partially dependent on its credit ratings.
The table below sets forth the ratings for Citigroup and Citibank as of December 31, 2017. While not included in the table below, the long-term and short-term ratings of Citigroup Global Markets Inc. (CGMI) were “A2/P-1” at Moody’s, “A+/A-1” at Standard & Poor’s and “A+/F1” at Fitch as of December 31, 2017. The long-term and short-term ratings of CGMHI were “BBB+/A-2” at Standard & Poor’s and “A/F1” at Fitch as of December 31, 2017.
|
|
|
|
|
|
|
|
|
Citigroup Inc. |
Citibank, N.A. |
|
Senior
debt
|
Commercial
paper
|
Outlook |
Long-
term
|
Short-
term
|
Outlook |
Fitch Ratings (Fitch) |
A |
F1 |
Stable |
A+ |
F1 |
Stable |
Moody’s Investors Service (Moody’s) |
Baa1 |
P-2 |
Positive |
A1 |
P-1 |
Positive |
Standard & Poor’s (S&P) |
BBB+ |
A-2 |
Stable |
A+ |
A-1 |
Stable |
Recent Credit Rating Developments
As of November 14, 2017, Moody's Investors Service has placed Citi on "Positive" outlook, citing Citi’s durable business model with a narrower geographic footprint and refined customer base targets, and the ability to demonstrate a strengthened risk asset profile as well as improved earnings stability.
Potential Impacts of Ratings Downgrades
Ratings downgrades by Moody’s, Fitch or S&P could negatively impact Citigroup’s and/or Citibank’s funding and liquidity due to reduced funding capacity, including derivatives triggers, which could take the form of cash obligations and collateral requirements.
The following information is provided for the purpose of analyzing the potential funding and liquidity impact to Citigroup and Citibank of a hypothetical, simultaneous
ratings downgrade across all three major rating agencies. This analysis is subject to certain estimates, estimation methodologies, judgments and uncertainties. Uncertainties include potential ratings limitations that certain entities may have with respect to permissible counterparties, as well as general subjective counterparty behavior. For example, certain corporate customers and markets counterparties could re-evaluate their business relationships with Citi and limit transactions in certain contracts or market instruments with Citi. Changes in counterparty behavior could impact Citi’s funding and liquidity, as well as the results of operations of certain of its businesses. The actual impact to Citigroup or Citibank is unpredictable and may differ materially from the potential funding and liquidity impacts described below. For additional information on the impact of credit rating changes on Citi and its applicable subsidiaries, see “Risk Factors—Liquidity Risks” above.
Citigroup Inc. and Citibank—Potential Derivative Triggers
As of December 31, 2017, Citi estimates that a hypothetical one-notch downgrade of the senior debt/long-term rating of Citigroup Inc. across all three major rating agencies could impact Citigroup’s funding and liquidity due to derivative triggers by approximately $0.8 billion, compared to $1.0 billion as of September 30, 2017. Other funding sources, such as securities financing transactions and other margin requirements, for which there are no explicit triggers, could also be adversely affected.
As of December 31, 2017, Citi estimates that a hypothetical one-notch downgrade of the senior debt/long-term rating of Citibank across all three major rating agencies could impact Citibank’s funding and liquidity by approximately $0.4 billion, compared to $0.5 billion as of September 30, 2017, due to derivative triggers.
In total, Citi estimates that a one-notch downgrade of Citigroup and Citibank, across all three major rating agencies, could result in increased aggregate cash obligations and collateral requirements of approximately $1.2 billion, compared to $1.5 billion as of September 30, 2017 (see also Note 22 to the Consolidated Financial Statements). As set forth under “High-Quality Liquid Assets” above, the liquidity resources of Citibank were approximately $369 billion and the liquidity resources of Citi’s non-bank and other entities were approximately $77 billion, for a total of approximately $446 billion as of December 31, 2017. These liquidity resources are available in part as a contingency for the potential events described above.
In addition, a broad range of mitigating actions are currently included in Citigroup’s and Citibank’s contingency funding plans. For Citigroup, these mitigating factors include, but are not limited to, accessing surplus funding capacity from existing clients, tailoring levels of secured lending and adjusting the size of select trading books and collateralized borrowings from certain Citibank subsidiaries. Mitigating
actions available to Citibank include, but are not limited to, selling or financing highly liquid government securities, tailoring levels of secured lending, adjusting the size of select trading assets, reducing loan originations and renewals, raising additional deposits or borrowing from the FHLB or central banks. Citi believes these mitigating actions could substantially reduce the funding and liquidity risk, if any, of the potential downgrades described above.
Citibank—Additional Potential Impacts
In addition to the above derivative triggers, Citi believes that a potential one-notch downgrade of Citibank’s senior debt/long-term rating by S&P could also have an adverse impact on the commercial paper/short-term rating of Citibank. As of December 31, 2017, Citibank had liquidity commitments of approximately $9.9 billion to consolidated asset-backed commercial paper conduits, compared to $10.0 billion as of September 30, 2017 (as referenced in Note 21 to the Consolidated Financial Statements).
In addition to the above-referenced liquidity resources of certain Citibank and Citibanamex entities, Citibank could reduce the funding and liquidity risk, if any, of the potential downgrades described above through mitigating actions, including repricing or reducing certain commitments to commercial paper conduits. In the event of the potential downgrades described above, Citi believes that certain corporate customers could re-evaluate their deposit relationships with Citibank. This re-evaluation could result in clients adjusting their discretionary deposit levels or changing their depository institution, which could potentially reduce certain deposit levels at Citibank. However, Citi could choose to adjust pricing, offer alternative deposit products to its existing customers or seek to attract deposits from new customers, in addition to the mitigating actions referenced above.
MARKET RISK
Overview
Market risk is the potential for losses arising from changes in the value of Citi’s assets and liabilities resulting from changes in market variables such as interest rates, foreign exchange rates, equity prices, commodity prices and credit spreads, as well as their implied volatilities.
Each business is required to establish, with approval from Citi’s market risk management, a market risk limit framework for identified risk factors that clearly defines approved risk profiles and is within the parameters of Citi’s overall risk appetite. These limits are monitored by the Risk organization, Citi’s country and business Asset and Liability Committees and the Citigroup Asset and Liability Committee. In all cases, the businesses are ultimately responsible for the market risks taken and for remaining within their defined limits.
Market risk emanates from both Citi’s trading and non-trading portfolios. Trading portfolios comprise all assets and liabilities marked-to-market, with results reflected in earnings. Non-trading portfolios include all other assets and liabilities.
Market Risk of Non-Trading Portfolios
Market risk from non-trading portfolios stems from the potential impact of changes in interest rates and foreign exchange rates on Citi’s net interest revenues, the changes in Accumulated other comprehensive income (loss) (AOCI) from its investment portfolios and capital invested in foreign currencies.
Net Interest Revenue at Risk
Net interest revenue, for interest rate exposure purposes, is the difference between the yield earned on the non-trading portfolio assets (including customer loans) and the rate paid on the liabilities (including customer deposits or company borrowings). Net interest revenue is affected by changes in the level of interest rates, as well as the amounts and mix of assets and liabilities, and the timing of contractual and assumed repricing of assets and liabilities to reflect market rates.
Citi’s principal measure of risk to net interest revenue is interest rate exposure (IRE). IRE measures the change in expected net interest revenue in each currency resulting solely from unanticipated changes in forward interest rates.
Citi’s estimated IRE incorporates various assumptions including prepayment rates on loans, customer behavior and the impact of pricing decisions. For example, in rising interest rate scenarios, portions of the deposit portfolio may be assumed to experience rate increases that are less than the change in market interest rates. In declining interest rate scenarios, it is assumed that mortgage portfolios experience higher prepayment rates. IRE assumes that businesses and/or Citi Treasury make no additional changes in balances or positioning in response to the unanticipated rate changes.
In order to manage changes in interest rates effectively, Citi may modify pricing on new customer loans and deposits, purchase fixed-rate securities, issue debt that is either fixed or floating or enter into derivative transactions that have the opposite risk exposures. Citi regularly assesses the viability of these and other strategies to reduce its interest rate risks and
implements such strategies when it believes those actions are prudent.
Citi manages interest rate risk as a consolidated company-wide position. Citi’s client-facing businesses create interest-rate sensitive positions, including loans and deposits, as part of their ongoing activities. Citi Treasury aggregates these risk positions and manages them centrally. Operating within established limits, Citi Treasury makes positioning decisions and uses tools, such as Citi’s investment securities portfolio, company-issued debt and interest rate derivatives, to target the desired risk profile. Changes in Citi’s interest rate risk position reflect the accumulated changes in all non-trading assets and liabilities, with potentially large and offsetting impacts, as well as in Citi Treasury’s positioning decisions.
Citigroup employs additional measurements, including stress testing the impact of non-linear interest rate movements on the value of the balance sheet; the analysis of portfolio duration and volatility, particularly as they relate to mortgage loans and mortgage-backed securities; and the potential impact of the change in the spread between different market indices.
Interest Rate Risk of Investment Portfolios—Impact on AOCI
Citi also measures the potential impacts of changes in interest rates on the value of its AOCI, which can in turn impact Citi’s common equity and tangible common equity. This will impact Citi’s Common Equity Tier 1 and other regulatory capital ratios. Citi’s goal is to benefit from an increase in the market level of interest rates, while limiting the impact of changes in AOCI on its regulatory capital position.
AOCI at risk is managed as part of the company-wide interest rate risk position. AOCI at risk considers potential changes in AOCI (and the corresponding impact on the Common Equity Tier 1 Capital ratio) relative to Citi’s capital generation capacity.
The following table sets forth the estimated impact to Citi’s net interest revenue, AOCI and the Common Equity Tier 1 Capital ratio (on a fully implemented basis), each assuming an unanticipated parallel instantaneous 100 bps increase in interest rates:
|
|
|
|
|
|
|
|
|
|
|
In millions of dollars (unless otherwise noted) |
Dec. 31, 2017 |
Sept. 30, 2017 |
Dec. 31, 2016 |
Estimated annualized impact to net interest revenue |
|
|
|
U.S. dollar(1)
|
$ |
1,471 |
|
$ |
1,449 |
|
$ |
1,586 |
|
All other currencies |
598 |
|
610 |
|
550 |
|
Total |
$ |
2,069 |
|
$ |
2,059 |
|
$ |
2,136 |
|
As a percentage of average interest-earning assets |
0.12 |
% |
0.12 |
% |
0.13 |
% |
Estimated initial impact to AOCI (after-tax)(2)(3)
|
$ |
(4,853 |
) |
$ |
(4,206 |
) |
$ |
(4,617 |
) |
Estimated initial impact on Common Equity Tier 1 Capital ratio (bps)(3)
|
(35 |
) |
(48 |
) |
(53 |
) |
|
|
(1) |
Certain trading-oriented businesses within Citi have accrual-accounted positions that are excluded from the estimated impact to net interest revenue in the table since these exposures are managed economically in combination with mark-to-market positions. The U.S. dollar interest rate exposure associated with these businesses was $(182) million for a 100 bps instantaneous increase in interest rates as of December 31, 2017. |
|
|
(2) |
Includes the effect of changes in interest rates on AOCI related to investment securities, cash flow hedges and pension liability adjustments. |
|
|
(3) |
Results as of December 31, 2017 reflect the impact of Tax Reform, including the lower expected effective tax rate and the impact to Citi’s DTA position. Prior periods have not been restated. The estimated initial impact on Common Equity Tier I Capital ratio (bps) is calculated on a pre-tax basis prior to December 31, 2017. |
The 2017 decrease in the estimated impact to net interest revenue primarily reflected changes in Citi’s balance sheet composition, including increases in loan balances and increased sensitivity in deposits, net of Citi Treasury positioning. The 2017 changes in the estimated impact to AOCI and the Common Equity Tier 1 Capital ratio primarily reflected the impact of Tax Reform, including the lower expected effective tax rate and the impact to Citi’s DTA position, net of changes in the composition of Citi Treasury’s investment and derivatives portfolio.
In the event of an unanticipated parallel instantaneous 100 bps increase in interest rates, Citi expects that the negative impact to AOCI would be offset in shareholders’ equity through the combination of expected incremental net interest
revenue and the expected recovery of the impact on AOCI through accretion of Citi’s investment portfolio over a period of time. As of December 31, 2017, Citi expects that the negative $4.9 billion impact to AOCI in such a scenario could potentially be offset over approximately 21 months.
The following table sets forth the estimated impact to Citi’s net interest revenue, AOCI and the Common Equity Tier 1 Capital ratio (on a fully implemented basis) under four different changes in interest rate scenarios for the U.S. dollar and Citi’s other currencies. While Citi also monitors the impact of a parallel decrease in interest rates, a 100 bps decrease in short-term rates is not meaningful, as it would imply negative interest rates in many of Citi’s markets.
|
|
|
|
|
|
|
|
|
|
|
|
|
|
In millions of dollars (unless otherwise noted) |
Scenario 1 |
Scenario 2 |
Scenario 3 |
Scenario 4 |
Overnight rate change (bps) |
100 |
|
100 |
|
— |
|
— |
|
10-year rate change (bps) |
100 |
|
— |
|
100 |
|
(100 |
) |
Estimated annualized impact to net interest revenue
|
|
|
|
|
U.S. dollar |
$ |
1,471 |
|
$ |
1,377 |
|
$ |
86 |
|
$ |
(102 |
) |
All other currencies |
598 |
|
558 |
|
35 |
|
(35 |
) |
Total |
$ |
2,069 |
|
$ |
1,935 |
|
$ |
121 |
|
$ |
(137 |
) |
Estimated initial impact to AOCI (after-tax)(1)
|
$ |
(4,853 |
) |
$ |
(3,046 |
) |
$ |
(2,010 |
) |
$ |
1,484 |
|
Estimated initial impact to Common Equity Tier 1 Capital ratio (bps)(2)
|
(35 |
) |
(22 |
) |
(15 |
) |
11 |
|
Note: Each scenario in the table above assumes that the rate change will occur instantaneously. Changes in interest rates for maturities between the overnight rate and the 10-year rate are interpolated.
|
|
(1) |
Includes the effect of changes in interest rates on AOCI related to investment securities, cash flow hedges and pension liability adjustments. |
|
|
(2) |
Results as of December 31, 2017 reflect the impact of Tax Reform, including the lower expected effective tax rate and the impact to Citi’s DTA position. |
As shown in the table above, the magnitude of the impact to Citi’s net interest revenue and AOCI is greater under scenario 2 as compared to scenario 3. This is because the combination of changes to Citi’s investment portfolio, partially offset by changes related to Citi’s pension liabilities, results in a net position that is more sensitive to rates at shorter and intermediate term maturities.
Changes in Foreign Exchange Rates—Impacts on AOCI and Capital
As of December 31, 2017, Citi estimates that an unanticipated parallel instantaneous 5% appreciation of the U.S. dollar against all of the other currencies in which Citi has invested capital could reduce Citi’s tangible common equity (TCE) by approximately $1.6 billion, or 1.0%, as a result of changes to Citi’s foreign currency translation adjustment in AOCI, net of hedges. This impact would be primarily due to changes in the value of the Mexican peso, the Euro and the British pound sterling.
This impact is also before any mitigating actions Citi may take, including ongoing management of its foreign currency translation exposure. Specifically, as currency movements change the value of Citi’s net investments in foreign currency-denominated capital, these movements also change the value of Citi’s risk-weighted assets denominated in those currencies. This, coupled with Citi’s foreign currency hedging strategies, such as foreign currency borrowings, foreign currency forwards and other currency hedging instruments, lessens the impact of foreign currency movements on Citi’s Common Equity Tier 1 Capital ratio. Changes in these hedging strategies, as well as hedging costs, divestitures and tax impacts, can further affect the actual impact of changes in foreign exchange rates on Citi’s capital as compared to an unanticipated parallel shock, as described above.
The effect of Citi’s ongoing management strategies with respect to changes in foreign exchange rates and the impact of these changes on Citi’s TCE and Common Equity Tier 1 Capital ratio are shown in the table below. For additional information on the changes in AOCI, see Note 19 to the Consolidated Financial Statements.
|
|
|
|
|
|
|
|
|
|
|
|
For the quarter ended |
In millions of dollars (unless otherwise noted) |
Dec. 31, 2017 |
Sept. 30, 2017 |
Dec. 31, 2016 |
Change in FX spot rate(1)
|
(1.2 |
)% |
1.1 |
% |
(5.2 |
)% |
Change in TCE due to FX translation, net of hedges |
$ |
(498 |
) |
$ |
222 |
|
$ |
(1,668 |
) |
As a percentage of TCE |
(0.3 |
)% |
0.1 |
% |
(0.9 |
)% |
|
Estimated impact to Common Equity Tier 1 Capital ratio (on a fully implemented basis) due
to changes in FX translation, net of hedges (bps)
|
(5 |
) |
(3 |
) |
— |
|
|
|
(1) |
FX spot rate change is a weighted average based upon Citi’s quarterly average GAAP capital exposure to foreign countries. |
Interest Revenue/Expense and Net Interest Margin
|
|
|
|
|
|
|
|
|
|
|
|
|
|
|
|
|
|
|
|
In millions of dollars, except as otherwise noted |
2017 |
|
2016 |
|
2015 |
|
Change
2017 vs. 2016 |
|
Change
2016 vs. 2015 |
|
Interest revenue(1)
|
$ |
61,700 |
|
|
$ |
58,077 |
|
|
$ |
59,040 |
|
|
6 |
% |
|
(2 |
)% |
|
Interest expense (2)
|
16,517 |
|
|
12,511 |
|
|
11,921 |
|
|
32 |
|
|
5 |
|
|
Net interest revenue |
$ |
45,183 |
|
|
$ |
45,566 |
|
|
$ |
47,119 |
|
|
(1 |
)% |
|
(3 |
)% |
|
Interest revenue—average rate |
3.69 |
% |
|
3.64 |
% |
|
3.68 |
% |
|
5 |
|
bps |
(4 |
) |
bps |
Interest expense—average rate |
1.28 |
|
|
1.03 |
|
|
0.95 |
|
|
25 |
|
bps |
8 |
|
bps |
Net interest margin (3)
|
2.70 |
|
|
2.86 |
|
|
2.93 |
|
|
(16 |
) |
bps |
(7 |
) |
bps |
Interest rate benchmarks |
|
|
|
|
|
|
|
|
|
|
Two-year U.S. Treasury note—average rate |
1.40 |
% |
|
0.83 |
% |
|
0.69 |
% |
|
57 |
|
bps |
14 |
|
bps |
10-year U.S. Treasury note—average rate |
2.33 |
|
|
1.83 |
|
|
2.14 |
|
|
50 |
|
bps |
(31 |
) |
bps |
10-year vs. two-year spread |
93 |
|
bps |
100 |
|
bps |
145 |
|
bps |
|
|
|
|
|
Note: All interest expense amounts include FDIC deposit insurance assessments.
|
|
(1) |
Net interest revenue includes the taxable equivalent adjustments related to the tax-exempt bond portfolio (based on the U.S. federal statutory tax rate of 35%) of $496 million, $462 million and $489 million for 2017, 2016 and 2015, respectively.
|
|
|
(2) |
Interest expense associated with certain hybrid financial instruments, which are classified as Long-term debt and accounted for at fair value, is reported together
|
with any changes in fair value as part of Principal transactions in the Consolidated Statements of Income and is therefore not reflected in Interest expense in the
table above.
(3) Citi’s net interest margin (NIM) is calculated by dividing gross interest revenue less gross interest expense by average interest-earning assets.
Citi’s net interest revenue in the fourth quarter of 2017 remained largely unchanged versus the prior-year period at $11.2 billion ($11.4 billion on a taxable equivalent basis). Excluding the impact of FX translation, Citi’s net interest revenue was down slightly versus the prior-year period (down $50 million), as higher core accrual net interest revenue ($10.4 billion, up approximately 5% or $0.5 billion) was offset by lower trading-related net interest revenue ($0.5 billion, down approximately 46% or $0.4 billion) and lower net interest revenue associated with legacy assets in Corporate/Other ($0.3 billion, down approximately 34% or $0.1 billion). The increase in core accrual net interest revenue was driven mainly by the benefit of the December 2016, March 2017 and June 2017 interest rate increases and volume growth.
Citi’s net interest revenue for the full-year remained largely unchanged versus the prior-year at $44.7 billion ($45.2 billion on a taxable equivalent basis). Excluding the impact of FX translation, Citi’s net interest revenue declined by approximately $0.5 billion, as higher core accrual net interest revenue (approximately $40.5 billion, up 5%, or $2.0 billion) was offset by lower trading-related net interest revenue (approximately $2.9 billion, down 37%, or $1.7 billion), largely driven by higher wholesale funding costs, and lower net interest revenue associated with legacy assets in Corporate/Other (approximately $1.2 billion, down 40%, or $0.8 billion). The increase in core accrual net interest revenue was primarily due to the benefit of the interest rate increases and volume growth.
Citi’s NIM was 2.63% on a taxable equivalent basis in the fourth quarter of 2017, a decrease of 9 bps from the third quarter of 2017, driven primarily by lower trading-related NIM. On a full-year basis, Citi’s NIM was 2.70% on a taxable equivalent basis, compared to 2.86% in 2016, a decrease of 16 bps. Citi’s full-year core accrual NIM was 3.45%, a decline of 5 bps from the prior year, as higher core accrual net interest revenue was more than offset by balance sheet growth. (Citi’s core accrual net interest revenue and core accrual NIM are non-GAAP financial measures. Citi believes these measures provide a more meaningful depiction for investors of the underlying fundamentals of its business results.)
Additional Interest Rate Details
Average Balances and Interest Rates—Assets(1)(2)(3)(4)
|
|
|
|
|
|
|
|
|
|
|
|
|
|
|
|
|
|
|
|
|
|
|
|
|
|
|
Average volume |
Interest revenue |
% Average rate |
In millions of dollars, except rates |
2017 |
2016 |
2015 |
2017 |
2016 |
2015 |
2017 |
2016 |
2015 |
Assets |
|
|
|
|
|
|
|
|
|
Deposits with banks(5)
|
$ |
169,385 |
|
$ |
131,925 |
|
$ |
133,853 |
|
$ |
1,635 |
|
$ |
971 |
|
$ |
727 |
|
0.97 |
% |
0.74 |
% |
0.54 |
% |
Federal funds sold and securities borrowed or purchased under agreements to resell(6)
|
|
|
|
|
|
|
|
|
|
In U.S. offices |
$ |
141,308 |
|
$ |
147,734 |
|
$ |
150,340 |
|
$ |
1,922 |
|
$ |
1,483 |
|
$ |
1,215 |
|
1.36 |
% |
1.00 |
% |
0.81 |
% |
In offices outside the U.S.(5)
|
106,605 |
|
85,142 |
|
84,013 |
|
1,326 |
|
1,060 |
|
1,301 |
|
1.24 |
|
1.24 |
|
1.55 |
|
Total |
$ |
247,913 |
|
$ |
232,876 |
|
$ |
234,353 |
|
$ |
3,248 |
|
$ |
2,543 |
|
$ |
2,516 |
|
1.31 |
% |
1.09 |
% |
1.07 |
% |
Trading account assets(7)(8)
|
|
|
|
|
|
|
|
|
|
In U.S. offices |
$ |
99,755 |
|
$ |
103,610 |
|
$ |
113,475 |
|
$ |
3,531 |
|
$ |
3,791 |
|
$ |
3,945 |
|
3.54 |
% |
3.66 |
% |
3.48 |
% |
In offices outside the U.S.(5)
|
104,196 |
|
94,603 |
|
96,333 |
|
2,117 |
|
2,095 |
|
2,140 |
|
2.03 |
|
2.21 |
|
2.22 |
|
Total |
$ |
203,951 |
|
$ |
198,213 |
|
$ |
209,808 |
|
$ |
5,648 |
|
$ |
5,886 |
|
$ |
6,085 |
|
2.77 |
% |
2.97 |
% |
2.90 |
% |
Investments |
|
|
|
|
|
|
|
|
|
In U.S. offices |
|
|
|
|
|
|
|
|
|
Taxable |
$ |
226,227 |
|
$ |
225,764 |
|
$ |
214,683 |
|
$ |
4,450 |
|
$ |
3,980 |
|
$ |
3,812 |
|
1.97 |
% |
1.76 |
% |
1.78 |
% |
Exempt from U.S. income tax |
18,152 |
|
19,079 |
|
20,034 |
|
775 |
|
693 |
|
443 |
|
4.27 |
|
3.63 |
|
2.21 |
|
In offices outside the U.S.(5)
|
106,040 |
|
106,159 |
|
102,374 |
|
3,309 |
|
3,157 |
|
3,071 |
|
3.12 |
|
2.97 |
|
3.00 |
|
Total |
$ |
350,419 |
|
$ |
351,002 |
|
$ |
337,091 |
|
$ |
8,534 |
|
$ |
7,830 |
|
$ |
7,326 |
|
2.44 |
% |
2.23 |
% |
2.17 |
% |
Loans (net of unearned income)(9)
|
|
|
|
|
|
|
|
|
|
In U.S. offices |
$ |
371,711 |
|
$ |
360,957 |
|
$ |
354,434 |
|
$ |
25,943 |
|
$ |
24,240 |
|
$ |
25,082 |
|
6.98 |
% |
6.72 |
% |
7.08 |
% |
In offices outside the U.S.(5)
|
267,774 |
|
262,715 |
|
273,064 |
|
15,529 |
|
15,578 |
|
15,465 |
|
5.80 |
|
5.93 |
|
5.66 |
|
Total |
$ |
639,485 |
|
$ |
623,672 |
|
$ |
627,498 |
|
$ |
41,472 |
|
$ |
39,818 |
|
$ |
40,547 |
|
6.49 |
% |
6.38 |
% |
6.46 |
% |
Other interest-earning assets(10)
|
$ |
60,628 |
|
$ |
56,398 |
|
$ |
63,209 |
|
$ |
1,163 |
|
$ |
1,029 |
|
$ |
1,839 |
|
1.92 |
% |
1.82 |
% |
2.91 |
% |
Total interest-earning assets |
$ |
1,671,781 |
|
$ |
1,594,086 |
|
$ |
1,605,812 |
|
$ |
61,700 |
|
$ |
58,077 |
|
$ |
59,040 |
|
3.69 |
% |
3.64 |
% |
3.68 |
% |
Non-interest-earning assets(7)
|
$ |
203,657 |
|
$ |
214,642 |
|
$ |
218,025 |
|
|
|
|
|
|
|
Total assets |
$ |
1,875,438 |
|
$ |
1,808,728 |
|
$ |
1,823,837 |
|
|
|
|
|
|
|
|
|
(1) |
Net interest revenue includes the taxable equivalent adjustments related to the tax-exempt bond portfolio (based on the U.S. federal statutory tax rate of 35%) of $496 million, $462 million and $489 million for 2017, 2016 and 2015, respectively.
|
|
|
(2) |
Interest rates and amounts include the effects of risk management activities associated with the respective asset categories. |
|
|
(3) |
Monthly or quarterly averages have been used by certain subsidiaries where daily averages are unavailable. |
|
|
(4) |
Detailed average volume, Interest revenue and Interest expense exclude Discontinued operations. See Note 2 to the Consolidated Financial Statements.
|
|
|
(5) |
Average rates reflect prevailing local interest rates, including inflationary effects and monetary corrections in certain countries. |
|
|
(6) |
Average volumes of securities borrowed or purchased under agreements to resell are reported net pursuant to ASC 210-20-45. However, Interest revenue excludes the impact of ASC 210-20-45.
|
|
|
(7) |
The fair value carrying amounts of derivative contracts are reported net, pursuant to ASC 815-10-45, in Non-interest-earning assets and Other non-interest-bearing liabilities.
|
|
|
(8) |
Interest expense on Trading account liabilities of ICG is reported as a reduction of Interest revenue. Interest revenue and Interest expense on cash collateral positions are reported in interest on Trading account assets and Trading account liabilities, respectively.
|
|
|
(9) |
Includes cash-basis loans. |
|
|
(10) |
Includes brokerage receivables. |
Average Balances and Interest Rates—Liabilities and Equity, and Net Interest Revenue(1)(2)(3)(4)
|
|
|
|
|
|
|
|
|
|
|
|
|
|
|
|
|
|
|
|
|
|
|
|
|
|
|
Average volume |
Interest expense |
% Average rate |
In millions of dollars, except rates |
2017 |
2016 |
2015 |
2017 |
2016 |
2015 |
2017 |
2016 |
2015 |
Liabilities |
|
|
|
|
|
|
|
|
|
Deposits |
|
|
|
|
|
|
|
|
|
In U.S. offices(5)
|
$ |
313,094 |
|
$ |
288,817 |
|
$ |
273,135 |
|
$ |
2,530 |
|
$ |
1,630 |
|
$ |
1,291 |
|
0.81 |
% |
0.56 |
% |
0.47 |
% |
In offices outside the U.S.(6)
|
436,949 |
|
429,608 |
|
425,086 |
|
4,056 |
|
3,670 |
|
3,761 |
|
0.93 |
|
0.85 |
|
0.88 |
|
Total |
$ |
750,043 |
|
$ |
718,425 |
|
$ |
698,221 |
|
$ |
6,586 |
|
$ |
5,300 |
|
$ |
5,052 |
|
0.88 |
% |
0.74 |
% |
0.72 |
% |
Federal funds purchased and securities loaned or sold under agreements to repurchase(7)
|
|
|
|
|
|
|
|
|
|
In U.S. offices |
$ |
96,258 |
|
$ |
100,472 |
|
$ |
108,320 |
|
$ |
1,574 |
|
$ |
1,024 |
|
$ |
614 |
|
1.64 |
% |
1.02 |
% |
0.57 |
% |
In offices outside the U.S.(6)
|
61,434 |
|
57,588 |
|
66,197 |
|
1,087 |
|
888 |
|
998 |
|
1.77 |
|
1.54 |
|
1.51 |
|
Total |
$ |
157,692 |
|
$ |
158,060 |
|
$ |
174,517 |
|
$ |
2,661 |
|
$ |
1,912 |
|
$ |
1,612 |
|
1.69 |
% |
1.21 |
% |
0.92 |
% |
Trading account liabilities(8)(9)
|
|
|
|
|
|
|
|
|
|
In U.S. offices |
$ |
33,399 |
|
$ |
29,481 |
|
$ |
24,711 |
|
$ |
380 |
|
$ |
242 |
|
$ |
107 |
|
1.14 |
% |
0.82 |
% |
0.43 |
% |
In offices outside the U.S.(6)
|
57,149 |
|
44,669 |
|
45,252 |
|
258 |
|
168 |
|
110 |
|
0.45 |
|
0.38 |
|
0.24 |
|
Total |
$ |
90,548 |
|
$ |
74,150 |
|
$ |
69,963 |
|
$ |
638 |
|
$ |
410 |
|
$ |
217 |
|
0.70 |
% |
0.55 |
% |
0.31 |
% |
Short-term borrowings(10)
|
|
|
|
|
|
|
|
|
|
In U.S. offices |
$ |
74,825 |
|
$ |
61,015 |
|
$ |
64,973 |
|
$ |
684 |
|
$ |
202 |
|
$ |
224 |
|
0.91 |
% |
0.33 |
% |
0.34 |
% |
In offices outside the U.S.(6)
|
22,837 |
|
19,184 |
|
50,803 |
|
375 |
|
275 |
|
299 |
|
1.64 |
|
1.43 |
|
0.59 |
|
Total |
$ |
97,662 |
|
$ |
80,199 |
|
$ |
115,776 |
|
$ |
1,059 |
|
$ |
477 |
|
$ |
523 |
|
1.08 |
% |
0.59 |
% |
0.45 |
% |
Long-term debt(11)
|
|
|
|
|
|
|
|
|
|
In U.S. offices |
$ |
192,079 |
|
$ |
175,342 |
|
$ |
182,347 |
|
$ |
5,382 |
|
$ |
4,179 |
|
$ |
4,308 |
|
2.80 |
% |
2.38 |
% |
2.36 |
% |
In offices outside the U.S.(6)
|
4,615 |
|
6,426 |
|
7,642 |
|
191 |
|
233 |
|
209 |
|
4.14 |
|
3.63 |
|
2.73 |
|
Total |
$ |
196,694 |
|
$ |
181,768 |
|
$ |
189,989 |
|
$ |
5,573 |
|
$ |
4,412 |
|
$ |
4,517 |
|
2.83 |
% |
2.43 |
% |
2.38 |
% |
Total interest-bearing liabilities |
$ |
1,292,639 |
|
$ |
1,212,602 |
|
$ |
1,248,466 |
|
$ |
16,517 |
|
$ |
12,511 |
|
$ |
11,921 |
|
1.28 |
% |
1.03 |
% |
0.95 |
% |
Demand deposits in U.S. offices |
$ |
37,824 |
|
$ |
38,120 |
|
$ |
26,144 |
|
|
|
|
|
|
|
Other non-interest-bearing liabilities(8)
|
316,379 |
|
328,822 |
|
330,037 |
|
|
|
|
|
|
|
Total liabilities |
$ |
1,646,842 |
|
$ |
1,579,544 |
|
$ |
1,604,647 |
|
|
|
|
|
|
|
Citigroup stockholders’ equity(12)
|
$ |
227,599 |
|
$ |
228,065 |
|
$ |
217,875 |
|
|
|
|
|
|
|
Noncontrolling interest |
997 |
|
1,119 |
|
1,315 |
|
|
|
|
|
|
|
Total equity(12)
|
$ |
228,596 |
|
$ |
229,184 |
|
$ |
219,190 |
|
|
|
|
|
|
|
Total liabilities and stockholders’ equity |
$ |
1,875,438 |
|
$ |
1,808,728 |
|
$ |
1,823,837 |
|
|
|
|
|
|
|
Net interest revenue as a percentage of average interest-earning assets(13)
|
|
|
|
|
|
|
|
|
|
In U.S. offices |
$ |
967,752 |
|
$ |
944,893 |
|
$ |
931,258 |
|
$ |
27,551 |
|
$ |
27,929 |
|
$ |
28,492 |
|
2.85 |
% |
2.96 |
% |
3.06 |
% |
In offices outside the U.S.(6)
|
704,029 |
|
649,193 |
|
674,554 |
|
17,632 |
|
17,637 |
|
18,627 |
|
2.50 |
|
2.72 |
|
2.76 |
|
Total |
$ |
1,671,781 |
|
$ |
1,594,086 |
|
$ |
1,605,812 |
|
$ |
45,183 |
|
$ |
45,566 |
|
$ |
47,119 |
|
2.70 |
% |
2.86 |
% |
2.93 |
% |
|
|
(1) |
Net interest revenue includes the taxable equivalent adjustments related to the tax-exempt bond portfolio (based on the U.S. federal statutory tax rate of 35%) of $496 million, $462 million and $489 million for 2017, 2016 and 2015, respectively.
|
|
|
(2) |
Interest rates and amounts include the effects of risk management activities associated with the respective liability categories. |
|
|
(3) |
Monthly or quarterly averages have been used by certain subsidiaries where daily averages are unavailable. |
|
|
(4) |
Detailed average volume, Interest revenue and Interest expense exclude Discontinued operations. See Note 2 to the Consolidated Financial Statements.
|
|
|
(5) |
Consists of other time deposits and savings deposits. Savings deposits are made up of insured money market accounts, NOW accounts and other savings deposits. The interest expense on savings deposits includes FDIC deposit insurance assessments. |
|
|
(6) |
Average rates reflect prevailing local interest rates, including inflationary effects and monetary corrections in certain countries. |
|
|
(7) |
Average volumes of securities sold under agreements to repurchase are reported net pursuant to ASC 210-20-45. However, Interest expense excludes the impact of ASC 210-20-45.
|
|
|
(8) |
The fair value carrying amounts of derivative contracts are reported net, pursuant to ASC 815-10-45, in Non-interest-earning assets and Other non-interest-bearing liabilities.
|
|
|
(9) |
Interest expense on Trading account liabilities of ICG is reported as a reduction of Interest revenue. Interest revenue and Interest expense on cash collateral positions are reported in interest on Trading account assets and Trading account liabilities, respectively.
|
|
|
(10) |
Includes brokerage payables. |
|
|
(11) |
Excludes hybrid financial instruments and beneficial interests in consolidated VIEs that are classified as Long-term debt, as these obligations are accounted for in changes in fair value recorded in Principal transactions.
|
|
|
(12) |
Includes stockholders’ equity from discontinued operations. |
|
|
(13) |
Includes allocations for capital and funding costs based on the location of the asset. |
Analysis of Changes in Interest Revenue(1)(2)(3)
|
|
|
|
|
|
|
|
|
|
|
|
|
|
|
|
|
|
|
|
|
2017 vs. 2016 |
2016 vs. 2015 |
|
Increase (decrease)
due to change in:
|
Increase (decrease)
due to change in:
|
In millions of dollars |
Average
volume
|
Average
rate
|
Net
change
|
Average
volume
|
Average
rate
|
Net
change
|
Deposits with banks(4)
|
$ |
317 |
|
$ |
347 |
|
$ |
664 |
|
$ |
(11 |
) |
$ |
255 |
|
$ |
244 |
|
|
Federal funds sold and securities borrowed or
purchased under agreements to resell
|
|
|
|
|
|
|
In U.S. offices |
$ |
(67 |
) |
$ |
506 |
|
$ |
439 |
|
$ |
(21 |
) |
$ |
289 |
|
$ |
268 |
|
In offices outside the U.S.(4)
|
267 |
|
(1 |
) |
266 |
|
17 |
|
(258 |
) |
(241 |
) |
Total |
$ |
200 |
|
$ |
505 |
|
$ |
705 |
|
$ |
(4 |
) |
$ |
31 |
|
$ |
27 |
|
Trading account assets(5)
|
|
|
|
|
|
|
In U.S. offices |
$ |
(139 |
) |
$ |
(121 |
) |
$ |
(260 |
) |
$ |
(354 |
) |
$ |
200 |
|
$ |
(154 |
) |
In offices outside the U.S.(4)
|
203 |
|
(181 |
) |
22 |
|
(38 |
) |
(7 |
) |
(45 |
) |
Total |
$ |
64 |
|
$ |
(302 |
) |
$ |
(238 |
) |
$ |
(392 |
) |
$ |
193 |
|
$ |
(199 |
) |
Investments(1)
|
|
|
|
|
|
|
In U.S. offices |
$ |
(9 |
) |
$ |
561 |
|
$ |
552 |
|
$ |
188 |
|
$ |
230 |
|
$ |
418 |
|
In offices outside the U.S.(4)
|
(4 |
) |
156 |
|
152 |
|
113 |
|
(27 |
) |
86 |
|
Total |
$ |
(13 |
) |
$ |
717 |
|
$ |
704 |
|
$ |
301 |
|
$ |
203 |
|
$ |
504 |
|
Loans (net of unearned income)(6)
|
|
|
|
|
|
|
In U.S. offices |
$ |
734 |
|
$ |
969 |
|
$ |
1,703 |
|
$ |
455 |
|
$ |
(1,297 |
) |
$ |
(842 |
) |
In offices outside the U.S.(4)
|
297 |
|
(346 |
) |
(49 |
) |
(598 |
) |
711 |
|
113 |
|
Total |
$ |
1,031 |
|
$ |
623 |
|
$ |
1,654 |
|
$ |
(143 |
) |
$ |
(586 |
) |
$ |
(729 |
) |
Other interest-earning assets(7)
|
$ |
80 |
|
$ |
54 |
|
$ |
134 |
|
$ |
(182 |
) |
$ |
(628 |
) |
$ |
(810 |
) |
Total interest revenue |
$ |
1,679 |
|
$ |
1,944 |
|
$ |
3,623 |
|
$ |
(431 |
) |
$ |
(532 |
) |
$ |
(963 |
) |
|
|
(1) |
The taxable equivalent adjustment is related to the tax-exempt bond portfolio based on the U.S. federal statutory tax rate of 35% and is included in this presentation. |
|
|
(2) |
Rate/volume variance is allocated based on the percentage relationship of changes in volume and changes in rate to the total net change. |
|
|
(3) |
Detailed average volume, Interest revenue and Interest expense exclude Discontinued operations. See Note 2 to the Consolidated Financial Statements.
|
|
|
(4) |
Changes in average rates reflect changes in prevailing local interest rates, including inflationary effects and monetary corrections in certain countries. |
|
|
(5) |
Interest expense on Trading account liabilities of ICG is reported as a reduction of Interest revenue. Interest revenue and Interest expense on cash collateral positions are reported in interest on Trading account assets and Trading account liabilities, respectively.
|
|
|
(6) |
Includes cash-basis loans. |
|
|
(7) |
Includes brokerage receivables. |
Analysis of Changes in Interest Expense and Net Interest Revenue(1)(2)(3)
|
|
|
|
|
|
|
|
|
|
|
|
|
|
|
|
|
|
|
|
|
2017 vs. 2016 |
2016 vs. 2015 |
|
Increase (decrease)
due to change in:
|
Increase (decrease)
due to change in:
|
In millions of dollars |
Average
volume
|
Average
rate
|
Net
change
|
Average
volume
|
Average
rate
|
Net
change
|
Deposits |
|
|
|
|
|
|
In U.S. offices |
$ |
147 |
|
$ |
753 |
|
$ |
900 |
|
$ |
77 |
|
$ |
262 |
|
$ |
339 |
|
In offices outside the U.S.(4)
|
64 |
|
322 |
|
386 |
|
40 |
|
(131 |
) |
(91 |
) |
Total |
$ |
211 |
|
$ |
1,075 |
|
$ |
1,286 |
|
$ |
117 |
|
$ |
131 |
|
$ |
248 |
|
|
Federal funds purchased and securities loaned or
sold under agreements to repurchase
|
|
|
|
|
|
|
In U.S. offices |
$ |
(45 |
) |
$ |
595 |
|
$ |
550 |
|
$ |
(47 |
) |
$ |
457 |
|
$ |
410 |
|
In offices outside the U.S.(4)
|
62 |
|
137 |
|
199 |
|
(132 |
) |
22 |
|
(110 |
) |
Total |
$ |
17 |
|
$ |
732 |
|
$ |
749 |
|
$ |
(179 |
) |
$ |
479 |
|
$ |
300 |
|
Trading account liabilities(5)
|
|
|
|
|
|
|
In U.S. offices |
$ |
35 |
|
$ |
103 |
|
$ |
138 |
|
$ |
24 |
|
$ |
111 |
|
$ |
135 |
|
In offices outside the U.S.(4)
|
52 |
|
38 |
|
90 |
|
(1 |
) |
59 |
|
58 |
|
Total |
$ |
87 |
|
$ |
141 |
|
$ |
228 |
|
$ |
23 |
|
$ |
170 |
|
$ |
193 |
|
Short-term borrowings(6)
|
|
|
|
|
|
|
In U.S. offices |
$ |
55 |
|
$ |
427 |
|
$ |
482 |
|
$ |
(13 |
) |
$ |
(9 |
) |
$ |
(22 |
) |
In offices outside the U.S.(4)
|
57 |
|
43 |
|
100 |
|
(267 |
) |
243 |
|
(24 |
) |
Total |
$ |
112 |
|
$ |
470 |
|
$ |
582 |
|
$ |
(280 |
) |
$ |
234 |
|
$ |
(46 |
) |
Long-term debt |
|
|
|
|
|
|
In U.S. offices |
$ |
424 |
|
$ |
779 |
|
$ |
1,203 |
|
$ |
(167 |
) |
$ |
38 |
|
$ |
(129 |
) |
In offices outside the U.S.(4)
|
(72 |
) |
30 |
|
(42 |
) |
(37 |
) |
61 |
|
24 |
|
Total |
$ |
352 |
|
$ |
809 |
|
$ |
1,161 |
|
$ |
(204 |
) |
$ |
99 |
|
$ |
(105 |
) |
Total interest expense |
$ |
779 |
|
$ |
3,227 |
|
$ |
4,006 |
|
$ |
(523 |
) |
$ |
1,113 |
|
$ |
590 |
|
Net interest revenue |
$ |
900 |
|
$ |
(1,283 |
) |
$ |
(383 |
) |
$ |
92 |
|
$ |
(1,645 |
) |
$ |
(1,553 |
) |
|
|
(1) |
The taxable equivalent adjustment is related to the tax-exempt bond portfolio based on the U.S. federal statutory tax rate of 35% and is included in this presentation. |
|
|
(2) |
Rate/volume variance is allocated based on the percentage relationship of changes in volume and changes in rate to the total net change. |
|
|
(3) |
Detailed average volume, Interest revenue and Interest expense exclude Discontinued operations. See Note 2 to the Consolidated Financial Statements.
|
|
|
(4) |
Changes in average rates reflect changes in prevailing local interest rates, including inflationary effects and monetary corrections in certain countries. |
|
|
(5) |
Interest expense on Trading account liabilities of ICG is reported as a reduction of Interest revenue. Interest revenue and Interest expense on cash collateral positions are reported in interest on Trading account assets and Trading account liabilities, respectively.
|
|
|
(6) |
Includes brokerage payables. |
Market Risk of Trading Portfolios
Trading portfolios include positions resulting from market making activities, hedges of certain available-for-sale (AFS) debt securities, the CVA relating to derivative counterparties and all associated hedges, fair value option loans, hedges to the loan portfolio and the leverage finance pipeline within capital markets origination within ICG.
The market risk of Citi’s trading portfolios is monitored using a combination of quantitative and qualitative measures, including, but not limited to:
|
|
• |
value at risk (VAR); and |
Each trading portfolio across Citi’s businesses has its own market risk limit framework encompassing these measures and other controls, including trading mandates, permitted product
lists and a new product approval process for complex products.
The following chart of total daily trading-related revenue (loss) captures trading volatility and shows the number of days in which revenues for Citi’s trading businesses fell within particular ranges. Trading-related revenue includes trading, net interest and other revenue associated with Citi’s trading businesses. It excludes DVA, FVA and CVA adjustments incurred due to changes in the credit quality of counterparties, as well as any associated hedges to that CVA. In addition, it excludes fees and other revenue associated with capital markets origination activities. Trading-related revenues are driven by both customer flows and the changes in valuation of the trading inventory. As shown in the chart, positive trading-related revenue was achieved for 99.6% of the trading days in 2017.
|
|
Daily Trading-Related Revenue (Loss) (1)— Twelve Months ended December 31, 2017
In millions of dollars
|
|
|
(1) |
Reflects the effects of asymmetrical accounting for economic hedges of certain AFS debt securities. Specifically, the change in the fair value of hedging derivatives is included in Trading-related revenue, while the offsetting change in the fair value of hedged AFS debt securities is included in AOCI and not reflected above.
|
Factor Sensitivities
Factor sensitivities are expressed as the change in the value of a position for a defined change in a market risk factor, such as a change in the value of a U.S. Treasury bill for a one-basis-point change in interest rates. Citi’s market risk management, within the Risk organization, works to ensure that factor sensitivities are calculated, monitored and, in most cases, limited for all material risks taken in the trading portfolios.
Value at Risk (VAR)
VAR estimates, at a 99% confidence level, the potential decline in the value of a position or a portfolio under normal market conditions assuming a one-day holding period. VAR statistics, which are based on historical data, can be materially different across firms due to differences in portfolio composition, differences in VAR methodologies and differences in model parameters. As a result, Citi believes VAR statistics can be used more effectively as indicators of trends in risk-taking within a firm, rather than as a basis for inferring differences in risk-taking across firms.
Citi uses a single, independently approved Monte Carlo simulation VAR model (see “VAR Model Review and Validation” below), which has been designed to capture material risk sensitivities (such as first- and second-order sensitivities of positions to changes in market prices) of various asset classes/risk types (such as interest rate, credit spread, foreign exchange, equity and commodity risks). Citi’s VAR includes positions which are measured at fair value; it does not include investment securities classified as AFS or
HTM. For information on these securities, see Note 13 to the Consolidated Financial Statements.
Citi believes its VAR model is conservatively calibrated to incorporate fat-tail scaling and the greater of short-term (approximately the most recent month) and long-term (three years) market volatility. The Monte Carlo simulation involves approximately 350,000 market factors, making use of approximately 200,000 time series, with sensitivities updated daily, volatility parameters updated daily to weekly and correlation parameters updated monthly. The conservative features of the VAR calibration contribute an approximate 20% add-on to what would be a VAR estimated under the assumption of stable and perfectly, normally distributed markets.
As set forth in the table below, Citi’s average trading VAR increased from December 31, 2016 to December 31, 2017, mainly due to changes in interest rate exposures from mark-to-market hedging activity against non-trading positions in the Markets and securities services businesses within ICG. The increase was partially offset by lower credit spread exposures and volatilities. Average trading and credit portfolio VAR was largely unchanged from December 31, 2016 to December 31, 2017, mainly due to a reduction of the hedging related to lending activities offsetting the increase in average trading VAR.
Year-end and Average Trading VAR and Trading and Credit Portfolio VAR
|
|
|
|
|
|
|
|
|
|
|
|
|
|
In millions of dollars |
December 31, 2017 |
2017 Average |
December 31, 2016 |
2016 Average |
Interest rate |
$ |
69 |
|
$ |
58 |
|
$ |
37 |
|
$ |
35 |
|
Credit spread |
54 |
|
48 |
|
63 |
|
62 |
|
Covariance adjustment(1)
|
(25 |
) |
(20 |
) |
(17 |
) |
(28 |
) |
Fully diversified interest rate and credit spread(2)
|
$ |
98 |
|
$ |
86 |
|
$ |
83 |
|
$ |
69 |
|
Foreign exchange |
25 |
|
25 |
|
32 |
|
24 |
|
Equity |
17 |
|
15 |
|
13 |
|
14 |
|
Commodity |
17 |
|
22 |
|
27 |
|
21 |
|
Covariance adjustment(1)
|
(63 |
) |
(64 |
) |
(70 |
) |
(58 |
) |
Total trading VAR—all market risk factors, including general and specific risk (excluding credit portfolios)(2)
|
$ |
94 |
|
$ |
84 |
|
$ |
85 |
|
$ |
70 |
|
Specific risk-only component(3)
|
$ |
— |
|
$ |
1 |
|
$ |
3 |
|
$ |
7 |
|
Total trading VAR—general market risk factors only (excluding credit portfolios) |
$ |
94 |
|
$ |
83 |
|
$ |
82 |
|
$ |
63 |
|
Incremental impact of the credit portfolio(4)
|
$ |
11 |
|
$ |
10 |
|
$ |
20 |
|
$ |
22 |
|
Total trading and credit portfolio VAR |
$ |
105 |
|
$ |
94 |
|
$ |
105 |
|
$ |
92 |
|
|
|
(1) |
Covariance adjustment (also known as diversification benefit) equals the difference between the total VAR and the sum of the VARs tied to each individual risk type. The benefit reflects the fact that the risks within each and across risk types are not perfectly correlated and, consequently, the total VAR on a given day will be lower than the sum of the VARs relating to each individual risk type. The determination of the primary drivers of changes to the covariance adjustment is made by an examination of the impact of both model parameter and position changes. |
(2) The total trading VAR includes mark-to-market and certain fair value option trading positions in ICG, with the exception of hedges to the loan portfolio, fair value option loans and all CVA exposures. Available-for-sale and accrual exposures are not included.
|
|
(3) |
The specific risk-only component represents the level of equity and fixed income issuer-specific risk embedded in VAR. |
|
|
(4) |
The credit portfolio is composed of mark-to-market positions associated with non-trading business units including Citi Treasury, the CVA relating to derivative counterparties and all associated CVA hedges. FVA and DVA are not included. The credit portfolio also includes hedges to the loan portfolio, fair value option loans and hedges to the leveraged finance pipeline within capital markets origination in ICG.
|
The table below provides the range of market factor VARs associated with Citi’s total trading VAR, inclusive of specific risk:
|
|
|
|
|
|
|
|
|
|
|
|
|
|
|
2017 |
2016 |
In millions of dollars |
Low |
High |
Low |
High |
Interest rate |
$ |
29 |
|
$ |
97 |
|
$ |
25 |
|
$ |
64 |
|
Credit spread |
38 |
|
63 |
|
55 |
|
73 |
|
Fully diversified interest rate and credit spread |
$ |
59 |
|
$ |
109 |
|
$ |
59 |
|
$ |
97 |
|
Foreign exchange |
16 |
|
49 |
|
14 |
|
46 |
|
Equity |
6 |
|
27 |
|
6 |
|
26 |
|
Commodity |
13 |
|
31 |
|
10 |
|
33 |
|
Total trading |
$ |
58 |
|
$ |
116 |
|
$ |
53 |
|
$ |
106 |
|
Total trading and credit portfolio |
67 |
|
123 |
|
72 |
|
131 |
|
Note: No covariance adjustment can be inferred from the above table as the high and low for each market factor will be from different close-of-business dates.
The following table provides the VAR for ICG, excluding the CVA relating to derivative counterparties, hedges of CVA, fair value option loans and hedges to the loan portfolio:
|
|
|
|
|
In millions of dollars |
Dec. 31, 2017 |
Total—all market risk factors, including general and specific risk |
$ |
93 |
|
Average—during year |
$ |
83 |
|
High—during year |
115 |
|
Low—during year |
57 |
|
VAR Model Review and Validation
Generally, Citi’s VAR review and model validation process entails reviewing the model framework, major assumptions and implementation of the mathematical algorithm. In addition, as part of the model validation process, product specific back-testing on portfolios is periodically completed and reviewed with Citi’s U.S. banking regulators. Furthermore, Regulatory VAR back-testing (as described below) is performed against buy-and-hold profit and loss on a monthly basis for multiple sub-portfolios across the organization (trading desk level, ICG business segment and Citigroup) and the results are shared with U.S. banking regulators.
Significant VAR model and assumption changes must be independently validated within Citi’s risk management organization. This validation process includes a review by Citi’s model validation group and further approval from its model validation review committee, which is composed of senior quantitative risk management officers. In the event of significant model changes, parallel model runs are undertaken prior to implementation. In addition, significant model and assumption changes are subject to the periodic reviews and approval by Citi’s U.S. banking regulators.
Citi uses the same independently validated VAR model for both Regulatory VAR and Risk Management VAR (i.e., total trading and total trading and credit portfolios VARs) and, as such, the model review and oversight process for both purposes is as described above.
Regulatory VAR, which is calculated in accordance with Basel III, differs from Risk Management VAR due to the fact that certain positions included in Risk Management VAR are
not eligible for market risk treatment in Regulatory VAR. The composition of Risk Management VAR is discussed under “Value at Risk” above. The applicability of the VAR model for positions eligible for market risk treatment under U.S. regulatory capital rules is periodically reviewed and approved by Citi’s U.S. banking regulators.
In accordance with Basel III, Regulatory VAR includes all trading book-covered positions and all foreign exchange and commodity exposures. Pursuant to Basel III, Regulatory VAR excludes positions that fail to meet the intent and ability to trade requirements and are therefore classified as non-trading book and categories of exposures that are specifically excluded as covered positions. Regulatory VAR excludes CVA on derivative instruments and DVA on Citi’s own fair value option liabilities. CVA hedges are excluded from Regulatory VAR and included in credit risk-weighted assets as computed under the Advanced Approaches for determining risk-weighted assets.
Regulatory VAR Back-Testing
In accordance with Basel III, Citi is required to perform back-testing to evaluate the effectiveness of its Regulatory VAR model. Regulatory VAR back-testing is the process in which the daily one-day VAR, at a 99% confidence interval, is compared to the buy-and-hold profit and loss (i.e., the profit and loss impact if the portfolio is held constant at the end of the day and re-priced the following day). Buy-and-hold profit and loss represents the daily mark-to-market profit and loss attributable to price movements in covered positions from the close of the previous business day. Buy-and-hold profit and loss excludes realized trading revenue, net interest, fees and commissions, intra-day trading profit and loss and changes in reserves.
Based on a 99% confidence level, Citi would expect two to three days in any one year where buy-and-hold losses exceeded the Regulatory VAR. Given the conservative calibration of Citi’s VAR model (as a result of taking the greater of short- and long-term volatilities and fat-tail scaling of volatilities), Citi would expect fewer exceptions under normal and stable market conditions. Periods of unstable market conditions could increase the number of back-testing exceptions.
The following graph shows the daily buy-and-hold profit and loss associated with Citi’s covered positions compared to Citi’s one-day Regulatory VAR during 2017. During 2017, there were no back-testing exceptions observed for Citi’s Regulatory VAR.
The difference between the 45.4% of days with buy-and-hold gains for Regulatory VAR back-testing and the 99.6% of days with trading, net interest and other revenue associated with Citi’s trading businesses, shown in the histogram of daily trading-related revenue below, reflects, among other things, that a significant portion of Citi’s trading-related revenue is not generated from daily price movements on these positions and exposures, as well as differences in the portfolio composition of Regulatory VAR and Risk Management VAR.
|
|
|
Regulatory Trading VAR and Associated Buy-and-Hold Profit and Loss (1)—12 Months ended December 31, 2017
In millions of dollars
|
|
|
(1) |
Buy-and-hold profit and loss, as defined by the banking regulators under Basel III, represents the daily mark-to-market revenue movement attributable to the trading position from the close of the previous business day. Buy-and-hold profit and loss excludes realized trading revenue and net interest intra-day trading profit and loss on new and terminated trades, as well as changes in reserves. Therefore, it is not comparable to the trading-related revenue presented in the chart of daily trading-related revenue above. |
Stress Testing
Citi performs market risk stress testing on a regular basis to estimate the impact of extreme market movements. It is performed on individual positions and trading portfolios, as well as in aggregate, inclusive of multiple trading portfolios. Citi’s market risk management, after consultations with the businesses, develops both systemic and specific stress scenarios, reviews the output of periodic stress testing exercises, and uses the information to assess the ongoing appropriateness of exposure levels and limits. Citi uses two complementary approaches to market risk stress testing across all major risk factors (i.e., equity, foreign exchange, commodity, interest rate and credit spreads): top-down systemic stresses and bottom-up business-specific stresses. Systemic stresses are designed to quantify the potential impact of extreme market movements on an institution-wide basis, and are constructed using both historical periods of market stress and projections of adverse economic scenarios. Business-specific stresses are designed to probe the risks of particular portfolios and market segments, especially those risks that are not fully captured in VAR and systemic stresses.
The systemic stress scenarios and business-specific stress scenarios at Citi are used in several reports reviewed by senior management and also to calculate internal risk capital for trading market risk. In general, changes in market values are defined over a one-year horizon. For the most liquid positions and market factors, changes in market values are defined over a shorter two-month horizon. The limited set of positions and market factors whose market value changes are defined over a two-month time horizon are those that in management’s judgment have historically remained very liquid during financial crises, even as the trading liquidity of most other positions and market factors materially declined.
OPERATIONAL RISK
Operational risk is the risk of loss resulting from inadequate or failed internal processes, systems or human factors, or from external events. It includes risk of failing to comply with applicable laws and regulations, but excludes strategic risk. Operational risk includes the reputation and franchise risk associated with business practices or market conduct in which Citi is involved, as well as compliance, conduct and legal risks.
Operational risk is inherent in Citi’s global business activities, as well as related support functions, and can result in losses arising from events associated with the following, among others:
|
|
• |
fraud, theft and unauthorized activity; |
|
|
• |
employment practices and workplace environment; |
|
|
• |
clients, products and business practices; |
|
|
• |
physical assets and infrastructure; and |
|
|
• |
execution, delivery and process management. |
Citi manages operational risk consistent with the overall framework described in “Managing Global Risk—Overview” above. The Company’s goal is to keep operational risk at appropriate levels relative to the characteristics of Citi’s businesses, the markets in which it operates, its capital and liquidity and the competitive, economic and regulatory environment.
To anticipate, mitigate and control operational risk, Citi has established policies and a global framework for assessing, monitoring and communicating operational risks and the overall operating effectiveness of the internal control environment across Citigroup. As part of this framework, Citi has defined its operational risk appetite and has established a manager’s control assessment (MCA) process (a process through which managers at Citi identify, monitor, measure, report on and manage risks and the related controls) to help managers self-assess significant operational risks and key controls and identify and address weaknesses in the design and/or operating effectiveness of internal controls that mitigate significant operational risks.
Each major business segment must implement an operational risk process consistent with the requirements of this framework. The process for operational risk management includes the following steps:
|
|
• |
identify and assess key operational risks; |
|
|
• |
design controls to mitigate identified risks; |
|
|
• |
establish key risk indicators; |
|
|
• |
implement a process for early problem recognition and timely escalation; |
|
|
• |
produce comprehensive operational risk reporting; and |
|
|
• |
ensure that sufficient resources are available to actively improve the operational risk environment and mitigate emerging risks. |
As new products and business activities are developed, processes are designed, modified or sourced through alternative means and operational risks are considered.
An Operational Risk Management Committee has been established to provide oversight for operational risk across
Citigroup and to provide a forum to assess Citi’s operational risk profile and ensure actions are taken so that Citi’s operational risk exposure is actively managed consistent with Citi’s risk appetite. The Committee seeks to ensure that these actions address the root causes that persistently lead to operational risk losses and create lasting solutions to minimize these losses. Members include Citi’s Chief Risk Officer and Citi’s Head of Operational Risk and senior members of their organizations. These members cover multiple dimensions of risk management and include business and regional Chief Risk Officers and senior operational risk managers.
In addition, Risk management, including Operational Risk Management, works proactively with the businesses and other independent control functions to embed a strong operational risk management culture and framework across Citi. Operational Risk Management engages with the businesses to ensure effective implementation of the Operational Risk Management framework by focusing on (i) identification, analysis and assessment of operational risks, (ii) effective challenge of key control issues and operational risks and (iii) anticipation and mitigation of operational risk events.
Information about the businesses’ operational risk, historical operational risk losses and the control environment is reported by each major business segment and functional area. The information is summarized and reported to senior management, as well as to the Audit Committee of Citi’s Board of Directors.
Operational risk is measured and assessed through risk capital. Projected operational risk losses under stress scenarios are also required as part of the Federal Reserve Board’s CCAR process.
COMPLIANCE RISK
Compliance risk is the risk arising from violations of, or non-conformance with, local, national, or cross-border laws, rules, or regulations, Citi's internal policies, or other relevant standards of conduct or the risk of harming customers, clients or the integrity of the market.
As the champion of responsible finance, Independent Compliance Risk Management’s primary objectives are to:
|
|
• |
Maintain a framework that facilitates enterprise-wide compliance with local, national or cross-border laws, rules or regulations, Citi’s internal policies and procedures and relevant standards of conduct; |
|
|
• |
Support Citi’s operations by assisting in the management of compliance risk across products, business lines, functions and geographies, supported by globally consistent systems and processes; and |
|
|
• |
Drive and embed a risk culture of compliance, control and ethical conduct throughout Citi. |
Independent Compliance Risk Management (ICRM) Program
To anticipate, mitigate and control compliance risk, Citi has established a global independent compliance risk management framework for assessing, monitoring and communicating compliance risks. To achieve this mission, ICRM seeks to:
|
|
• |
Communicate a strong culture of compliance, control and ethical conduct. |
|
|
• |
Identify compliance risk and AML compliance risk for which each business or function has responsibility, including through compliance risk assessments, and set standards with respect to these requirements. |
|
|
• |
Identify regulatory changes and oversee the assessment of impact, as well as capture and monitor adherence to existing regulatory requirements, providing the businesses with guidance and support as needed in accordance with the regulatory change management standard. |
|
|
• |
Provide credible challenge to the first-line units in their assessment and management of compliance risk. |
|
|
• |
Perform compliance assurance activities to oversee adherence to applicable requirements. |
|
|
• |
Issue policies, procedures and other documentation that set standards for employees in conducting Citi’s business and provide oversight in the application of those standards to specific circumstances. |
|
|
• |
Manage regulatory examinations and other supervisory activity impacting Citi’s businesses and global control functions in accordance with the regulatory exam management governance and process standards. |
|
|
• |
Provide training to support the effective execution of roles and responsibilities related to the identification, control, reporting and escalation of matters related to compliance risks. |
|
|
• |
Report to senior management and the Citigroup Board of Directors or their designated committees on the effectiveness of the processes and standards implemented to manage compliance risk. |
|
|
• |
Escalate through the appropriate channels, which may include governance forums, the results of monitoring, testing, reporting or other oversight activities that may represent a violation of law, regulation, policy or other significant compliance risk and take reasonable action to see that the matter is appropriately identified, tracked and resolved, including through the issuance of corrective action plans against the first line of defense. |
|
|
• |
Advise, as needed or when required by policy, on the degree to which existing and new business processes, methodologies, performance, products, services, transactions or customer segments satisfy Citi standards and are consistent with the prudent management of compliance risk. |
CONDUCT RISK
Citi places conduct risk within compliance risk and defines conduct risk as the risk that Citi’s employees or agents may—intentionally or through negligence—harm customers, clients, or the integrity of the markets, and thereby the integrity of the Company. Citi manages its exposure to conduct risk through a global conduct risk program that is implemented across its businesses and functions. The conduct risk program requires all three lines of defense to understand and perform certain key roles and responsibilities. The first line of defense owns and manages the risks inherent in or arising from the business, including conduct risk, and is responsible for managing, minimizing and mitigating those risks. The second line of defense takes a risk-based approach to assess, advise on, monitor and test current and emerging significant conduct risks across products, businesses, functions, countries and regions and works to enhance the effectiveness of controls. The third line of defense provides independent risk-based assurance over the conduct risk program based upon a risk-based audit plan and audit methodology as approved by the Citigroup Board of Directors.
Each business and function identifies its significant conduct risks through a diagnostic process that includes broadly understanding their potential significant conduct risks in the context of their overall activities, identifying and flagging their significant conduct risks and related controls and incorporating the results of this diagnostic process into their annual risk assessment process. Citi also manages its conduct risk through other initiatives, including various culture-related efforts.
LEGAL RISK
Citi views legal risk as qualitative in nature because it does not lend itself to an appetite expressed through a numerical limit and it cannot be reliably estimated or measured based on forecasts. As such, Citi seeks to manage this risk in accordance with its qualitative risk appetite principle, which generally states that activities in which Citi engages and the risks those activities generate must be consistent with Citi’s underlying commitment to the principle of responsible finance and managed with a goal to eliminate, minimize or mitigate this risk, as practicable. To accomplish this goal, legal risk is managed in accordance with the overall framework described in greater detail in “Managing Global Risk—Overview” above.
REPUTATIONAL RISK
Citi’s reputation is a vital asset in building trust with its stakeholders and Citi is diligent in communicating its corporate values, including the importance of protecting Citi’s reputation, to its employees, customers and investors. The responsibility for maintaining Citi’s reputation is shared by all employees, who are guided by Citi’s code of conduct. Employees are expected to exercise sound judgment and common sense in every action they take and issues that present potential franchise, reputational and/or systemic risks are to be appropriately escalated. The business practices committees for each of Citi’s businesses and regions are part of the governance infrastructure Citi has in place to properly
review business activities, sales practices, product design, perceived conflicts of interest and other potential franchise or reputational risks that arise in these businesses and regions. These committees may also raise potential franchise, reputational or systemic risks for due consideration by the business practices committee at the corporate level. All of these committees, which are composed of Citi’s most senior executives, provide the guidance necessary for Citi’s business practices to meet the highest standards of professionalism, integrity and ethical behavior consistent with Citi’s mission and value proposition.
STRATEGIC RISK
Citi senior management, led by Citi’s CEO, is responsible for the development and execution of the strategy of the Company. Significant strategic actions are reviewed and approved by, or notified to, the Citigroup and Citibank Board of Directors, as appropriate. The Citigroup Board of Directors holds an annual strategic meeting and annual regional strategic meetings, and receives business presentations at its regular meetings, in order to monitor management’s execution of Citi’s strategy. At the business level, business heads are accountable for the interpretation and execution of the Company-wide strategy, as it applies to their area, including decisions on new business and product entries.
The management of strategic risk rests upon the foundational elements that include an annual financial operating plan encompassing all businesses, products and geographies and defined financial and operating targets, derived from the operating plan, which can be monitored throughout the year in order to assess strategic and operating performance. Strategic risk is monitored through various mechanisms, including regular updates to senior management and the Board of Directors on performance against the operating plan, quarterly business reviews between the Citi CEO and business and regional CEOs in which the performance and risks of each major business and region are discussed, ongoing reporting to senior management and executive management scorecards.
Country Risk
Top 25 Country Exposures
The following table presents Citi’s top 25 exposures by
country (excluding the U.S.) as of December 31, 2017. The total exposure as of December 31, 2017 to the top 25 countries disclosed below, in combination with the U.S., would represent, approximately 94% of Citi’s exposure to all countries. For purposes of the table, loan amounts are reflected in the country where the loan is booked, which is generally based on the domicile of the borrower. For example, a loan to a Chinese subsidiary of a Switzerland-based corporation will generally be categorized as a loan in China. In addition, Citi has developed regional booking centers in certain countries, most significantly in the United Kingdom (U.K.) and Ireland, in order to more efficiently serve its corporate customers. As an example, with respect to the U.K., only 24% of corporate
loans presented in the table below are to U.K. domiciled
entities (25% for unfunded commitments), with the balance of
the loans predominately to European domiciled counterparties.
Approximately 80% of the total U.K. funded loans and 88% of
the total U.K. unfunded commitments were investment grade
as of December 31, 2017. Trading account assets and investment securities are generally categorized based on the domicile of the issuer of the security of the underlying reference entity. For additional information on the assets included in the table, see the footnotes to the table below.
For a discussion of uncertainties arising as a result of the terms and other uncertainties resulting from the U.K.’s potential exit from the EU, see “Risk Factors—Strategic Risks” above.
|
|
|
|
|
|
|
|
|
|
|
|
|
|
|
|
|
|
|
|
|
|
|
|
|
|
|
|
|
|
|
|
|
|
|
|
|
In billions of dollars |
ICG
loans(1)
|
GCB loans |
Other funded(3)
|
Unfunded(4)
|
Net MTM on derivatives/repos(5)
|
Total hedges (on loans and CVA) |
Investment securities(6)
|
Trading account assets(7)
|
Total
as of
4Q17
|
Total
as of
3Q17
|
Total
as of
4Q16
|
Total as a % of Citi as of 4Q17(8)
|
United Kingdom |
$ |
36.1 |
|
$ |
— |
|
$ |
4.6 |
|
$ |
60.3 |
|
$ |
8.4 |
|
$ |
(2.2 |
) |
$ |
7.0 |
|
$ |
(1.0 |
) |
$ |
113.2 |
|
$ |
110.2 |
|
$ |
107.5 |
|
7.2 |
% |
Mexico |
9.4 |
|
25.3 |
|
0.4 |
|
7.3 |
|
0.5 |
|
(0.7 |
) |
13.1 |
|
3.1 |
|
58.4 |
|
62.8 |
|
52.4 |
|
3.7 |
|
Hong Kong |
16.3 |
|
11.6 |
|
0.7 |
|
6.4 |
|
0.7 |
|
(0.3 |
) |
5.7 |
|
1.1 |
|
42.2 |
|
40.8 |
|
35.9 |
|
2.7 |
|
Singapore |
15.2 |
|
12.4 |
|
0.3 |
|
5.1 |
|
1.2 |
|
(0.2 |
) |
7.1 |
|
0.3 |
|
41.4 |
|
43.8 |
|
36.4 |
|
2.6 |
|
Korea |
2.2 |
|
19.9 |
|
0.2 |
|
3.3 |
|
2.2 |
|
(1.2 |
) |
7.7 |
|
1.0 |
|
35.3 |
|
34.2 |
|
34.0 |
|
2.3 |
|
Ireland |
12.6 |
|
— |
|
2.3 |
|
15.8 |
|
0.4 |
|
— |
|
— |
|
0.8 |
|
31.9 |
|
28.8 |
|
24.8 |
|
2.0 |
|
India |
6.4 |
|
7.0 |
|
0.6 |
|
5.3 |
|
1.1 |
|
(0.7 |
) |
9.3 |
|
1.3 |
|
30.3 |
|
28.7 |
|
30.9 |
|
1.9 |
|
Australia |
4.4 |
|
10.9 |
|
— |
|
5.6 |
|
0.8 |
|
(0.5 |
) |
3.8 |
|
0.2 |
|
25.2 |
|
27.0 |
|
22.4 |
|
1.6 |
|
Brazil(2)
|
11.7 |
|
— |
|
— |
|
2.7 |
|
5.0 |
|
(1.8 |
) |
3.2 |
|
3.9 |
|
24.7 |
|
28.0 |
|
28.5 |
|
1.6 |
|
China |
8.0 |
|
4.6 |
|
0.4 |
|
1.8 |
|
1.8 |
|
(0.7 |
) |
3.8 |
|
(0.3 |
) |
19.4 |
|
20.8 |
|
17.2 |
|
1.2 |
|
Germany |
0.1 |
|
— |
|
— |
|
3.9 |
|
4.3 |
|
(1.9 |
) |
8.9 |
|
3.8 |
|
19.1 |
|
18.6 |
|
16.0 |
|
1.2 |
|
Japan |
3.1 |
|
0.1 |
|
0.2 |
|
2.7 |
|
2.8 |
|
(1.0 |
) |
5.3 |
|
4.5 |
|
17.7 |
|
18.8 |
|
18.3 |
|
1.1 |
|
Taiwan |
4.5 |
|
9.1 |
|
0.1 |
|
1.1 |
|
0.3 |
|
— |
|
1.3 |
|
0.9 |
|
17.3 |
|
18.5 |
|
16.6 |
|
1.1 |
|
Canada |
1.8 |
|
0.6 |
|
0.5 |
|
7.0 |
|
1.8 |
|
(0.4 |
) |
4.4 |
|
0.6 |
|
16.3 |
|
16.0 |
|
17.0 |
|
1.0 |
|
Poland |
3.6 |
|
2.0 |
|
— |
|
3.1 |
|
— |
|
(0.1 |
) |
5.0 |
|
0.4 |
|
14.0 |
|
13.6 |
|
11.8 |
|
0.9 |
|
Malaysia |
1.4 |
|
4.9 |
|
0.3 |
|
2.1 |
|
0.1 |
|
(0.1 |
) |
0.9 |
|
0.4 |
|
10.0 |
|
9.1 |
|
9.3 |
|
0.6 |
|
Thailand |
0.9 |
|
2.2 |
|
— |
|
1.8 |
|
0.1 |
|
— |
|
1.8 |
|
0.6 |
|
7.4 |
|
7.0 |
|
5.8 |
|
0.5 |
|
United Arab Emirates |
2.9 |
|
1.5 |
|
0.1 |
|
2.5 |
|
0.3 |
|
(0.1 |
) |
— |
|
(0.2 |
) |
7.0 |
|
6.7 |
|
6.0 |
|
0.4 |
|
Russia |
1.8 |
|
1.0 |
|
— |
|
1.0 |
|
1.9 |
|
(0.1 |
) |
0.8 |
|
0.2 |
|
6.6 |
|
5.0 |
|
5.3 |
|
0.4 |
|
Indonesia |
1.9 |
|
1.1 |
|
— |
|
1.5 |
|
— |
|
(0.1 |
) |
1.5 |
|
0.4 |
|
6.3 |
|
6.2 |
|
5.2 |
|
0.4 |
|
Luxembourg |
— |
|
— |
|
— |
|
— |
|
0.5 |
|
(0.3 |
) |
4.6 |
|
0.6 |
|
5.4 |
|
6.1 |
|
5.4 |
|
0.3 |
|
Colombia(2)
|
1.7 |
|
1.6 |
|
— |
|
1.1 |
|
0.3 |
|
— |
|
0.4 |
|
— |
|
5.1 |
|
4.9 |
|
5.6 |
|
0.3 |
|
Jersey |
3.2 |
|
— |
|
— |
|
1.6 |
|
— |
|
— |
|
— |
|
— |
|
4.8 |
|
4.5 |
|
3.7 |
|
0.3 |
|
South Africa |
1.6 |
|
— |
|
— |
|
1.2 |
|
0.4 |
|
(0.1 |
) |
1.4 |
|
(0.2 |
) |
4.3 |
|
4.3 |
|
3.9 |
|
0.3 |
|
Argentina(2)
|
1.9 |
|
— |
|
— |
|
0.1 |
|
1.3 |
|
(0.4 |
) |
0.4 |
|
0.9 |
|
4.2 |
|
4.3 |
|
2.2 |
|
0.3 |
|
|
|
|
|
|
|
|
|
|
|
|
Total |
|
36.2 |
% |
|
|
(1) |
ICG loans reflect funded corporate loans and private bank loans, net of unearned income. As of December 31, 2017, private bank loans in the table above totaled $23.5 billion, concentrated in Singapore ($7.0 billion), Hong Kong ($6.8 billion) and the U.K. ($5.1 billion).
|
|
|
(2) |
GCB loans include funded loans in Argentina, Brazil and Colombia related to businesses that were transferred to Corporate/Other as of January 1, 2016. The sales of the Argentina and Brazil consumer banking businesses were completed in the first and fourth quarters of 2017, respectively.
|
|
|
(3) |
Other funded includes other direct exposure such as accounts receivable, loans held-for-sale, other loans in Corporate/Other and investments accounted for under the equity method.
|
|
|
(4) |
Unfunded exposure includes unfunded corporate lending commitments, letters of credit and other contingencies. |
|
|
(5) |
Net mark-to-market on derivatives and securities lending/borrowing transactions (repos). Exposures are shown net of collateral and inclusive of CVA. Includes margin loans. |
|
|
(6) |
Investment securities include securities available-for-sale, recorded at fair market value, and securities held-to-maturity, recorded at historical cost. |
|
|
(7) |
Trading account assets are shown on a net basis and include issuer risk on cash products and derivative exposure where the underlying reference entity/issuer is located in that country. |
Argentina
As of December 31, 2017, Citi’s net investment in its Argentine operations was approximately $954 million, compared to $725 million at December 31, 2016.
Citi uses the Argentine peso as the functional currency in Argentina and translates its financial statements into U.S. dollars using the official exchange rate as published by the Central Bank of Argentina. The impact of devaluations of the Argentine peso on Citi’s net investment in Argentina, net of hedges, is reported as a translation loss in stockholders’ equity.
Although Citi currently uses the Argentine peso as the functional currency, an increase in inflation resulting in a cumulative three-year inflation rate of 100% or more would result in a change in the functional currency to the U.S. dollar. Citi has historically based its evaluation of the cumulative three-year inflation rate on the CPI (Consumer Price Index) inflation statistics published by INDEC, the Argentine government’s statistics agency. However, for the period from November 2015 to April 2016, INDEC did not publish CPI statistics, which has led to uncertainty about the cumulative three-year inflation rate. As of December 31, 2017, Citi evaluated the available CPI statistics as well as inflation statistics published by the Argentine Central Bank and concluded that Argentina’s cumulative three-year inflation rate had not reached 100%. However, uncertainty continues as to the cumulative three-year inflation rate, and additional information received in future periods could result in a change of functional currency to the U.S. dollar in 2018.
While a change in the functional currency to the U.S. dollar would not result in any immediate gains or losses to Citi, it would result in future changes in the translation of Citi’s Argentine peso-denominated assets and liabilities into U.S. dollars being recorded in earnings instead of stockholders’ equity.
FFIEC—Cross-Border Claims on Third Parties and Local Country Assets
Citi’s cross-border disclosures are based on the country exposure bank regulatory reporting guidelines of the Federal Financial Institutions Examination Council (FFIEC). The following summarizes some of the FFIEC key reporting guidelines:
|
|
• |
Amounts are based on the domicile of the ultimate obligor, counterparty, collateral, issuer or guarantor, as applicable. |
|
|
• |
Amounts do not consider the benefit of collateral received for secured financing transactions (i.e., repurchase agreements, reverse repurchase agreements and securities loaned and borrowed) and are reported based on notional amounts. |
|
|
• |
Netting of derivative receivables and payables, reported at fair value, is permitted, but only under a legally binding netting agreement with the same specific counterparty, and does not include the benefit of margin received or hedges. |
|
|
• |
The netting of long and short positions for AFS securities and trading portfolios is not permitted. |
|
|
• |
Credit default swaps (CDS) are included based on the gross notional amount sold and purchased and do not include any offsetting CDS on the same underlying entity. |
|
|
• |
Loans are reported without the benefit of hedges. |
Given the requirements noted above, Citi’s FFIEC cross-border exposures and total outstandings tend to fluctuate, in some cases, significantly, from period to period. As an example, because total outstandings under FFIEC guidelines do not include the benefit of margin or hedges, market volatility in interest rates, foreign exchange rates and credit spreads may cause significant fluctuations in the level of total outstandings, all else being equal.
The tables below set forth each country whose total outstandings exceeded 0.75% of total Citigroup assets:
|
|
|
|
|
|
|
|
|
|
|
|
|
|
|
|
|
|
|
|
|
|
|
|
|
|
|
|
|
|
|
|
|
December 31, 2017 |
|
Cross-border claims on third parties and local country assets |
In billions of U.S. dollars |
Banks (a) |
Public (a) |
NBFIs(1) (a)
|
Other (corporate
and households) (a)
|
Trading
assets(2) (included in (a))
|
Short-term claims(2) (included in (a))
|
Total outstanding(3) (sum of (a))
|
Commitments
and
guarantees(4)
|
Credit derivatives purchased(5)
|
Credit derivatives
sold(5)
|
United Kingdom |
$ |
17.3 |
|
$ |
23.2 |
|
$ |
36.4 |
|
$ |
19.4 |
|
$ |
13.5 |
|
$ |
62.4 |
|
$ |
96.3 |
|
$ |
32.3 |
|
$ |
74.9 |
|
$ |
77.1 |
|
Cayman Islands |
— |
|
— |
|
63.6 |
|
8.6 |
|
4.3 |
|
45.3 |
|
72.2 |
|
5.2 |
|
— |
|
— |
|
Germany |
6.9 |
|
38.3 |
|
9.3 |
|
11.8 |
|
10.2 |
|
45.4 |
|
66.2 |
|
12.1 |
|
54.6 |
|
54.1 |
|
Japan |
25.4 |
|
25.8 |
|
6.4 |
|
8.5 |
|
13.3 |
|
49.6 |
|
66.1 |
|
6.1 |
|
22.9 |
|
22.3 |
|
Mexico |
4.8 |
|
18.3 |
|
7.9 |
|
34.4 |
|
4.7 |
|
42.8 |
|
65.4 |
|
19.6 |
|
6.4 |
|
6.2 |
|
France |
14.3 |
|
5.1 |
|
21.1 |
|
6.1 |
|
8.7 |
|
37.2 |
|
46.6 |
|
23.6 |
|
59.8 |
|
60.6 |
|
South Korea |
2.5 |
|
15.8 |
|
1.9 |
|
24.4 |
|
1.4 |
|
38.3 |
|
44.6 |
|
16.7 |
|
14.4 |
|
12.4 |
|
Singapore |
1.9 |
|
22.5 |
|
4.3 |
|
15.0 |
|
0.4 |
|
33.6 |
|
43.7 |
|
10.9 |
|
1.8 |
|
1.8 |
|
India |
6.0 |
|
12.7 |
|
4.4 |
|
16.0 |
|
5.6 |
|
25.8 |
|
39.1 |
|
9.5 |
|
2.5 |
|
2.1 |
|
Australia |
4.6 |
|
8.2 |
|
4.7 |
|
15.0 |
|
7.3 |
|
19.3 |
|
32.5 |
|
13.2 |
|
13.2 |
|
13.3 |
|
China |
5.2 |
|
9.5 |
|
3.7 |
|
12.9 |
|
3.6 |
|
24.4 |
|
31.3 |
|
3.9 |
|
14.2 |
|
14.5 |
|
Hong Kong |
0.8 |
|
9.8 |
|
3.0 |
|
16.1 |
|
5.0 |
|
23.9 |
|
29.7 |
|
14.5 |
|
2.5 |
|
2.3 |
|
Brazil |
3.7 |
|
11.4 |
|
0.9 |
|
10.5 |
|
5.5 |
|
17.3 |
|
26.6 |
|
2.2 |
|
10.6 |
|
9.6 |
|
Netherlands |
5.8 |
|
9.5 |
|
4.9 |
|
6.1 |
|
4.1 |
|
15.9 |
|
26.3 |
|
9.8 |
|
27.3 |
|
27.8 |
|
Taiwan |
1.0 |
|
6.1 |
|
2.2 |
|
13.3 |
|
2.7 |
|
16.9 |
|
22.5 |
|
14.1 |
|
0.1 |
|
0.1 |
|
Canada |
4.3 |
|
4.7 |
|
7.8 |
|
4.9 |
|
2.9 |
|
11.1 |
|
21.7 |
|
13.3 |
|
5.4 |
|
6.2 |
|
Switzerland |
1.2 |
|
13.7 |
|
1.3 |
|
4.2 |
|
1.7 |
|
17.2 |
|
20.4 |
|
5.1 |
|
19.3 |
|
19.4 |
|
Italy |
3.3 |
|
11.3 |
|
0.6 |
|
1.3 |
|
7.5 |
|
9.3 |
|
16.5 |
|
2.7 |
|
59.6 |
|
58.4 |
|
|
|
|
|
|
|
|
|
|
|
|
|
|
|
|
|
|
|
|
|
|
|
|
|
|
|
|
|
|
|
|
|
|
December 31, 2016 |
|
Cross-border claims on third parties and local country assets
|
In billions of U.S. dollars |
Banks (a) |
Public (a) |
NBFIs(1) (a)
|
Other
(corporate
and households) (a)
|
Trading
assets(2) (included in (a))
|
Short-term claims(2) (included in (a))
|
Total outstanding(3) (sum of (a))
|
Commitments
and
guarantees(4)
|
Credit derivatives purchased(5)
|
Credit derivatives
sold(5)
|
United Kingdom |
$ |
15.0 |
|
$ |
18.1 |
|
$ |
35.3 |
|
$ |
20.0 |
|
$ |
8.7 |
|
$ |
47.7 |
|
$ |
88.4 |
|
$ |
23.2 |
|
$ |
81.8 |
|
$ |
82.9 |
|
Mexico |
6.4 |
|
18.3 |
|
7.7 |
|
30.7 |
|
4.5 |
|
29.9 |
|
63.1 |
|
17.0 |
|
7.3 |
|
6.7 |
|
Cayman Islands |
0.1 |
|
— |
|
55.6 |
|
3.8 |
|
1.3 |
|
35.5 |
|
59.5 |
|
2.9 |
|
0.4 |
|
0.1 |
|
Japan |
21.2 |
|
27.3 |
|
7.4 |
|
3.0 |
|
7.2 |
|
42.1 |
|
58.9 |
|
7.2 |
|
25.3 |
|
24.9 |
|
Germany |
7.9 |
|
26.7 |
|
8.8 |
|
6.7 |
|
4.2 |
|
28.3 |
|
50.1 |
|
12.9 |
|
65.4 |
|
63.5 |
|
France |
15.8 |
|
4.3 |
|
24.5 |
|
2.8 |
|
2.9 |
|
36.1 |
|
47.4 |
|
11.9 |
|
64.9 |
|
64.4 |
|
Korea |
2.2 |
|
15.4 |
|
0.8 |
|
21.6 |
|
1.4 |
|
32.1 |
|
40.0 |
|
16.4 |
|
11.0 |
|
9.4 |
|
Singapore |
2.6 |
|
17.4 |
|
2.4 |
|
14.3 |
|
1.1 |
|
28.2 |
|
36.7 |
|
11.9 |
|
1.5 |
|
1.4 |
|
India |
5.7 |
|
11.5 |
|
2.1 |
|
13.3 |
|
2.8 |
|
23.2 |
|
32.6 |
|
7.9 |
|
2.1 |
|
1.6 |
|
Brazil |
3.5 |
|
11.9 |
|
0.8 |
|
15.0 |
|
5.1 |
|
19.8 |
|
31.2 |
|
5.1 |
|
11.9 |
|
10.1 |
|
Australia |
6.2 |
|
7.4 |
|
4.5 |
|
12.3 |
|
6.0 |
|
14.3 |
|
30.4 |
|
11.8 |
|
17.5 |
|
17.2 |
|
China |
4.2 |
|
12.2 |
|
2.4 |
|
11.2 |
|
3.8 |
|
25.7 |
|
30.0 |
|
3.9 |
|
12.6 |
|
13.2 |
|
Netherlands |
8.8 |
|
9.9 |
|
6.2 |
|
4.4 |
|
2.1 |
|
14.2 |
|
29.3 |
|
7.7 |
|
29.5 |
|
29.3 |
|
Hong Kong |
0.9 |
|
10.3 |
|
2.7 |
|
13.4 |
|
4.9 |
|
24.4 |
|
27.3 |
|
12.9 |
|
2.3 |
|
1.9 |
|
Switzerland |
1.9 |
|
13.1 |
|
1.2 |
|
4.8 |
|
0.7 |
|
17.2 |
|
21.0 |
|
5.5 |
|
20.8 |
|
20.7 |
|
Canada |
4.2 |
|
4.5 |
|
5.8 |
|
6.2 |
|
2.2 |
|
8.9 |
|
20.7 |
|
13.9 |
|
6.6 |
|
6.8 |
|
Taiwan |
0.9 |
|
5.8 |
|
1.7 |
|
11.4 |
|
1.9 |
|
15.4 |
|
19.8 |
|
12.6 |
|
0.1 |
|
0.1 |
|
Italy |
2.4 |
|
8.5 |
|
1.3 |
|
1.0 |
|
3.8 |
|
5.9 |
|
13.2 |
|
2.7 |
|
66.0 |
|
63.6 |
|
|
|
(1) |
Non-bank financial institutions. |
|
|
(2) |
Included in total outstanding. |
|
|
(3) |
Total outstanding includes cross-border claims on third parties, as well as local country assets. Cross-border claims on third parties include cross-border loans, securities, deposits with banks and other monetary assets, as well as net revaluation gains on foreign exchange and derivative products. |
|
|
(4) |
Commitments (not included in total outstanding) include legally binding cross-border letters of credit and other commitments and contingencies as defined by the FFIEC guidelines. The FFIEC definition of commitments includes commitments to local residents to be funded with local currency liabilities originated within the country. |
|
|
(5) |
CDS are not included in total outstanding. |
SIGNIFICANT ACCOUNTING POLICIES AND SIGNIFICANT ESTIMATES
This section contains a summary of Citi’s most significant accounting policies and accounting standards that have been issued, but are not yet effective. Note 1 to the Consolidated Financial Statements contains a summary of Citigroup’s significant accounting policies, including a discussion of recently adopted accounting pronouncements. These policies, as well as estimates made by management, are integral to the presentation of Citi’s results of operations and financial condition. While all of these policies require a certain level of management judgment and estimates, this section highlights and discusses the significant accounting policies that require management to make highly difficult, complex or subjective judgments and estimates at times regarding matters that are inherently uncertain and susceptible to change (see also “Risk Factors—Operational Risks” above). Management has discussed each of these significant accounting policies, the related estimates and its judgments with the Audit Committee of the Citigroup Board of Directors.
Valuations of Financial Instruments
Citigroup holds debt and equity securities, derivatives, retained interests in securitizations, investments in private equity and other financial instruments. Substantially all of
these assets and liabilities are reflected at fair value on Citi’s
Consolidated Balance Sheet.
Citi purchases securities under agreements to
resell (reverse repos) and sells securities under agreements
to repurchase (repos), a majority of which are carried at
fair value. In addition, certain loans, short-term borrowings,
long-term debt and deposits, as well as certain securities
borrowed and loaned positions that are collateralized with
cash, are carried at fair value. Citigroup holds its investments, trading assets and liabilities, and resale and repurchase agreements on the Consolidated Balance Sheet to meet customer needs and to manage liquidity needs, interest rate risks and private equity investing.
When available, Citi generally uses quoted market prices to determine fair value and classifies such items within Level 1 of the fair value hierarchy established under ASC 820-10, Fair Value Measurement. If quoted market prices are not available, fair value is based upon internally developed valuation models that use, where possible, current market-based or independently sourced market parameters, such as interest rates, currency rates and option volatilities. Such models are often based on a discounted cash flow analysis. In addition, items valued using such internally generated valuation techniques are classified according to the lowest level input or value driver that is significant to the valuation. Thus, an item may be classified under the fair value hierarchy as Level 3 even though there may be some significant inputs that are readily observable.
Citi is required to exercise subjective judgments relating to the applicability and functionality of internal valuation models, the significance of inputs or value drivers to the valuation of an instrument and the degree of illiquidity and subsequent lack of observability in certain markets. These
judgments have the potential to impact the Company’s financial performance for instruments where the changes in fair value are recognized in either the Consolidated Statement of Income or in AOCI.
Moreover, for certain investments, decreases in fair value are only recognized in earnings in the Consolidated Statement of Income if such decreases are judged to be an other-than-temporary impairment (OTTI). Adjudicating the temporary nature of fair value impairments is also inherently judgmental.
The fair value of financial instruments incorporates the effects of Citi’s own credit risk and the market view of counterparty credit risk, the quantification of which is also complex and judgmental. For additional information on Citi’s fair value analysis, see Notes 1, 6, 24 and 25 to the Consolidated Financial Statements.
Allowance for Credit Losses
Management provides reserves for an estimate of probable losses inherent in the funded loan portfolio and in unfunded loan commitments and standby letters of credit on the Consolidated Balance Sheet in the Allowance for loan losses and in Other liabilities, respectively.
Estimates of these probable losses are based upon (i) Citigroup’s internal system of credit-risk ratings that are analogous to the risk ratings of the major credit rating agencies and (ii) historical default and loss data, including rating agency information regarding default rates from 1983 to 2016 and internal data dating to the early 1970s on severity of losses in the event of default. Adjustments may be made to this data, including (i) statistically calculated estimates to cover the historical fluctuation of the default rates over the credit cycle, the historical variability of loss severity among defaulted loans and the degree to which there are large obligor concentrations in the global portfolio and (ii) adjustments made for specifically known items, such as current environmental factors and credit trends.
In addition, representatives from both the risk management and finance staffs who cover business areas with delinquency-managed portfolios containing smaller balance homogeneous loans present their recommended reserve balances based upon leading credit indicators, including loan delinquencies and changes in portfolio size, as well as economic trends, including housing prices, unemployment and GDP. This methodology is applied separately for each individual product within each geographic region in which these portfolios exist.
This evaluation process is subject to numerous estimates and judgments. The frequency of default, risk ratings, loss recovery rates, the size and diversity of individual large credits and the ability of borrowers with foreign currency obligations to obtain the foreign currency necessary for orderly debt servicing, among other things, are all taken into account during this review. Changes in these estimates could have a direct impact on Citi’s credit costs and the allowance in any period.
For a further description of the loan loss reserve and related accounts, see Notes 1 and 15 to the Consolidated Financial Statements.
Goodwill
Citi tests goodwill for impairment annually on July 1 (the annual test) and between annual tests (the interim test) if an event occurs or circumstances change that would more-likely-than-not reduce the fair value of a reporting unit below its carrying amount, such as a significant adverse change in the business climate, a decision to sell or dispose of all or a significant portion of a reporting unit or a significant decline in Citi’s stock price. During 2017, annual and interim tests were performed, which resulted in no goodwill impairment as described in Note 16 to the Consolidated Financial Statements.
As of December 31, 2017, Citigroup’s activities are conducted through the Global Consumer Banking and Institutional Clients Group business segments and Corporate/Other. Goodwill impairment testing is performed at the level below the business segment (referred to as a reporting unit). Goodwill is recorded in a business combination under the acquisition method of accounting when the acquisition price is higher than the fair value of net assets, including identifiable intangible assets. At the time a business is acquired, goodwill is allocated to Citi’s applicable reporting units based on relative fair value. Once goodwill has been allocated to the reporting units, it generally no longer retains its identification with a particular acquisition, but instead becomes identified with the reporting unit as a whole. As a result, all of the fair value of each reporting unit is available to support the allocated goodwill. If any significant business reorganization occurs, Citi may reallocate the goodwill.
Consistent with prior years, Citi utilizes allocated equity as a proxy for the carrying value of its reporting units for purposes of goodwill impairment testing. The allocated equity in the reporting units is determined based on the capital the business would require if it were operating as a standalone entity, incorporating sufficient capital to be in compliance with regulatory capital requirements, including capital for specifically identified goodwill and intangible assets. The capital allocated to the businesses is incorporated into the annual budget process, which is approved by Citi’s Board of Directors.
Goodwill impairment testing involves management judgment, requiring an assessment of whether the carrying value of the reporting unit can be supported by the fair value of the reporting unit using widely accepted valuation techniques, such as the market approach (earnings multiples and/or transaction multiples) and/or the income approach (discounted cash flow (DCF) method). In applying these methodologies, Citi utilizes a number of factors, including actual operating results, future business plans, economic projections and market data.
Similar to 2016, Citigroup engaged an independent valuation specialist in 2017 to assist in Citi’s valuation for most of the reporting units employing both the market approach and the DCF method. For reporting units in which both methods were utilized in 2017, the resulting fair values
were relatively consistent and appropriate weighting was given to outputs from both methods.
The DCF method utilized at the time of each impairment test used discount rates that Citi believes adequately reflected the risk and uncertainty in the financial markets in the internally generated cash flow projections. The DCF method employs a capital asset pricing model in estimating the discount rate.
Since none of the Company’s reporting units are publicly traded, individual reporting unit fair-value determinations cannot be directly correlated to Citigroup’s common stock price. The sum of the fair values of the reporting units exceeded the overall market capitalization of Citi as of July 1, 2017. However, Citi believes that it is not meaningful to reconcile the sum of the fair values of the Company’s reporting units to its market capitalization due to several factors. The market capitalization of Citigroup reflects the execution risk in a transaction involving Citigroup due to its size. However, the individual reporting units’ fair values are not subject to the same level of execution risk nor a business model that is perceived to be as complex. In addition, the market capitalization of Citigroup does not include consideration of the individual reporting unit’s control premium.
See Note 16 to the Consolidated Financial Statements for additional information on goodwill, including the changes in the goodwill balance year-over-year and the reporting unit goodwill balances as of December 31, 2017.
Income Taxes
Overview
Citi is subject to the income tax laws of the U.S., its states and local municipalities and the non-U.S. jurisdictions in which Citi operates. These tax laws are complex and are subject to differing interpretations by the taxpayer and the relevant governmental taxing authorities. Disputes over interpretations of the tax laws may be subject to review and adjudication by the court systems of the various tax jurisdictions or may be settled with the taxing authority upon audit.
In establishing a provision for income tax expense, Citi must make judgments and interpretations about the application of these inherently complex tax laws. Citi must also make estimates about when in the future certain items will affect taxable income in the various tax jurisdictions, both domestic and foreign. Deferred taxes are recorded for the future consequences of events that have been recognized in the financial statements or tax returns, based upon enacted tax laws and rates. Deferred tax assets (DTAs) are recognized subject to management’s judgment that realization is more-likely-than-not.
On December 22, 2017, the President signed the Tax Cuts and Jobs Act (Tax Reform), reflecting many of the anticipated changes to U.S. corporate taxation, including a lower statutory tax rate of 21%, a quasi-territorial regime and a deemed repatriation of all accumulated earnings and profits of foreign subsidiaries. The new law was generally effective January 1, 2018.
Citi recorded a charge to continuing operations of $22.6 billion in the fourth quarter of 2017, composed of a $12.4 billion remeasurement due to the reduction to the U.S. corporate tax rate and a change to a quasi- territorial tax system, a $7.9 billion valuation allowance against Citi’s FTC carry-forwards and its U.S. residual DTAs related to its non-U.S. branches, and a $2.3 billion reduction in Citi’s FTC carry-forwards related to the deemed repatriation of undistributed earnings of non-U.S. subsidiaries. Quasi-territorial refers to the continued U.S. taxation of non-U.S. branches, with a separate FTC basket for branches, and the application of Global Intangible Low Taxed Income (GILTI) provisions to intangible income (e.g., services income) of non-U.S. subsidiaries. The valuation allowance against FTCs results from the impact of the lower tax rate and the new separate FTC basket for non-U.S. branches, as well as diminished ability under Tax Reform to generate income from sources outside the U.S. to support FTC utilization. Some of the components of the charge are provisional amounts as defined in SAB 118 and therefore will be revised in 2018. For additional information, see Note 1 to the Consolidated Financial Statements.
Citi has an overall domestic loss (ODL) of approximately $52 billion. An ODL allows a company to recharacterize domestic income as income from sources outside the U.S., which enables a taxpayer to use FTC carry-forwards and FTCs generated in future years, assuming the generation of sufficient U.S. taxed income. The change in Tax Reform to allow a taxpayer to elect to recharacterize up to 100% of its domestic source income as non-U.S. source income (up from 50%) is not expected to materially impact the valuation allowance.
Beginning in 2018, Citi will be taxed on income generated by its U.S. operations at a federal tax rate of 21%. The effect on its state tax rate is dependent upon how and when the individual states choose to or automatically adopt the various new provisions of the U.S. Internal Revenue Code.
Citi’s non-U.S. branches and subsidiaries will be subject to tax at their local tax rates. While non-U.S. branches continue to be subject to U.S. taxation, Citi expects no material residual U.S. tax on such earnings since its overall non-U.S. branch tax rate is in excess of 21%. With respect to non-U.S. subsidiaries, dividends from these subsidiaries will be excluded from U.S. taxation. While Citi expects that the majority of its non-U.S. subsidiary earnings may be classified as GILTI, it similarly expects no material residual U.S. tax on such earnings based on its non-U.S. subsidiaries’ local tax rates, which exceed, on average, the GILTI tax rate. Although Citi is still in the process of analyzing the provisions of Tax Reform associated with GILTI, it does not expect a material change in impact. Finally, Citi does not expect the BEAT (Base Erosion Anti-Abuse Tax) to affect its tax provision.
Citi expects that its effective tax rate will be roughly 25% in 2018 with the possibility of lower effective tax rates in subsequent years.
DTAs
At December 31, 2017, Citi had net DTAs of $22.5 billion. In the fourth quarter of 2017, Citi’s DTAs decreased by $23.0 billion, driven primarily by the remeasurement related to Tax Reform and by earnings, partially offset by an increase in AOCI. On a full-year basis, Citi’s DTAs decreased $24.2 billion from $46.7 billion at December 31, 2016. The decrease in total DTAs year-over-year was primarily due to Tax Reform and earnings, partially offset by an increase in AOCI.
Citi expects that the absolute amount of its $5.7 billion valuation allowance against FTC carry-forwards may grow in future years as it generates additional FTCs relating to its non-U.S. branches due to their higher overall local tax rate reduced by the statutory expiration of FTC carry-forwards. With respect to the portion of the valuation allowance established on its FTC carry-forwards that are available for use in the general basket, changes in the amount of earnings from sources outside the U.S. could alter the amount of valuation allowance that is eventually needed against such FTCs.
FTCs comprised approximately $7.6 billion of Citi’s DTAs as of December 31, 2017, compared to approximately $14.2 billion as of December 31, 2016. The decrease in FTCs year-over-year was primarily due to the use of FTCs against the deemed repatriation under Tax Reform, the valuation allowance established as a result of the reduced future corporate tax rate and the change to a quasi-territorial tax system. This represented $6.6 billion of the $24.2 billion decrease in Citi’s overall DTAs noted above. The FTC carry-forward periods represent the most time-sensitive component of Citi’s DTAs.
Citi believes the U.S. federal and New York state and city net operating loss carry-forward period of 20 years provides enough time to fully utilize the net DTAs pertaining to the existing net operating loss carry-forwards. This is due to Citi’s forecast of sufficient U.S. taxable income and the continued taxation of Citi’s non-U.S. income by New York state and city. Although realization is not assured, Citi believes that the realization of the recognized net DTAs of $22.5 billion at December 31, 2017 is more-likely-than-not, based upon management’s expectations as to future taxable income in the jurisdictions in which the DTAs arise as well as available tax planning strategies (as defined in ASC Topic 740, Income Taxes) that would be implemented, if necessary, to prevent a carry-forward from expiring. Citi has concluded that it has the necessary positive evidence to support the realization of its net DTAs after taking its valuation allowances into consideration.
For additional information on Citi’s income taxes, including its income tax provision, tax assets and liabilities, and a tabular summary of Citi’s net DTAs balance as of December 31, 2017 (including the FTCs and applicable expiration dates of the FTCs), see Note 9 to the Consolidated Financial Statements. For additional discussion of the potential impact to Citi’s DTAs that could arise from Tax Reform, see “Risk Factors—Strategic Risks” above.
Litigation Accruals
See the discussion in Note 27 to the Consolidated Financial Statements for information regarding Citi’s policies on establishing accruals for litigation and regulatory contingencies.
FUTURE APPLICATION OF ACCOUNTING STANDARDS
Accounting for Financial Instruments—Credit Losses
In June 2016, the FASB issued ASU No. 2016-13, Financial Instruments—Credit Losses (Topic 326). The ASU introduces a new credit loss methodology, Current Expected Credit Losses (CECL), which requires earlier recognition of credit losses, while also providing additional transparency about credit risk.
The CECL methodology utilizes a lifetime “expected credit loss” measurement objective for the recognition of credit losses for loans, held-to-maturity securities and other receivables at the time the financial asset is originated or acquired. The expected credit losses are adjusted each period for changes in expected lifetime credit losses. This methodology replaces the multiple existing impairment methods in current GAAP, which generally require that a loss be incurred before it is recognized. For available-for-sale securities where fair value is less than cost, credit-related impairment, if any, will be recognized through an allowance for credit losses and adjusted each period for changes in credit risk.
The CECL methodology represents a significant change from existing GAAP and may result in material changes to the Company’s accounting for financial instruments. The Company is evaluating the effect that ASU 2016-13 will have on its Consolidated Financial Statements and related disclosures. The impact of the ASU will depend upon the state of the economy and the nature of Citi’s portfolios at the date of adoption. Based on a preliminary analysis performed in 2017 and the environment and portfolios at that time, the overall impact was estimated to be an approximate 10% to 20% increase in credit reserves as of that time. Moreover, there are still some implementation questions that will need to be resolved that could affect the estimated impact. The ASU will be effective for Citi as of January 1, 2020.
Revenue Recognition
In May 2014, the FASB issued ASU No. 2014-09, Revenue from Contracts with Customers, which requires an entity to recognize the amount of revenue to which it expects to be entitled for the transfer of promised goods or services to customers. The Company adopted the guidance as of January 1, 2018 using full retrospective application for all periods presented. There is no material change in timing and amount of revenue recognized associated with the adoption.
The new standard clarified the guidance related to reporting revenue gross as a principal versus net as an agent. The Company has identified transactions, including underwriting activity where Citi is deemed the principal, rather than the agent, which require a gross up of annual revenues and expenses of approximately $1.0 billion. This
change in presentation will not have an impact on Income from continuing operations; however, this standard would have increased Citi’s efficiency ratio by approximately 57 bps for the year ended December 31, 2017. The impact for 2018 is expected to be consistent with 2017.
Lease Accounting
In February 2016, the FASB issued ASU No. 2016-02, Leases (Topic 842), which is intended to increase transparency and comparability of accounting for lease transactions. The ASU will require lessees to recognize leases on the balance sheet as lease assets and lease liabilities and will require both quantitative and qualitative disclosures regarding key information about leasing arrangements. Lessor accounting is largely unchanged. The guidance is effective beginning January 1, 2019 with an option to early adopt. The Company does not plan to early adopt the ASU. The Company estimates that upon adoption, its Consolidated Balance Sheet will have an approximate $5 billion increase in assets and liabilities. Additionally, the Company estimates an approximate $200 million increase in retained earnings due to the cumulative effect of recognizing previously deferred gains on sale/leaseback transactions.
Income Tax Impact of Intra-Entity Transfers of Assets
In October 2016, the FASB issued ASU No. 2016-16, Income Taxes—Intra-Entity Transfers of Assets Other Than Inventory, which requires an entity to recognize the income tax consequences of an intra-entity transfer of an asset other than inventory when the transfer occurs. The ASU was effective January 1, 2018. The impact of this standard upon adoption is an increase of DTAs by approximately $0.2 billion, a decrease of retained earnings by approximately $0.2 billion and a decrease of prepaid tax assets by approximately $0.4 billion.
Subsequent Measurement of Goodwill
In January 2017, the FASB issued ASU No. 2017-04, Intangibles—Goodwill and Other (Topic 350): Simplifying the Test for Goodwill Impairment. The ASU simplifies the subsequent measurement of goodwill impairment by eliminating the requirement to calculate the implied fair value of goodwill (i.e., the current Step 2 of the goodwill impairment test) to measure a goodwill impairment charge. Under the ASU, the impairment test is the comparison of the fair value of a reporting unit with its carrying amount (the current Step 1), with the impairment charge being the deficit in fair value but not exceeding the total amount of goodwill allocated to that reporting unit. The simplified one-step impairment test applies to all reporting units (including those with zero or negative carrying amounts).
The ASU will be effective for Citi as of January 1, 2020, with early adoption permitted. The impact of the ASU will depend upon the performance of the reporting units and the market conditions impacting the fair value of each reporting unit going forward.
Clarifying the Definition of a Business
In January 2017, the FASB issued ASU No. 2017-01, Business Combinations (Topic 805): Clarifying the Definition of a Business. The definition of a business directly and indirectly affects many areas of accounting (e.g., acquisitions, disposals, goodwill and consolidation). The ASU narrows the definition of a business by introducing a quantitative screen as the first step, such that if substantially all of the fair value of the gross assets acquired is concentrated in a single identifiable asset or a group of similar identifiable assets, the set of transferred assets and activities is not a business. If the set is not scoped out from the quantitative screen, the entity then evaluates whether the set meets the requirement that a business include, at a minimum, an input and a substantive process that together significantly contribute to the ability to create outputs.
The ASU was effective for public entities, including Citi, as of January 1, 2018 with prospective application. The impact of the ASU will depend upon the acquisition and disposal activities of Citi. If fewer transactions qualify as a business, there could be less initial recognition of goodwill, but also less goodwill allocated to disposals.
Changes in Accounting for Pension and Postretirement (Benefit) Expense
In March 2017, the FASB issued ASU No. 2017-07, Compensation—Retirement Benefits (Topic 715): Improving the Presentation of Net Periodic Pension Cost and Net Periodic Postretirement Benefit Cost, which changes the income statement presentation of net benefit expense and requires restating the Company’s financial statements for each of the earlier periods presented in Citi’s annual and interim financial statements. The change in presentation was effective for annual and interim periods starting January 1, 2018. The ASU requires that only the service cost component of net benefit expense be included in Compensation and benefits on the income statement. The other components of net benefit expense will be required to be presented outside of Compensation and benefits and will be presented in Other operating expense. Since both of these income statement line items are part of Operating expenses, total Operating expenses will not change, nor will there be any change in Net income. This change in presentation is not expected to have a material effect on Compensation and benefits and Other operating expenses and will be applied prospectively. The components of the net benefit expense are currently disclosed in Note 7 to the Consolidated Financial Statements.
The new standard also changes the components of net benefit expense that are eligible for capitalization when employee costs are capitalized in connection with various activities, such as internally developed software, construction-in-progress, and loan origination costs. Prospectively from January 1, 2018, only the service cost component of net benefit expense may be capitalized. Existing capitalized balances are not affected. This change in amounts eligible for capitalization is not expected to have a material effect on the Company’s Consolidated Financial Statements and related disclosures.
Hedging
In August 2017, the FASB issued ASU No. 2017-12, Targeted Improvements to Accounting for Hedging Activities, which will better align an entity’s risk management activities and financial reporting for hedging relationships through changes to the designation and measurement guidance for qualifying hedging relationships and the presentation of hedge results. The mandatory effective date for calendar year-end public companies is January 1, 2019, but the amendments may be early adopted in any interim or annual period after issuance. The targeted improvements in the ASU will allow Citi increased flexibility to structure hedges of fixed- and floating-rate instruments and will allow a one-time transfer of certain pre-payable debt securities from HTM to AFS. Application of the ASU is expected to better reflect the economics of Citi’s risk management activities and will also reduce the volatility associated with foreign currency hedging. The ASU requires the change in the fair value of the hedging instrument to be presented in the same income statement line as the hedged item and also requires expanded disclosures. Citi adopted this standard on January 1, 2018 and transferred approximately $4 billion of HTM securities into AFS classification as permitted as a one-time transfer under the standard. The impact to opening retained earnings was immaterial.
See Note 1 to the Consolidated Financial Statements for a discussion of “Accounting Changes.”
DISCLOSURE CONTROLS AND PROCEDURES
Citi’s disclosure controls and procedures are designed to ensure that information required to be disclosed under the Securities Exchange Act of 1934, as amended, is recorded, processed, summarized and reported within the time periods specified in the SEC’s rules and forms, including without limitation that information required to be disclosed by Citi in its SEC filings is accumulated and communicated to management, including the Chief Executive Officer (CEO) and Chief Financial Officer (CFO), as appropriate, to allow for timely decisions regarding required disclosure.
Citi’s Disclosure Committee assists the CEO and CFO in their responsibilities to design, establish, maintain and evaluate the effectiveness of Citi’s disclosure controls and procedures. The Disclosure Committee is responsible for, among other things, the oversight, maintenance and implementation of the disclosure controls and procedures, subject to the supervision and oversight of the CEO and CFO.
Citi’s management, with the participation of its CEO and CFO, has evaluated the effectiveness of Citigroup’s disclosure controls and procedures (as defined in Rule 13a-15(e) under the Securities Exchange Act of 1934) as of December 31, 2017 and, based on that evaluation, the CEO and CFO have concluded that at that date, Citigroup’s disclosure controls and procedures were effective.
MANAGEMENT’S ANNUAL REPORT ON INTERNAL CONTROL OVER FINANCIAL REPORTING
Citi’s management is responsible for establishing and maintaining adequate internal control over financial reporting. Citi’s internal control over financial reporting is designed to provide reasonable assurance regarding the reliability of its financial reporting and the preparation of financial statements for external reporting purposes in accordance with U.S. generally accepted accounting principles. Citi’s internal control over financial reporting includes those policies and procedures that (i) pertain to the maintenance of records that in reasonable detail accurately and fairly reflect the transactions and dispositions of Citi’s assets, (ii) provide reasonable assurance that transactions are recorded as necessary to permit preparation of financial statements in accordance with generally accepted accounting principles and that Citi’s receipts and expenditures are made only in accordance with authorizations of Citi’s management and directors and (iii) provide reasonable assurance regarding prevention or timely detection of unauthorized acquisition, use or disposition of Citi’s assets that could have a material effect on its financial statements.
Because of its inherent limitations, internal control over financial reporting may not prevent or detect all misstatements. Also, projections of any evaluation of effectiveness to future periods are subject to the risk that controls may become inadequate because of changes in conditions or that the degree of compliance with the policies or procedures may deteriorate. In addition, given Citi’s large size, complex operations and global footprint, lapses or deficiencies in internal controls may occur from time to time.
Citi’s management assessed the effectiveness of Citigroup’s internal control over financial reporting as of December 31, 2017 based on the criteria set forth by the Committee of Sponsoring Organizations of the Treadway Commission (COSO) in Internal Control-Integrated Framework (2013). Based on this assessment, management believes that, as of December 31, 2017, Citi’s internal control over financial reporting was effective. In addition, there were no changes in Citi’s internal control over financial reporting during the fiscal quarter ended December 31, 2017 that materially affected, or are reasonably likely to materially affect, Citi’s internal control over financial reporting.
The effectiveness of Citi’s internal control over financial reporting as of December 31, 2017 has been audited by KPMG LLP, Citi’s independent registered public accounting firm, as stated in their report below, which expressed an unqualified opinion on the effectiveness of Citi’s internal control over financial reporting as of December 31, 2017.
FORWARD-LOOKING STATEMENTS
Certain statements in this Form 10-K, including but not limited to statements included within the Management’s Discussion and Analysis of Financial Condition and Results of Operations, are “forward-looking statements” within the meaning of the rules and regulations of the U.S. Securities and Exchange Commission (SEC). In addition, Citigroup also may make forward-looking statements in its other documents filed or furnished with the SEC and its management may make forward-looking statements orally to analysts, investors, representatives of the media and others.
Generally, forward-looking statements are not based on historical facts, but instead represent Citigroup’s and its management’s beliefs regarding future events. Such statements may be identified by words such as believe, expect, anticipate, intend, estimate, may increase, may fluctuate, target, illustrate, and similar expressions or future or conditional verbs such as will, should, would and could.
Such statements are based on management’s current expectations and are subject to risks, uncertainties and changes in circumstances. Actual results and capital and other financial conditions may differ materially from those included in these statements due to a variety of factors, including, without limitation, (i) the precautionary statements included within each individual business’s discussion and analysis of its results of operations and (ii) the factors listed and described under “Risk Factors” above.
Any forward-looking statements made by or on behalf of Citigroup speak only as to the date they are made and Citi does not undertake to update forward-looking statements to reflect the impact of circumstances or events that arise after the date the forward-looking statements were made.
REPORT OF INDEPENDENT REGISTERED PUBLIC ACCOUNTING FIRM—
INTERNAL CONTROL OVER FINANCIAL REPORTING
The Board of Directors and Stockholders
Citigroup Inc.:
Opinion on Internal Control Over Financial Reporting
We have audited Citigroup Inc. and subsidiaries’ (the “Company”) internal control over financial reporting as of December 31, 2017, based on criteria established in Internal Control - Integrated Framework (2013) issued by the Committee of Sponsoring Organizations of the Treadway Commission. In our opinion, the Company maintained, in all material respects, effective internal control over financial reporting as of December 31, 2017, based on criteria established in Internal Control - Integrated Framework (2013) issued by the Committee of Sponsoring Organizations of the Treadway Commission.
We also have audited, in accordance with the standards of the Public Company Accounting Oversight Board (United States) (“PCAOB”), the consolidated balance sheet of the Company as of December 31, 2017 and 2016, the related consolidated statements of income, comprehensive income, stockholders’ equity, and cash flows for each of the years in the three-year period ended December 31, 2017, and the related notes (collectively, the “consolidated financial statements”), and our report dated February 23, 2018 expressed an unqualified opinion on those consolidated financial statements.
Basis for Opinion
The Company’s management is responsible for maintaining effective internal control over financial reporting and for its assessment of the effectiveness of internal control over financial reporting, included in the accompanying management’s annual report on internal control over financial reporting. Our responsibility is to express an opinion on the Company’s internal control over financial reporting based on our audit. We are a public accounting firm registered with the PCAOB and are required to be independent with respect to the Company in accordance with the U.S. federal securities laws and the applicable rules and regulations of the Securities and Exchange Commission and the PCAOB.
We conducted our audit in accordance with the standards of the PCAOB. Those standards require that we plan and perform the audit to obtain reasonable assurance about whether effective internal control over financial reporting was maintained in all material respects. Our audit of internal control over financial reporting included obtaining an understanding of internal control over financial reporting, assessing the risk that a material weakness exists, and testing and evaluating the design and operating effectiveness of internal control based on the assessed risk. Our audit also included performing such other procedures as we considered necessary in the circumstances. We believe that our audit provides a reasonable basis for our opinion.
Definition and Limitations of Internal Control Over Financial Reporting
A company’s internal control over financial reporting is a process designed to provide reasonable assurance regarding the reliability of financial reporting and the preparation of financial statements for external purposes in accordance with generally accepted accounting principles. A company’s internal control over financial reporting includes those policies and procedures that (1) pertain to the maintenance of records that, in reasonable detail, accurately and fairly reflect the transactions and dispositions of the assets of the company; (2) provide reasonable assurance that transactions are recorded as necessary to permit preparation of financial statements in accordance with generally accepted accounting principles, and that receipts and expenditures of the company are being made only in accordance with authorizations of management and directors of the company; and (3) provide reasonable assurance regarding prevention or timely detection of unauthorized acquisition, use, or disposition of the company’s assets that could have a material effect on the financial statements.
Because of its inherent limitations, internal control over financial reporting may not prevent or detect misstatements. Also, projections of any evaluation of effectiveness to future periods are subject to the risk that controls may become inadequate because of changes in conditions, or that the degree of compliance with the policies or procedures may deteriorate.
/s/ KPMG LLP
New York, New York
February 23, 2018
REPORT OF INDEPENDENT REGISTERED PUBLIC ACCOUNTING FIRM—
CONSOLIDATED FINANCIAL STATEMENTS
The Board of Directors and Stockholders
Citigroup Inc.:
Opinion on the Consolidated Financial Statements
We have audited the accompanying consolidated balance sheet of Citigroup Inc. and subsidiaries (the “Company”) as of December 31, 2017 and 2016, and the related consolidated statements of income, comprehensive income, changes in stockholders’ equity and cash flows for each of the years in the three-year period ended December 31, 2017, and the related notes (collectively, the “consolidated financial statements”). In our opinion, the consolidated financial statements present fairly, in all material respects, the financial position of the Company as of December 31, 2017 and 2016, and the results of its operations and its cash flows for each of the years in the three-year period ended December 31, 2017, in conformity with U.S. generally accepted accounting principles.
We also have audited, in accordance with the standards of the Public Company Accounting Oversight Board (United States) (“PCAOB”), the Company’s internal control over financial reporting as of December 31, 2017, based on criteria established in Internal Control-Integrated Framework (2013) issued by the Committee of Sponsoring Organizations of the Treadway Commission, and our report dated February 23, 2018 expressed an unqualified opinion on the effectiveness of the Company’s internal control over financial reporting.
Basis for Opinion
These consolidated financial statements are the responsibility of the Company’s management. Our responsibility is to express an opinion on these consolidated financial statements based on our audits. We are a public accounting firm registered with the PCAOB and are required to be independent with respect to the Company in accordance with the U.S. federal securities laws and the applicable rules and regulations of the Securities and Exchange Commission and the PCAOB.
We conducted our audits in accordance with the standards of the PCAOB. Those standards require that we plan and perform the audit to obtain reasonable assurance about whether the consolidated financial statements are free of material misstatement, whether due to error or fraud. Our audits included performing procedures to assess the risks of material misstatement of the consolidated financial statements, whether due to error or fraud, and performing procedures that respond to those risks. Such procedures included examining, on a test basis, evidence supporting the amounts and disclosures in the consolidated financial statements. Our audits also included evaluating the accounting principles used and significant estimates made by management, as well as evaluating the overall presentation of the consolidated financial statements. We believe that our audits provide a reasonable basis for our opinion.
/s/ KPMG LLP
We have served as the Company’s auditor since 1969.
New York, New York
February 23, 2018
FINANCIAL STATEMENTS AND NOTES TABLE OF CONTENTS
|
|
|
CONSOLIDATED FINANCIAL STATEMENTS |
|
|
Consolidated Statement of Income—
For the Years Ended December 31, 2017, 2016 and 2015
|
|
|
Consolidated Statement of Comprehensive Income—
For the Years Ended December 31, 2017, 2016 and 2015
|
|
Consolidated Balance Sheet—December 31, 2017 and 2016 |
|
Consolidated Statement of Changes in Stockholders’ Equity—For the Years Ended December 31, 2017, 2016 and 2015 |
|
|
Consolidated Statement of Cash Flows—
For the Years Ended December 31, 2017, 2016 and 2015
|
|
|
|
|
NOTES TO CONSOLIDATED FINANCIAL STATEMENTS |
|
Note 1—Summary of Significant Accounting Policies |
|
Note 2—Discontinued Operations and Significant Disposals |
|
Note 3—Business Segments |
|
Note 4—Interest Revenue and Expense |
|
Note 5—Commissions and Fees |
|
Note 6—Principal Transactions |
|
Note 7—Incentive Plans |
|
Note 8—Retirement Benefits |
|
Note 9—Income Taxes |
|
Note 10—Earnings per Share |
|
Note 11—Federal Funds, Securities Borrowed, Loaned and
Subject to Repurchase Agreements |
|
Note 12—Brokerage Receivables and Brokerage Payables |
|
Note 13—Investments |
|
Note 14—Loans |
|
Note 15—Allowance for Credit Losses |
|
|
|
|
|
|
Note 16—Goodwill and Intangible Assets |
|
Note 17—Debt |
|
Note 18—Regulatory Capital |
|
Note 19—Changes in Accumulated Other Comprehensive
Income (Loss) (AOCI) |
|
Note 20—Preferred Stock |
|
Note 21—Securitizations and Variable Interest Entities |
|
Note 22—Derivatives Activities |
|
Note 23—Concentrations of Credit Risk |
|
Note 24—Fair Value Measurement |
|
Note 25—Fair Value Elections |
|
|
Note 26—Pledged Assets, Collateral, Guarantees and
Commitments
|
|
Note 27—Contingencies |
|
Note 28—Condensed Consolidating Financial Statements |
|
Note 29—Selected Quarterly Financial Data (Unaudited) |
|
CONSOLIDATED FINANCIAL STATEMENTS
|
CONSOLIDATED STATEMENT OF INCOME Citigroup Inc. and Subsidiaries
|
|
|
|
|
|
|
|
|
|
|
|
Years ended December 31, |
In millions of dollars, except per share amounts |
2017 |
2016 |
2015 |
Revenues(1)
|
|
|
|
|
|
|
Interest revenue |
$ |
61,204 |
|
$ |
57,615 |
|
$ |
58,551 |
|
Interest expense |
16,517 |
|
12,511 |
|
11,921 |
|
Net interest revenue |
$ |
44,687 |
|
$ |
45,104 |
|
$ |
46,630 |
|
Commissions and fees |
$ |
12,939 |
|
$ |
11,938 |
|
$ |
14,485 |
|
Principal transactions |
9,168 |
|
7,585 |
|
6,008 |
|
Administration and other fiduciary fees |
3,079 |
|
2,783 |
|
2,856 |
|
Realized gains on sales of investments, net |
778 |
|
948 |
|
682 |
|
Other-than-temporary impairment losses on investments |
|
|
|
|
|
|
Gross impairment losses |
(63 |
) |
(620 |
) |
(265 |
) |
Less: Impairments recognized in AOCI |
— |
|
— |
|
— |
|
Net impairment losses recognized in earnings |
$ |
(63 |
) |
$ |
(620 |
) |
$ |
(265 |
) |
Other revenue |
$ |
861 |
|
$ |
2,137 |
|
$ |
5,958 |
|
Total non-interest revenues |
$ |
26,762 |
|
$ |
24,771 |
|
$ |
29,724 |
|
Total revenues, net of interest expense |
$ |
71,449 |
|
$ |
69,875 |
|
$ |
76,354 |
|
Provisions for credit losses and for benefits and claims |
|
|
|
|
|
|
Provision for loan losses |
$ |
7,503 |
|
$ |
6,749 |
|
$ |
7,108 |
|
Policyholder benefits and claims |
109 |
|
204 |
|
731 |
|
Provision (release) for unfunded lending commitments |
(161 |
) |
29 |
|
74 |
|
Total provisions for credit losses and for benefits and claims |
$ |
7,451 |
|
$ |
6,982 |
|
$ |
7,913 |
|
Operating expenses(1)
|
|
|
|
|
|
|
Compensation and benefits |
$ |
21,181 |
|
$ |
20,970 |
|
$ |
21,769 |
|
Premises and equipment |
2,453 |
|
2,542 |
|
2,878 |
|
Technology/communication |
6,891 |
|
6,685 |
|
6,581 |
|
Advertising and marketing |
1,608 |
|
1,632 |
|
1,547 |
|
Other operating |
9,104 |
|
9,587 |
|
10,840 |
|
Total operating expenses |
$ |
41,237 |
|
$ |
41,416 |
|
$ |
43,615 |
|
Income from continuing operations before income taxes |
$ |
22,761 |
|
$ |
21,477 |
|
$ |
24,826 |
|
Provision for income taxes (benefits) |
29,388 |
|
6,444 |
|
7,440 |
|
Income (loss) from continuing operations |
$ |
(6,627 |
) |
$ |
15,033 |
|
$ |
17,386 |
|
Discontinued operations |
|
|
|
|
|
|
Loss from discontinued operations |
$ |
(104 |
) |
$ |
(80 |
) |
$ |
(83 |
) |
Provision (benefit) for income taxes |
7 |
|
(22 |
) |
(29 |
) |
Loss from discontinued operations, net of taxes |
$ |
(111 |
) |
$ |
(58 |
) |
$ |
(54 |
) |
Net income (loss) before attribution of noncontrolling interests |
$ |
(6,738 |
) |
$ |
14,975 |
|
$ |
17,332 |
|
Noncontrolling interests |
60 |
|
63 |
|
90 |
|
Citigroup’s net income (loss) |
$ |
(6,798 |
) |
$ |
14,912 |
|
$ |
17,242 |
|
Basic earnings per share(2)
|
|
|
|
|
|
|
Income (loss) from continuing operations
|
$ |
(2.94 |
) |
$ |
4.74 |
|
$ |
5.43 |
|
Loss from discontinued operations, net of taxes |
(0.04 |
) |
(0.02 |
) |
(0.02 |
) |
Net income (loss) |
$ |
(2.98 |
) |
$ |
4.72 |
|
$ |
5.41 |
|
Weighted average common shares outstanding |
2,698.5 |
|
2,888.1 |
|
3,004.0 |
|
|
CONSOLIDATED STATEMENT OF INCOME Citigroup Inc. and Subsidiaries
|
|
|
|
|
|
|
|
|
|
|
Diluted earnings per share(2)
|
|
|
|
|
|
|
Income (loss) from continuing operations
|
$ |
(2.94 |
) |
$ |
4.74 |
|
$ |
5.42 |
|
Income (loss) from discontinued operations, net of taxes |
(0.04 |
) |
(0.02 |
) |
(0.02 |
) |
Net income (loss) |
$ |
(2.98 |
) |
$ |
4.72 |
|
$ |
5.40 |
|
Adjusted weighted average common shares outstanding |
2,698.5 |
|
2,888.3 |
|
3,007.7 |
|
|
|
(1) |
Certain prior-period revenue and expense lines and totals were reclassified to conform to the current period’s presentation. See Note 3 to the Consolidated Financial Statements.
|
|
|
(2) |
Due to rounding, earnings per share on continuing operations and discontinued operations may not sum to earnings per share on net income. |
The Notes to the Consolidated Financial Statements are an integral part of these Consolidated Financial Statements.
|
|
|
|
CONSOLIDATED STATEMENT OF COMPREHENSIVE INCOME |
|
Citigroup Inc. and Subsidiaries |
|
|
|
|
|
|
|
|
|
|
|
|
Years ended December 31, |
In millions of dollars |
2017 |
2016 |
2015 |
Citigroup’s net income (loss) |
$ |
(6,798 |
) |
$ |
14,912 |
|
$ |
17,242 |
|
Add: Citigroup’s other comprehensive income (loss) |
|
|
|
|
|
|
Net change in unrealized gains and losses on investment securities, net of taxes |
$ |
(863 |
) |
$ |
108 |
|
$ |
(964 |
) |
Net change in debt valuation adjustment (DVA), net of taxes(1)
|
(569 |
) |
(337 |
) |
— |
|
Net change in cash flow hedges, net of taxes |
(138 |
) |
57 |
|
292 |
|
Benefit plans liability adjustment, net of taxes(2)
|
(1,019 |
) |
(48 |
) |
43 |
|
Net change in foreign currency translation adjustment, net of taxes and hedges |
(202 |
) |
(2,802 |
) |
(5,499 |
) |
Citigroup’s total other comprehensive income (loss)(3)
|
$ |
(2,791 |
) |
$ |
(3,022 |
) |
$ |
(6,128 |
) |
|
Citigroup’s total comprehensive income (loss)
|
$ |
(9,589 |
) |
$ |
11,890 |
|
$ |
11,114 |
|
Add: Other comprehensive income (loss) attributable to noncontrolling interests |
$ |
114 |
|
$ |
(56 |
) |
$ |
(83 |
) |
Add: Net income attributable to noncontrolling interests |
60 |
|
63 |
|
90 |
|
Total comprehensive income (loss) |
$ |
(9,415 |
) |
$ |
11,897 |
|
$ |
11,121 |
|
(1) See Note 1 to the Consolidated Financial Statements.
(2) See Note 8 to the Consolidated Financial Statements.
(3) Includes the impact of ASU 2018-02, adopted in the fourth quarter of 2017. See Note 1 to the Consolidated Financial Statements.
The Notes to the Consolidated Financial Statements are an integral part of these Consolidated Financial Statements.
|
|
|
|
CONSOLIDATED BALANCE SHEET |
|
Citigroup Inc. and Subsidiaries |
|
|
|
|
|
|
|
|
|
December 31, |
In millions of dollars |
2017 |
2016 |
Assets |
|
|
|
|
Cash and due from banks |
$ |
23,775 |
|
$ |
23,043 |
|
Deposits with banks |
156,741 |
|
137,451 |
|
Federal funds sold and securities borrowed or purchased under agreements to resell (including $132,949 and $133,204 as of December 31, 2017 and December 31, 2016, respectively, at fair value) |
232,478 |
|
236,813 |
|
Brokerage receivables |
38,384 |
|
28,887 |
|
Trading account assets (including $99,460 and $80,986 pledged to creditors at December 31, 2017 and December 31, 2016, respectively) |
251,556 |
|
243,925 |
|
Investments: |
|
|
Available for sale (including $9,493 and $8,239 pledged to creditors as of December 31, 2017 and December 31, 2016, respectively) |
290,914 |
|
299,424 |
|
Held to maturity (including $435 and $843 pledged to creditors as of December 31, 2017 and December 31, 2016, respectively) |
53,320 |
|
45,667 |
|
Non-marketable equity securities (including $1,206 and $1,774 at fair value as of December 31, 2017 and December 31, 2016, respectively) |
8,056 |
|
8,213 |
|
Total investments |
$ |
352,290 |
|
$ |
353,304 |
|
Loans: |
|
|
|
|
Consumer (including $25 and $29 as of December 31, 2017 and December 31, 2016, respectively, at fair value) |
333,656 |
|
325,063 |
|
Corporate (including $4,349 and $3,457 as of December 31, 2017 and December 31, 2016, respectively, at fair value) |
333,378 |
|
299,306 |
|
Loans, net of unearned income |
$ |
667,034 |
|
$ |
624,369 |
|
Allowance for loan losses |
(12,355 |
) |
(12,060 |
) |
Total loans, net |
$ |
654,679 |
|
$ |
612,309 |
|
Goodwill |
22,256 |
|
21,659 |
|
Intangible assets (other than MSRs) |
4,588 |
|
5,114 |
|
Mortgage servicing rights (MSRs) |
558 |
|
1,564 |
|
Other assets (including $19,793 and $15,729 as of December 31, 2017 and December 31, 2016, respectively, at fair value) |
105,160 |
|
128,008 |
|
Total assets |
$ |
1,842,465 |
|
$ |
1,792,077 |
|
The following table presents certain assets of consolidated variable interest entities (VIEs), which are included in the Consolidated Balance Sheet above. The assets in the table below include those assets that can only be used to settle obligations of consolidated VIEs, presented on the following page, and are in excess of those obligations. Additionally, the assets in the table below include third-party assets of consolidated VIEs only and exclude intercompany balances that eliminate in consolidation.
|
|
|
|
|
|
|
|
|
December 31, |
In millions of dollars |
2017 |
2016 |
Assets of consolidated VIEs to be used to settle obligations of consolidated VIEs |
|
|
|
|
Cash and due from banks |
$ |
52 |
|
$ |
142 |
|
Trading account assets |
1,129 |
|
602 |
|
Investments |
2,498 |
|
3,636 |
|
Loans, net of unearned income |
|
|
|
|
Consumer |
54,656 |
|
53,401 |
|
Corporate |
19,835 |
|
20,121 |
|
Loans, net of unearned income |
$ |
74,491 |
|
$ |
73,522 |
|
Allowance for loan losses |
(1,930 |
) |
(1,769 |
) |
Total loans, net |
$ |
72,561 |
|
$ |
71,753 |
|
Other assets |
154 |
|
158 |
|
Total assets of consolidated VIEs to be used to settle obligations of consolidated VIEs |
$ |
76,394 |
|
$ |
76,291 |
|
Statement continues on the next page.
CONSOLIDATED BALANCE SHEET Citigroup Inc. and Subsidiaries
(Continued)
|
|
|
|
|
|
|
|
|
December 31, |
In millions of dollars, except shares and per share amounts |
2017 |
2016 |
Liabilities |
|
|
|
|
Non-interest-bearing deposits in U.S. offices |
$ |
126,880 |
|
$ |
136,698 |
|
Interest-bearing deposits in U.S. offices (including $303 and $434 as of December 31, 2017 and December 31, 2016, respectively, at fair value) |
318,613 |
|
300,972 |
|
Non-interest-bearing deposits in offices outside the U.S. |
87,440 |
|
77,616 |
|
Interest-bearing deposits in offices outside the U.S. (including $1,162 and $778 as of December 31, 2017 and December 31, 2016, respectively, at fair value) |
426,889 |
|
414,120 |
|
Total deposits |
$ |
959,822 |
|
$ |
929,406 |
|
Federal funds purchased and securities loaned or sold under agreements to repurchase (including $40,638 and $33,663 as of December 31, 2017 and December 31, 2016, respectively, at fair value) |
156,277 |
|
141,821 |
|
Brokerage payables |
61,342 |
|
57,152 |
|
Trading account liabilities |
124,047 |
|
139,045 |
|
Short-term borrowings (including $4,627 and $2,700 as of December 31, 2017 and December 31, 2016, respectively, at fair value) |
44,452 |
|
30,701 |
|
Long-term debt (including $31,392 and $26,254 as of December 31, 2017 and December 31, 2016, respectively, at fair value) |
236,709 |
|
206,178 |
|
Other liabilities (including $15,084 and $10,796 as of December 31, 2017 and December 31, 2016, respectively, at fair value) |
58,144 |
|
61,631 |
|
Total liabilities |
$ |
1,640,793 |
|
$ |
1,565,934 |
|
Stockholders’ equity |
|
|
|
|
Preferred stock ($1.00 par value; authorized shares: 30 million), issued shares: 770,120 as of December 31, 2017 and December 31, 2016, at aggregate liquidation value
|
$ |
19,253 |
|
$ |
19,253 |
|
Common stock ($0.01 par value; authorized shares: 6 billion), issued shares: 3,099,523,273 and 3,099,482,042 as of December 31, 2017 and December 31, 2016, respectively
|
31 |
|
31 |
|
Additional paid-in capital |
108,008 |
|
108,042 |
|
Retained earnings |
138,425 |
|
146,477 |
|
Treasury stock, at cost: December 31, 2017—529,614,728 shares and December 31, 2016—327,090,192 shares
|
(30,309 |
) |
(16,302 |
) |
Accumulated other comprehensive income (loss) |
(34,668 |
) |
(32,381 |
) |
Total Citigroup stockholders’ equity |
$ |
200,740 |
|
$ |
225,120 |
|
Noncontrolling interest |
932 |
|
1,023 |
|
Total equity |
$ |
201,672 |
|
$ |
226,143 |
|
Total liabilities and equity |
$ |
1,842,465 |
|
$ |
1,792,077 |
|
The following table presents certain liabilities of consolidated VIEs, which are included in the Consolidated Balance Sheet above. The liabilities in the table below include third-party liabilities of consolidated VIEs only and exclude intercompany balances that eliminate in consolidation. The liabilities also exclude amounts where creditors or beneficial interest holders have recourse to the general credit of Citigroup.
|
|
|
|
|
|
|
|
|
December 31, |
In millions of dollars |
2017 |
2016 |
Liabilities of consolidated VIEs for which creditors or beneficial interest holders do not have recourse to the general credit of Citigroup |
|
|
|
|
Short-term borrowings |
$ |
10,079 |
|
$ |
10,697 |
|
Long-term debt |
30,492 |
|
23,919 |
|
Other liabilities |
611 |
|
1,275 |
|
Total liabilities of consolidated VIEs for which creditors or beneficial interest holders do not have recourse to the general credit of Citigroup |
$ |
41,182 |
|
$ |
35,891 |
|
The Notes to the Consolidated Financial Statements are an integral part of these Consolidated Financial Statements.
|
|
|
|
CONSOLIDATED STATEMENT OF CHANGES IN STOCKHOLDERS’ EQUITY |
|
Citigroup Inc. and Subsidiaries |
|
|
|
|
|
|
|
|
|
|
|
|
|
|
|
|
|
|
Years ended December 31, |
|
Amounts |
Shares |
In millions of dollars, except shares in thousands |
2017 |
2016 |
2015 |
2017 |
2016 |
2015 |
Preferred stock at aggregate liquidation value |
|
|
|
|
|
|
|
|
|
|
|
|
Balance, beginning of year |
$ |
19,253 |
|
$ |
16,718 |
|
$ |
10,468 |
|
770 |
|
669 |
|
419 |
|
Issuance of new preferred stock |
— |
|
2,535 |
|
6,250 |
|
— |
|
101 |
|
250 |
|
Balance, end of period |
$ |
19,253 |
|
$ |
19,253 |
|
$ |
16,718 |
|
770 |
|
770 |
|
669 |
|
Common stock and additional paid-in capital |
|
|
|
|
|
|
|
|
|
|
|
|
Balance, beginning of year |
$ |
108,073 |
|
$ |
108,319 |
|
$ |
108,010 |
|
3,099,482 |
|
3,099,482 |
|
3,082,038 |
|
Employee benefit plans |
(27 |
) |
(251 |
) |
357 |
|
41 |
|
— |
|
17,438 |
|
Preferred stock issuance expense |
— |
|
(37 |
) |
(23 |
) |
— |
|
— |
|
— |
|
Other |
(7 |
) |
42 |
|
(25 |
) |
— |
|
— |
|
6 |
|
Balance, end of period |
$ |
108,039 |
|
$ |
108,073 |
|
$ |
108,319 |
|
3,099,523 |
|
3,099,482 |
|
3,099,482 |
|
Retained earnings |
|
|
|
|
|
|
|
|
|
|
|
|
Balance, beginning of year |
$ |
146,477 |
|
$ |
133,841 |
|
$ |
117,852 |
|
|
|
|
Adjustment to opening balance, net of taxes(1)
|
(660 |
) |
15 |
|
— |
|
|
|
|
Adjusted balance, beginning of period |
$ |
145,817 |
|
$ |
133,856 |
|
$ |
117,852 |
|
|
|
|
|
|
|
Citigroup’s net income (loss) |
(6,798 |
) |
14,912 |
|
17,242 |
|
|
|
|
|
|
|
Common dividends(2)
|
(2,595 |
) |
(1,214 |
) |
(484 |
) |
|
|
|
|
|
|
Preferred dividends |
(1,213 |
) |
(1,077 |
) |
(769 |
) |
|
|
|
|
|
|
Impact of Tax Reform related to AOCI reclassification(3)
|
3,304 |
|
— |
|
— |
|
|
|
|
|
|
|
Other(4)
|
(90 |
) |
— |
|
— |
|
|
|
|
Balance, end of period |
$ |
138,425 |
|
$ |
146,477 |
|
$ |
133,841 |
|
|
|
|
|
|
|
Treasury stock, at cost |
|
|
|
|
|
|
|
|
|
|
|
|
Balance, beginning of year |
$ |
(16,302 |
) |
$ |
(7,677 |
) |
$ |
(2,929 |
) |
(327,090 |
) |
(146,203 |
) |
(58,119 |
) |
Employee benefit plans(5)
|
531 |
|
826 |
|
704 |
|
11,651 |
|
14,256 |
|
13,318 |
|
Treasury stock acquired(6)
|
(14,538 |
) |
(9,451 |
) |
(5,452 |
) |
(214,176 |
) |
(195,143 |
) |
(101,402 |
) |
Balance, end of period |
$ |
(30,309 |
) |
$ |
(16,302 |
) |
$ |
(7,677 |
) |
(529,615 |
) |
(327,090 |
) |
(146,203 |
) |
Citigroup’s accumulated other comprehensive income (loss) |
|
|
|
|
|
|
|
|
|
|
|
|
Balance, beginning of year |
$ |
(32,381 |
) |
$ |
(29,344 |
) |
$ |
(23,216 |
) |
|
|
|
|
|
|
Adjustment to opening balance, net of taxes(1)
|
504 |
|
(15 |
) |
— |
|
|
|
|
Adjusted balance, beginning of period |
$ |
(31,877 |
) |
$ |
(29,359 |
) |
$ |
(23,216 |
) |
|
|
|
Citigroup’s total other comprehensive income (loss)(3)
|
(2,791 |
) |
(3,022 |
) |
(6,128 |
) |
|
|
|
|
|
|
Balance, end of period |
$ |
(34,668 |
) |
$ |
(32,381 |
) |
$ |
(29,344 |
) |
|
|
|
|
|
|
Total Citigroup common stockholders’ equity |
$ |
181,487 |
|
$ |
205,867 |
|
$ |
205,139 |
|
2,569,908 |
|
2,772,392 |
|
2,953,279 |
|
Total Citigroup stockholders’ equity |
$ |
200,740 |
|
$ |
225,120 |
|
$ |
221,857 |
|
|
|
|
|
|
|
Noncontrolling interests |
|
|
|
|
|
|
|
|
|
|
|
|
Balance, beginning of year |
$ |
1,023 |
|
$ |
1,235 |
|
$ |
1,511 |
|
|
|
|
|
|
|
Transactions between noncontrolling-interest shareholders and the related consolidated subsidiary |
(28 |
) |
(11 |
) |
— |
|
|
|
|
Transactions between Citigroup and the noncontrolling-interest shareholders |
(121 |
) |
(130 |
) |
(164 |
) |
|
|
|
|
|
|
Net income attributable to noncontrolling-interest shareholders |
60 |
|
63 |
|
90 |
|
|
|
|
|
|
|
Dividends paid to noncontrolling-interest shareholders |
(44 |
) |
(42 |
) |
(78 |
) |
|
|
|
|
|
|
|
Other comprehensive income (loss) attributable to
noncontrolling-interest shareholders
|
114 |
|
(56 |
) |
(83 |
) |
|
|
|
|
|
|
Other |
(72 |
) |
(36 |
) |
(41 |
) |
|
|
|
|
|
|
Net change in noncontrolling interests |
$ |
(91 |
) |
$ |
(212 |
) |
$ |
(276 |
) |
|
|
|
|
|
|
Balance, end of period |
$ |
932 |
|
$ |
1,023 |
|
$ |
1,235 |
|
|
|
|
|
|
|
Total equity |
$ |
201,672 |
|
$ |
226,143 |
|
$ |
223,092 |
|
|
|
|
|
|
(1) |
See Note 1 to the Consolidated Financial Statements. |
|
|
(2) |
Common dividends declared were $0.16 per share in the first and second quarters and $0.32 per share in the third and fourth quarters of 2017; $0.05 per share in the first and second quarters and $0.16 per share in the third and fourth quarters of 2016; and $0.01 in the first quarter and $0.05 per share in the second, third and fourth quarters of 2015.
|
|
|
(3) |
Includes the impact of ASU 2018-02, which transferred those amounts from AOCI to Retained earnings. See Notes 1 and 19 to the Consolidated Financial Statements.
|
(4) Includes the impact of ASU No. 2016-09. See Note 1 to the Consolidated Financial Statements.
|
|
(5) |
Includes treasury stock related to (i) certain activity on employee stock option program exercises, where the employee delivers existing shares to cover the option exercise, or (ii) under Citi’s employee-restricted or deferred-stock programs, where shares are withheld to satisfy tax requirements. |
|
|
(6) |
For 2017, 2016 and 2015, primarily consists of open market purchases under Citi’s Board of Directors-approved common stock repurchase program. |
The Notes to the Consolidated Financial Statements are an integral part of these Consolidated Financial Statements.
|
|
|
|
CONSOLIDATED STATEMENT OF CASH FLOWS |
|
Citigroup Inc. and Subsidiaries |
|
|
|
|
|
|
|
|
|
|
|
|
Years ended December 31, |
In millions of dollars |
2017 |
2016 |
2015 |
Cash flows from operating activities of continuing operations |
|
|
|
|
|
|
Net income (loss) before attribution of noncontrolling interests |
$ |
(6,738 |
) |
$ |
14,975 |
|
$ |
17,332 |
|
Net income attributable to noncontrolling interests |
60 |
|
63 |
|
90 |
|
Citigroup’s net income (loss) |
$ |
(6,798 |
) |
$ |
14,912 |
|
$ |
17,242 |
|
Loss from discontinued operations, net of taxes |
(111 |
) |
(58 |
) |
(54 |
) |
Income (loss) from continuing operations—excluding noncontrolling interests |
$ |
(6,687 |
) |
$ |
14,970 |
|
$ |
17,296 |
|
Adjustments to reconcile net income to net cash provided by operating activities of continuing operations |
|
|
|
|
|
|
Net gains on significant disposals(1)
|
(602 |
) |
(404 |
) |
(3,210 |
) |
Depreciation and amortization |
3,659 |
|
3,720 |
|
3,506 |
|
Deferred tax provision (2)
|
24,877 |
|
1,459 |
|
2,794 |
|
Provision for loan losses |
7,503 |
|
6,749 |
|
7,108 |
|
Realized gains from sales of investments |
(778 |
) |
(948 |
) |
(682 |
) |
Net impairment losses on investments, goodwill and intangible assets |
91 |
|
621 |
|
318 |
|
Change in trading account assets |
(7,726 |
) |
(2,710 |
) |
46,830 |
|
Change in trading account liabilities |
(14,998 |
) |
21,533 |
|
(21,524 |
) |
Change in brokerage receivables, net of brokerage payables |
(5,307 |
) |
2,226 |
|
2,278 |
|
Change in loans held-for-sale (HFS) |
247 |
|
6,603 |
|
(7,207 |
) |
Change in other assets |
(2,489 |
) |
(6,859 |
) |
(32 |
) |
Change in other liabilities |
(3,421 |
) |
(28 |
) |
(1,135 |
) |
Other, net |
(2,956 |
) |
7,000 |
|
(6,603 |
) |
Total adjustments |
$ |
(1,900 |
) |
$ |
38,962 |
|
$ |
22,441 |
|
Net cash provided by (used in) operating activities of continuing operations |
$ |
(8,587 |
) |
$ |
53,932 |
|
$ |
39,737 |
|
Cash flows from investing activities of continuing operations |
|
|
|
|
|
|
Change in deposits with banks |
$ |
(19,290 |
) |
$ |
(25,311 |
) |
$ |
15,488 |
|
Change in federal funds sold and securities borrowed or purchased under agreements to resell |
4,335 |
|
(17,138 |
) |
22,895 |
|
Change in loans |
(58,062 |
) |
(39,761 |
) |
1,353 |
|
Proceeds from sales and securitizations of loans |
8,365 |
|
18,140 |
|
9,610 |
|
Purchases of investments |
(185,740 |
) |
(211,402 |
) |
(242,362 |
) |
Proceeds from sales of investments(3)
|
107,368 |
|
132,183 |
|
141,470 |
|
Proceeds from maturities of investments |
84,369 |
|
65,525 |
|
82,047 |
|
Proceeds from significant disposals(1)
|
3,411 |
|
265 |
|
5,932 |
|
Payments due to transfers of net liabilities associated with significant disposals(1)(4)
|
— |
|
— |
|
(18,929 |
) |
Capital expenditures on premises and equipment and capitalized software |
(3,361 |
) |
(2,756 |
) |
(3,198 |
) |
|
Proceeds from sales of premises and equipment, subsidiaries and affiliates
and repossessed assets
|
377 |
|
667 |
|
577 |
|
Net cash provided by (used in) investing activities of continuing operations |
$ |
(58,228 |
) |
$ |
(79,588 |
) |
$ |
14,883 |
|
Cash flows from financing activities of continuing operations |
|
|
|
|
|
|
Dividends paid |
$ |
(3,797 |
) |
$ |
(2,287 |
) |
$ |
(1,253 |
) |
Issuance of preferred stock |
— |
|
2,498 |
|
6,227 |
|
Treasury stock acquired |
(14,541 |
) |
(9,290 |
) |
(5,452 |
) |
Stock tendered for payment of withholding taxes |
(405 |
) |
(316 |
) |
(428 |
) |
Change in federal funds purchased and securities loaned or sold under agreements to repurchase |
14,456 |
|
(4,675 |
) |
(26,942 |
) |
Issuance of long-term debt |
67,960 |
|
63,806 |
|
44,619 |
|
Payments and redemptions of long-term debt |
(40,986 |
) |
(55,460 |
) |
(52,843 |
) |
Change in deposits |
30,416 |
|
24,394 |
|
8,555 |
|
Change in short-term borrowings |
13,751 |
|
9,622 |
|
(37,256 |
) |
|
|
|
|
|
|
|
|
|
|
|
Net cash provided by (used in) financing activities of continuing operations |
$ |
66,854 |
|
$ |
28,292 |
|
$ |
(64,773 |
) |
Effect of exchange rate changes on cash and cash equivalents |
$ |
693 |
|
$ |
(493 |
) |
$ |
(1,055 |
) |
Change in cash and due from banks |
$ |
732 |
|
$ |
2,143 |
|
$ |
(11,208 |
) |
Cash and due from banks at beginning of period |
23,043 |
|
20,900 |
|
32,108 |
|
Cash and due from banks at end of period |
$ |
23,775 |
|
$ |
23,043 |
|
$ |
20,900 |
|
Supplemental disclosure of cash flow information for continuing operations |
|
|
|
|
|
|
Cash paid during the year for income taxes |
$ |
2,083 |
|
$ |
4,359 |
|
$ |
4,978 |
|
Cash paid during the year for interest |
15,675 |
|
12,067 |
|
12,031 |
|
Non-cash investing activities |
|
|
|
|
|
|
Decrease in net loans associated with significant disposals reclassified to HFS |
$ |
— |
|
$ |
— |
|
$ |
(9,063 |
) |
Decrease in investments associated with significant disposals reclassified to HFS |
— |
|
— |
|
(1,402 |
) |
Decrease in goodwill and intangible assets associated with significant disposals reclassified to HFS |
— |
|
— |
|
(223 |
) |
Decrease in deposits associated with banks with significant disposals reclassified to HFS |
— |
|
— |
|
(404 |
) |
Transfers to loans HFS from loans |
5,900 |
|
13,900 |
|
28,600 |
|
Transfers to OREO and other repossessed assets |
113 |
|
165 |
|
276 |
|
Non-cash financing activities |
|
|
|
Decrease in long-term debt associated with significant disposals reclassified to HFS |
$ |
— |
|
$ |
— |
|
$ |
(4,673 |
) |
|
|
(1) |
See Note 2 to the Consolidated Financial Statements for further information on significant disposals. |
|
|
(2) |
Includes the full impact of the $22.6 billion non-cash charge related to the Tax Cuts and Jobs Act (Tax Reform). See Notes 1 and 9 to the Consolidated Financial Statements for further information.
|
(3) Proceeds for 2016 include approximately $3.3 billion from the sale of Citi’s investment in China Guangfa Bank.
|
|
(4) |
The payments associated with significant disposals result primarily from the sale of deposit liabilities. |
The Notes to the Consolidated Financial Statements are an integral part of these Consolidated Financial Statements.
NOTES TO CONSOLIDATED FINANCIAL STATEMENTS
1. SUMMARY OF SIGNIFICANT ACCOUNTING POLICIES
Throughout these Notes, “Citigroup,” “Citi” and the “Company” refer to Citigroup Inc. and its consolidated subsidiaries.
Certain reclassifications have been made to the prior periods’ financial statements and Notes to conform to the current period’s presentation.
Principles of Consolidation
The Consolidated Financial Statements include the accounts of Citigroup and its subsidiaries prepared in accordance with U.S. generally accepted accounting principles (GAAP). The Company consolidates subsidiaries in which it holds, directly or indirectly, more than 50% of the voting rights or where it exercises control. Entities where the Company holds 20% to 50% of the voting rights and/or has the ability to exercise significant influence, other than investments of designated venture capital subsidiaries or investments accounted for at fair value under the fair value option, are accounted for under the equity method, and the pro rata share of their income (loss) is included in Other revenue. Income from investments in less-than-20%-owned companies is recognized when dividends are received. As discussed in more detail in Note 21 to the Consolidated Financial Statements, Citigroup also consolidates entities deemed to be variable interest entities when Citigroup is determined to be the primary beneficiary. Gains and losses on the disposition of branches, subsidiaries, affiliates, buildings and other investments are included in Other revenue.
Citibank
Citibank, N.A. (Citibank) is a commercial bank and wholly owned subsidiary of Citigroup. Citibank’s principal offerings include consumer finance, mortgage lending and retail banking (including commercial banking) products and services; investment banking, cash management and trade finance; and private banking products and services.
Variable Interest Entities
An entity is a variable interest entity (VIE) if it meets either of the criteria outlined in Accounting Standards Codification (ASC) Topic 810, Consolidation, which are (i) the entity has equity that is insufficient to permit the entity to finance its activities without additional subordinated financial support from other parties, or (ii) the entity has equity investors that cannot make significant decisions about the entity’s operations or that do not absorb their proportionate share of the entity’s expected losses or expected returns.
The Company consolidates a VIE when it has both the power to direct the activities that most significantly impact the VIE’s economic performance and a right to receive benefits or the obligation to absorb losses of the entity that could be potentially significant to the VIE (that is, Citi is the primary beneficiary). In addition to variable interests held in
consolidated VIEs, the Company has variable interests in other VIEs that are not consolidated because the Company is not the primary beneficiary.
All unconsolidated VIEs are monitored by the Company to assess whether any events have occurred to cause its primary beneficiary status to change.
All entities not deemed to be VIEs with which the Company has involvement are evaluated for consolidation under other subtopics of ASC 810. See Note 21 to the Consolidated Financial Statements for more detailed information.
Foreign Currency Translation
Assets and liabilities of Citi’s foreign operations are translated from their respective functional currencies into U.S. dollars using period-end spot foreign exchange rates. The effects of those translation adjustments are reported in Accumulated other comprehensive income (loss), a component of stockholders’ equity, net of any related hedge and tax effects, until realized upon sale or substantial liquidation of the foreign operation. Revenues and expenses of Citi’s foreign operations are translated monthly from their respective functional currencies into U.S. dollars at amounts that approximate weighted average exchange rates.
For transactions that are denominated in a currency other than the functional currency, including transactions denominated in the local currencies of foreign operations that use the U.S. dollar as their functional currency, the effects of changes in exchange rates are primarily included in Principal transactions, along with the related effects of any economic hedges. Instruments used to hedge foreign currency exposures include foreign currency forward, option and swap contracts and, in certain instances, designated issues of non-U.S. dollar debt. Foreign operations in countries with highly inflationary economies designate the U.S. dollar as their functional currency, with the effects of changes in exchange rates primarily included in Other revenue.
Investment Securities
Investments include fixed income and equity securities. Fixed income instruments include bonds, notes and redeemable preferred stocks, as well as certain loan-backed and structured securities that are subject to prepayment risk. Equity securities include common and nonredeemable preferred stock.
Investment securities are classified and accounted for as follows:
|
|
• |
Fixed income securities classified as “held-to-maturity” are securities that the Company has both the ability and the intent to hold until maturity and are carried at amortized cost. Interest income on such securities is included in Interest revenue.
|
|
|
• |
Fixed income securities and marketable equity securities classified as “available-for-sale” are carried at fair value with changes in fair value reported in Accumulated other comprehensive income (loss), a component of
|
stockholders’ equity, net of applicable income taxes and hedges. Realized gains and losses on sales are included in income primarily on a specific identification cost basis. Interest and dividend income on such securities is included in Interest revenue.
|
|
• |
Certain investments in non-marketable equity securities and certain investments that would otherwise have been accounted for using the equity method are carried at fair value, since the Company has elected to apply fair value accounting. Changes in fair value of such investments are recorded in earnings. |
|
|
• |
Certain non-marketable equity securities are carried at cost. |
For investments in fixed income securities classified as held-to-maturity or available-for-sale, the accrual of interest income is suspended for investments that are in default or for which it is likely that future interest payments will not be made as scheduled.
Investment securities are subject to evaluation for other-than-temporary impairment as described in Note 13 to the Consolidated Financial Statements.
The Company uses a number of valuation techniques for investments carried at fair value, which are described in Note 24 to the Consolidated Financial Statements. Realized gains and losses on sales of investments are included in earnings.
Trading Account Assets and Liabilities
Trading account assets include debt and marketable equity securities, derivatives in a receivable position, residual interests in securitizations and physical commodities inventory. In addition, as described in Note 25 to the Consolidated Financial Statements, certain assets that Citigroup has elected to carry at fair value under the fair value option, such as loans and purchased guarantees, are also included in Trading account assets.
Trading account liabilities include securities sold, not yet purchased (short positions) and derivatives in a net payable position, as well as certain liabilities that Citigroup has elected to carry at fair value (as described in Note 25 to the Consolidated Financial Statements).
Other than physical commodities inventory, all trading account assets and liabilities are carried at fair value. Revenues generated from trading assets and trading liabilities are generally reported in Principal transactions and include realized gains and losses as well as unrealized gains and losses resulting from changes in the fair value of such instruments. Interest income on trading assets is recorded in Interest revenue reduced by interest expense on trading liabilities.
Physical commodities inventory is carried at the lower of cost or market with related losses reported in Principal transactions. Realized gains and losses on sales of commodities inventory are included in Principal transactions. Investments in unallocated precious metals accounts (gold, silver, platinum and palladium) are accounted for as hybrid instruments containing a debt host contract and an embedded non-financial derivative
instrument indexed to the price of the relevant precious metal. The embedded derivative instrument is separated from the debt host contract and accounted for at fair value. The debt host contract is carried at fair value under the fair value option, as described in Note 25 to the Consolidated Financial Statements.
Derivatives used for trading purposes include interest rate, currency, equity, credit and commodity swap agreements, options, caps and floors, warrants, and financial and commodity futures and forward contracts. Derivative asset and liability positions are presented net by counterparty on the Consolidated Balance Sheet when a valid master netting agreement exists and the other conditions set out in ASC Topic 210-20, Balance Sheet—Offsetting, are met. See Note 22 to the Consolidated Financial Statements.
The Company uses a number of techniques to determine the fair value of trading assets and liabilities, which are described in Note 24 to the Consolidated Financial Statements.
Securities Borrowed and Securities Loaned
Securities borrowing and lending transactions do not constitute a sale of the underlying securities for accounting purposes and are treated as collateralized financing transactions. Such transactions are recorded at the amount of proceeds advanced or received plus accrued interest. As described in Note 25 to the Consolidated Financial Statements, the Company has elected to apply fair value accounting to a number of securities borrowing and lending transactions. Fees paid or received for all securities lending and borrowing transactions are recorded in Interest expense or Interest revenue at the contractually specified rate.
The Company monitors the fair value of securities borrowed or loaned on a daily basis and obtains or posts additional collateral in order to maintain contractual margin protection.
As described in Note 24 to the Consolidated Financial Statements, the Company uses a discounted cash flow technique to determine the fair value of securities lending and borrowing transactions.
Repurchase and Resale Agreements
Securities sold under agreements to repurchase (repos) and securities purchased under agreements to resell (reverse repos) do not constitute a sale (or purchase) of the underlying securities for accounting purposes and are treated as collateralized financing transactions. As described in Note 25 to the Consolidated Financial Statements, the Company has elected to apply fair value accounting to the majority of such transactions, with changes in fair value reported in earnings. Any transactions for which fair value accounting has not been elected are recorded at the amount of cash advanced or received plus accrued interest. Irrespective of whether the Company has elected fair value accounting, interest paid or received on all repo and reverse repo transactions is recorded in Interest expense or Interest revenue at the contractually specified rate.
Where the conditions of ASC 210-20-45-11, Balance Sheet—Offsetting: Repurchase and Reverse Repurchase
Agreements, are met, repos and reverse repos are presented net on the Consolidated Balance Sheet.
The Company’s policy is to take possession of securities purchased under reverse repurchase agreements. The Company monitors the fair value of securities subject to repurchase or resale on a daily basis and obtains or posts additional collateral in order to maintain contractual margin protection.
As described in Note 24 to the Consolidated Financial Statements, the Company uses a discounted cash flow technique to determine the fair value of repo and reverse repo transactions.
Loans
Loans are reported at their outstanding principal balances net of any unearned income and unamortized deferred fees and costs except that credit card receivable balances also include accrued interest and fees. Loan origination fees and certain direct origination costs are generally deferred and recognized as adjustments to income over the lives of the related loans.
As described in Note 25 to the Consolidated Financial Statements, Citi has elected fair value accounting for certain loans. Such loans are carried at fair value with changes in fair value reported in earnings. Interest income on such loans is recorded in Interest revenue at the contractually specified rate.
Loans that are held-for-investment are classified as Loans, net of unearned income on the Consolidated Balance Sheet, and the related cash flows are included within the cash flows from investing activities category in the Consolidated Statement of Cash Flows on the line Change in loans. However, when the initial intent for holding a loan has changed from held-for-investment to HFS, the loan is reclassified to held-for-sale, but the related cash flows continue to be reported in cash flows from investing activities in the Consolidated Statement of Cash Flows on the line Proceeds from sales and securitizations of loans.
Consumer Loans
Consumer loans represent loans and leases managed primarily by the Global Consumer Banking (GCB) businesses and Corporate/Other.
Consumer Non-accrual and Re-aging Policies
As a general rule, interest accrual ceases for installment and real estate (both open- and closed-end) loans when payments are 90 days contractually past due. For credit cards and other unsecured revolving loans, however, Citi generally accrues interest until payments are 180 days past due. As a result of OCC guidance, home equity loans in regulated bank entities are classified as non-accrual if the related residential first mortgage is 90 days or more past due. Also as a result of OCC guidance, mortgage loans in regulated bank entities within 60 days of notification that the borrower has filed for bankruptcy, other than FHA-insured loans, are classified as non-accrual. Commercial market loans are placed on a cash (non-accrual) basis when it is determined, based on actual experience and a forward-looking assessment of the
collectability of the loan in full, that the payment of interest or principal is doubtful or when interest or principal is 90 days past due.
Loans that have been modified to grant a concession to a borrower in financial difficulty may not be accruing interest at the time of the modification. The policy for returning such modified loans to accrual status varies by product and/or region. In most cases, a minimum number of payments (ranging from one to six) is required, while in other cases the loan is never returned to accrual status. For regulated bank entities, such modified loans are returned to accrual status if a credit evaluation at the time of, or subsequent to, the modification indicates the borrower is able to meet the restructured terms, and the borrower is current and has demonstrated a reasonable period of sustained payment performance (minimum six months of consecutive payments).
For U.S. consumer loans, generally one of the conditions to qualify for modification is that a minimum number of payments (typically ranging from one to three) must be made. Upon modification, the loan is re-aged to current status. However, re-aging practices for certain open-ended consumer loans, such as credit cards, are governed by Federal Financial Institutions Examination Council (FFIEC) guidelines. For open-ended consumer loans subject to FFIEC guidelines, one of the conditions for the loan to be re-aged to current status is that at least three consecutive minimum monthly payments, or the equivalent amount, must be received. In addition, under FFIEC guidelines, the number of times that such a loan can be re-aged is subject to limitations (generally once in 12 months and twice in five years). Furthermore, Federal Housing Administration (FHA) and Department of Veterans Affairs (VA) loans may only be modified under those respective agencies’ guidelines, and payments are not always required in order to re-age a modified loan to current.
Consumer Charge-Off Policies
Citi’s charge-off policies follow the general guidelines below:
|
|
• |
Unsecured installment loans are charged off at 120 days contractually past due.
|
|
|
• |
Unsecured revolving loans and credit card loans are charged off at 180 days contractually past due.
|
|
|
• |
Loans secured with non-real estate collateral are written down to the estimated value of the collateral, less costs to sell, at 120 days contractually past due.
|
|
|
• |
Real estate-secured loans are written down to the estimated value of the property, less costs to sell, at 180 days contractually past due.
|
|
|
• |
Real estate-secured loans are charged off no later than 180 days contractually past due if a decision has been made not to foreclose on the loans.
|
|
|
• |
Unsecured loans in bankruptcy are charged off within 60 days of notification of filing by the bankruptcy court or in accordance with Citi’s charge-off policy, whichever occurs earlier.
|
|
|
• |
Real estate-secured loans in bankruptcy, other than FHA-insured loans, are written down to the estimated value of the property, less costs to sell, within 60 days of notification that the borrower has filed for bankruptcy or in accordance with Citi’s charge-off policy, whichever is earlier.
|
|
|
• |
Commercial market loans are written down to the extent that principal is judged to be uncollectable. |
Corporate Loans
Corporate loans represent loans and leases managed by Institutional Clients Group (ICG). Corporate loans are identified as impaired and placed on a cash (non-accrual) basis when it is determined, based on actual experience and a forward-looking assessment of the collectability of the loan in full, that the payment of interest or principal is doubtful or when interest or principal is 90 days past due, except when the loan is well collateralized and in the process of collection. Any interest accrued on impaired corporate loans and leases is reversed at 90 days past due and charged against current earnings, and interest is thereafter included in earnings only to the extent actually received in cash. When there is doubt regarding the ultimate collectability of principal, all cash receipts are thereafter applied to reduce the recorded investment in the loan.
Impaired corporate loans and leases are written down to the extent that principal is deemed to be uncollectable. Impaired collateral-dependent loans and leases, where repayment is expected to be provided solely by the sale of the underlying collateral and there are no other available and reliable sources of repayment, are written down to the lower of cost or collateral value. Cash-basis loans are returned to accrual status when all contractual principal and interest amounts are reasonably assured of repayment and there is a sustained period of repayment performance in accordance with the contractual terms.
Loans Held-for-Sale
Corporate and consumer loans that have been identified for sale are classified as loans held-for-sale and included in Other assets. The practice of Citi’s U.S. prime mortgage business has been to sell substantially all of its conforming loans. As such, U.S. prime mortgage conforming loans are classified as held-for-sale and the fair value option is elected at origination, with changes in fair value recorded in Other revenue. With the exception of those loans for which the fair value option has been elected, held-for-sale loans are accounted for at the lower of cost or market value, with any write-downs or subsequent recoveries charged to Other revenue. The related cash flows are classified in the Consolidated Statement of Cash Flows in the cash flows from operating activities category on the line Change in loans held-for-sale.
Allowance for Loan Losses
Allowance for loan losses represents management’s best estimate of probable losses inherent in the portfolio, including probable losses related to large individually evaluated impaired loans and troubled debt restructurings. Attribution of the allowance is made for analytical purposes only, and the entire allowance is available to absorb probable loan losses inherent in the overall portfolio. Additions to the allowance are made through the Provision for loan losses. Loan losses are deducted from the allowance and subsequent recoveries are added. Assets received in exchange for loan claims in a restructuring are initially recorded at fair value, with any gain or loss reflected as a recovery or charge-off to the provision.
Consumer Loans
For consumer loans, each portfolio of non-modified smaller-balance homogeneous loans is independently evaluated for impairment by product type (e.g., residential mortgage, credit card, etc.) in accordance with ASC 450, Contingencies. The allowance for loan losses attributed to these loans is established via a process that estimates the probable losses inherent in the specific portfolio. This process includes migration analysis, in which historical delinquency and credit loss experience is applied to the current aging of the portfolio, together with analyses that reflect current and anticipated economic conditions, including changes in housing prices and unemployment trends. Citi’s allowance for loan losses under ASC 450 only considers contractual principal amounts due, except for credit card loans, where estimated loss amounts related to accrued interest receivable are also included.
Management also considers overall portfolio indicators, including historical credit losses, delinquent, non-performing and classified loans, trends in volumes and terms of loans, an evaluation of overall credit quality, the credit process, including lending policies and procedures, and economic, geographical, product and other environmental factors.
Separate valuation allowances are determined for impaired smaller-balance homogeneous loans whose terms have been modified in a troubled debt restructuring (TDR). Long-term modification programs, and short-term (less than 12 months) modifications that provide concessions (such as interest rate reductions) to borrowers in financial difficulty, are reported as TDRs. In addition, loan modifications that involve a trial period are reported as TDRs at the start of the trial period. The allowance for loan losses for TDRs is determined in accordance with ASC 310-10-35, Receivables—Subsequent Measurement, considering all available evidence, including, as appropriate, the present value of the expected future cash flows discounted at the loan’s original contractual effective rate, the secondary market value of the loan and the fair value of collateral less disposal costs. These expected cash flows incorporate modification program default rate assumptions. The original contractual effective rate for credit card loans is the pre-modification rate, which may include interest rate increases under the original contractual agreement with the borrower.
Valuation allowances for commercial market loans, which are classifiably managed consumer loans, are determined in the same manner as for corporate loans and are described in more detail in the following section. Generally, an asset-specific component is calculated under ASC 310-10-35 on an individual basis for larger-balance, non-homogeneous loans that are considered impaired, and the allowance for the remainder of the classifiably managed consumer loan portfolio is calculated under ASC 450 using a statistical methodology that may be supplemented by management adjustment.
Corporate Loans
In the corporate portfolios, the Allowance for loan losses includes an asset-specific component and a statistically based component. The asset-specific component is calculated under ASC 310-10-35 for larger-balance, non-homogeneous loans that are considered impaired. An asset-specific allowance is established when the discounted cash flows, collateral value (less disposal costs) or observable market price of the impaired loan are lower than its carrying value. This allowance considers the borrower’s overall financial condition, resources and payment record, the prospects for support from any financially responsible guarantors (discussed further below) and, if appropriate, the realizable value of any collateral. The asset-specific component of the allowance for smaller-balance impaired loans is calculated on a pool basis considering historical loss experience.
The allowance for the remainder of the loan portfolio is determined under ASC 450 using a statistical methodology, supplemented by management judgment. The statistical analysis considers the portfolio’s size, remaining tenor and credit quality as measured by internal risk ratings assigned to individual credit facilities, which reflect probability of default and loss given default. The statistical analysis considers historical default rates and historical loss severity in the event of default, including historical average levels and historical variability. The result is an estimated range for inherent losses. The best estimate within the range is then determined by management’s quantitative and qualitative assessment of current conditions, including general economic conditions, specific industry and geographic trends and internal factors including portfolio concentrations, trends in internal credit quality indicators and current and past underwriting standards.
For both the asset-specific and the statistically based components of the Allowance for loan losses, management may incorporate guarantor support. The financial wherewithal of the guarantor is evaluated, as applicable, based on net worth, cash flow statements and personal or company financial statements, which are updated and reviewed at least annually. Citi seeks performance on guarantee arrangements in the normal course of business. Seeking performance entails obtaining satisfactory cooperation from the guarantor or borrower in the specific situation. This regular cooperation is indicative of pursuit and successful enforcement of the guarantee; the exposure is reduced without the expense and burden of pursuing a legal
remedy. A guarantor’s reputation and willingness to work with Citigroup is evaluated based on the historical experience with the guarantor and the knowledge of the marketplace. In the rare event that the guarantor is unwilling or unable to perform or facilitate borrower cooperation, Citi pursues a legal remedy; however, enforcing a guarantee via legal action against the guarantor is not the primary means of resolving a troubled loan situation and rarely occurs. If Citi does not pursue a legal remedy, it is because Citi does not believe that the guarantor has the financial wherewithal to perform regardless of legal action or because there are legal limitations on simultaneously pursuing guarantors and foreclosure. A guarantor’s reputation does not impact Citi’s decision or ability to seek performance under the guarantee.
In cases where a guarantee is a factor in the assessment of loan losses, it is included via adjustment to the loan’s internal risk rating, which in turn is the basis for the adjustment to the statistically based component of the Allowance for loan losses. To date, it is only in rare circumstances that an impaired commercial loan or commercial real estate loan is carried at a value in excess of the appraised value due to a guarantee.
When Citi’s monitoring of the loan indicates that the guarantor’s wherewithal to pay is uncertain or has deteriorated, there is either no change in the risk rating, because the guarantor’s credit support was never initially factored in, or the risk rating is adjusted to reflect that uncertainty or deterioration. Accordingly, a guarantor’s ultimate failure to perform or a lack of legal enforcement of the guarantee does not materially impact the allowance for loan losses, as there is typically no further significant adjustment of the loan’s risk rating at that time. Where Citi is not seeking performance under the guarantee contract, it provides for loan losses as if the loans were non-performing and not guaranteed.
Reserve Estimates and Policies
Management provides reserves for an estimate of probable losses inherent in the funded loan portfolio on the Consolidated Balance Sheet in the form of an allowance for loan losses. These reserves are established in accordance with Citigroup’s credit reserve policies, as approved by the Audit Committee of the Citigroup Board of Directors. Citi’s Chief Risk Officer and Chief Financial Officer review the adequacy of the credit loss reserves each quarter with representatives from the risk management and finance staffs for each applicable business area. Applicable business areas include those having classifiably managed portfolios, where internal credit-risk ratings are assigned (primarily ICG and GCB) or modified consumer loans, where concessions were granted due to the borrowers’ financial difficulties.
The above-mentioned representatives for these business areas present recommended reserve balances for their funded and unfunded lending portfolios along with supporting quantitative and qualitative data discussed below:
Estimated probable losses for non-performing, non-homogeneous exposures within a business line’s classifiably managed portfolio and impaired smaller-balance homogeneous loans whose terms have been modified due to the borrowers’ financial difficulties, where it was determined that a concession was granted to the borrower. Consideration may be given to the following, as appropriate, when determining this estimate: (i) the present value of expected future cash flows discounted at the loan’s original effective rate, (ii) the borrower’s overall financial condition, resources and payment record and (iii) the prospects for support from financially responsible guarantors or the realizable value of any collateral. In the determination of the allowance for loan losses for TDRs, management considers a combination of historical re-default rates, the current economic environment and the nature of the modification program when forecasting expected cash flows. When impairment is measured based on the present value of expected future cash flows, the entire change in present value is recorded in Provision for loan losses.
Statistically calculated losses inherent in the classifiably managed portfolio for performing and de minimis non-performing exposures. The calculation is based on (i) Citi’s internal system of credit-risk ratings, which are analogous to the risk ratings of the major rating agencies, and (ii) historical default and loss data, including rating agency information regarding default rates from 1983 to 2016 and internal data dating to the early 1970s on severity of losses in the event of default. Adjustments may be made to this data. Such adjustments include (i) statistically calculated estimates to cover the historical fluctuation of the default rates over the credit cycle, the historical variability of loss severity among defaulted loans and the degree to which there are large obligor concentrations in the global portfolio, and (ii) adjustments made for specific known items, such as current environmental factors and credit trends.
In addition, representatives from each of the risk management and finance staffs that cover business areas with delinquency-managed portfolios containing smaller-balance homogeneous loans present their recommended reserve balances based on leading credit indicators, including loan delinquencies and changes in portfolio size as well as economic trends, including current and future housing prices, unemployment, length of time in foreclosure, costs to sell and GDP. This methodology is applied separately for each individual product within each geographic region in which these portfolios exist.
This evaluation process is subject to numerous estimates and judgments. The frequency of default, risk ratings, loss recovery rates, the size and diversity of individual large credits and the ability of borrowers with foreign currency obligations to obtain the foreign currency necessary for orderly debt servicing, among other things, are all taken into account during this review. Changes in these estimates could have a direct impact on the credit costs in any period and could result in a change in the allowance.
Allowance for Unfunded Lending Commitments
A similar approach to the allowance for loan losses is used for calculating a reserve for the expected losses related to unfunded lending commitments and standby letters of credit. This reserve is classified on the balance sheet in Other liabilities. Changes to the allowance for unfunded lending commitments are recorded in Provision for unfunded lending commitments.
Mortgage Servicing Rights
Mortgage servicing rights (MSRs) are recognized as intangible assets when purchased or when the Company sells or securitizes loans acquired through purchase or origination and retains the right to service the loans. Mortgage servicing rights are accounted for at fair value, with changes in value recorded in Other revenue in the Company’s Consolidated Statement of Income.
For additional information on the Company’s MSRs, see Notes 16 and 21 to the Consolidated Financial Statements.
Goodwill
Goodwill represents the excess of acquisition cost over the fair value of net tangible and intangible assets acquired in a business combination. Goodwill is subject to annual impairment testing and between annual tests if an event occurs or circumstances change that would more-likely-than-not reduce the fair value of a reporting unit below its carrying amount.
Under ASC Topic 350, Intangibles—Goodwill and Other, the Company has an option to assess qualitative factors to determine if it is necessary to perform the goodwill impairment test. If, after assessing the totality of events or circumstances, the Company determines that it is not more-likely-than-not that the fair value of a reporting unit is less than its carrying amount, no further testing is necessary. If, however, the Company determines that it is more-likely-than-not that the fair value of a reporting unit is less than its carrying amount, then the Company must perform the first step of the two-step goodwill impairment test.
The Company has an unconditional option to bypass the qualitative assessment for any reporting unit in any reporting period and proceed directly to the first step of the goodwill impairment test.
The first step requires a comparison of the fair value of the individual reporting unit to its carrying value, including goodwill. If the fair value of the reporting unit is in excess of the carrying value, the related goodwill is considered not impaired and no further analysis is necessary. If the carrying value of the reporting unit exceeds the fair value, this is an indication of potential impairment and the second step of testing is performed to measure the amount of impairment, if any, for that reporting unit.
If required, the second step involves calculating the implied fair value of goodwill for each of the affected reporting units. The implied fair value of goodwill is determined in the same manner as the amount of goodwill recognized in a business combination, which is the excess of the fair value of the reporting unit determined in step one over the fair value of the net assets and identifiable
intangibles as if the reporting unit were being acquired. If the amount of the goodwill allocated to the reporting unit exceeds the implied fair value of the goodwill in the pro forma purchase price allocation, an impairment charge is recorded for the excess. A recognized impairment charge cannot exceed the amount of goodwill allocated to a reporting unit and cannot subsequently be reversed even if the fair value of the reporting unit recovers.
Upon any business disposition, goodwill is allocated to, and derecognized with the disposed business based on the ratio of the fair value of the disposed business to the fair value of the reporting unit.
Additional information on Citi’s goodwill impairment testing can be found in Note 16 to the Consolidated Financial Statements.
Intangible Assets
Intangible assets, including core deposit intangibles, present value of future profits, purchased credit card relationships, credit card contract related intangibles, other customer relationships and other intangible assets, but excluding MSRs, are amortized over their estimated useful lives. Intangible assets that are deemed to have indefinite useful lives, primarily trade names, are not amortized and are subject to annual impairment tests. An impairment exists if the carrying value of the indefinite-lived intangible asset exceeds its fair value. For other intangible assets subject to amortization, an impairment is recognized if the carrying amount is not recoverable and exceeds the fair value of the intangible asset.
Other Assets and Other Liabilities
Other assets include, among other items, loans held-for-sale, deferred tax assets, equity method investments, interest and fees receivable, premises and equipment (including purchased and developed software), repossessed assets and other receivables. Other liabilities include, among other items, accrued expenses and other payables, deferred tax liabilities and reserves for legal claims, taxes, unfunded lending commitments, repositioning reserves and other matters.
Other Real Estate Owned and Repossessed Assets
Real estate or other assets received through foreclosure or repossession are generally reported in Other assets, net of a valuation allowance for selling costs and subsequent declines in fair value.
Securitizations
There are two key accounting determinations that must be made relating to securitizations. Citi first makes a determination as to whether the securitization entity must be consolidated. Second, it determines whether the transfer of financial assets to the entity is considered a sale under GAAP. If the securitization entity is a VIE, the Company consolidates the VIE if it is the primary beneficiary (as discussed in “Variable Interest Entities” above). For all other securitization entities determined not to be VIEs in which Citigroup participates, consolidation is based on which party
has voting control of the entity, giving consideration to removal and liquidation rights in certain partnership structures. Only securitization entities controlled by Citigroup are consolidated.
Interests in the securitized and sold assets may be retained in the form of subordinated or senior interest-only strips, subordinated tranches, spread accounts and servicing rights. In credit card securitizations, the Company retains a seller’s interest in the credit card receivables transferred to the trusts, which is not in securitized form. In the case of consolidated securitization entities, including the credit card trusts, these retained interests are not reported on Citi’s Consolidated Balance Sheet. The securitized loans remain on
the balance sheet. Substantially all of the consumer loans sold or securitized through non-consolidated trusts by Citigroup are U.S. prime residential mortgage loans. Retained interests in non-consolidated mortgage securitization trusts are classified as Trading account assets, except for MSRs, which are included in Mortgage servicing rights on Citigroup’s Consolidated Balance Sheet.
Debt
Short-term borrowings and Long-term debt are accounted for at amortized cost, except where the Company has elected to report the debt instruments, including certain structured notes at fair value, or the debt is in a fair value hedging relationship.
Transfers of Financial Assets
For a transfer of financial assets to be considered a sale (i) the assets must be legally isolated from the Company, even in bankruptcy or other receivership, (ii) the purchaser must have the right to pledge or sell the assets transferred or, if the purchaser is an entity whose sole purpose is to engage in securitization and asset-backed financing activities through the issuance of beneficial interests and that entity is constrained from pledging the assets it receives, each beneficial interest holder must have the right to sell or pledge their beneficial interests and (iii) the Company may not have an option or obligation to reacquire the assets.
If these sale requirements are met, the assets are removed from the Company’s Consolidated Balance Sheet. If the conditions for sale are not met, the transfer is considered to be a secured borrowing, the assets remain on the Consolidated Balance Sheet and the sale proceeds are recognized as the Company’s liability. A legal opinion on a sale generally is obtained for complex transactions or where the Company has continuing involvement with assets transferred or with the securitization entity. For a transfer to be eligible for sale accounting, those opinions must state that the asset transfer would be considered a sale and that the assets transferred would not be consolidated with the Company’s other assets in the event of the Company’s insolvency.
For a transfer of a portion of a financial asset to be considered a sale, the portion transferred must meet the definition of a participating interest. A participating interest must represent a pro rata ownership in an entire financial asset; all cash flows must be divided proportionately, with
the same priority of payment; no participating interest in the transferred asset may be subordinated to the interest of another participating interest holder; and no party may have the right to pledge or exchange the entire financial asset unless all participating interest holders agree. Otherwise, the transfer is accounted for as a secured borrowing.
See Note 21 to the Consolidated Financial Statements for further discussion.
Risk Management Activities—Derivatives Used for Hedging Purposes
The Company manages its exposures to market movements outside of its trading activities by modifying the asset and liability mix, either directly or through the use of derivative financial products, including interest-rate swaps, futures, forwards and purchased options, as well as foreign-exchange contracts. These end-user derivatives are carried at fair value in Other assets, Other liabilities, Trading account assets and Trading account liabilities.
See Note 22 to the Consolidated Financial Statements for a further discussion of the Company’s hedging and derivative activities.
Employee Benefits Expense
Employee benefits expense includes current service costs of pension and other postretirement benefit plans (which are accrued on a current basis), contributions and unrestricted awards under other employee plans, the amortization of restricted stock awards and costs of other employee benefits.
For its most significant pension and postretirement benefit plans (Significant Plans), Citigroup measures and discloses plan obligations, plan assets and periodic plan expense quarterly, instead of annually. The effect of remeasuring the Significant Plan obligations and assets by updating plan actuarial assumptions on a quarterly basis is reflected in Accumulated other comprehensive income (loss) and periodic plan expense. All other plans (All Other Plans) are remeasured annually. See Note 8 to the Consolidated Financial Statements.
Stock-Based Compensation
The Company recognizes compensation expense related to stock and option awards over the requisite service period, generally based on the instruments’ grant-date fair value, reduced by actual forfeitures as they occur. Compensation cost related to awards granted to employees who meet certain age plus years-of-service requirements (retirement-eligible employees) is accrued in the year prior to the grant date, in the same manner as the accrual for cash incentive compensation. Certain stock awards with performance conditions or certain clawback provisions are subject to variable accounting, pursuant to which the associated compensation expense fluctuates with changes in Citigroup’s common stock price. See Note 7 to the Consolidated Financial Statements.
Income Taxes
The Company is subject to the income tax laws of the U.S. and its states and municipalities, as well as the non-U.S. jurisdictions in which it operates. These tax laws are complex and may be subject to different interpretations by the taxpayer and the relevant governmental taxing authorities. In establishing a provision for income tax expense, the Company must make judgments and interpretations about these tax laws. The Company must also make estimates about when in the future certain items will affect taxable income in the various tax jurisdictions, both domestic and foreign.
Disputes over interpretations of the tax laws may be subject to review and adjudication by the court systems of the various tax jurisdictions, or may be settled with the taxing authority upon examination or audit. The Company treats interest and penalties on income taxes as a component of Income tax expense.
Deferred taxes are recorded for the future consequences of events that have been recognized in financial statements or tax returns, based upon enacted tax laws and rates. Deferred tax assets are recognized subject to management’s judgment about whether realization is more-likely-than-not. ASC 740, Income Taxes, sets out a consistent framework to determine the appropriate level of tax reserves to maintain for uncertain tax positions. This interpretation uses a two-step approach wherein a tax benefit is recognized if a position is more-likely-than-not to be sustained. The amount of the benefit is then measured to be the highest tax benefit that is more than 50% likely to be realized. ASC 740 also sets out disclosure requirements to enhance transparency of an entity’s tax reserves.
On December 22, 2017, the SEC issued Staff Accounting Bulletin (SAB) 118, which sets forth the accounting for the changes in tax law caused by the enactment of the Tax Cuts and Jobs Act (Tax Reform). The Bulletin provides guidance as to how ASC 740 should be applied for the quarterly reporting period that includes the December 22, 2017 enactment date of Tax Reform. SAB 118 covers three different fact patterns that can be applied to each aspect of Tax Reform. The first is where the accounting is complete as of December 31, 2017; in this case, a company must report the effects of Tax Reform in its financial statements that include the enactment date. The second situation is where a company cannot complete its accounting as of December 31, 2017, but can provide a reasonable estimate based upon the information available to it and its ability to prepare and analyze this information (including related computations). In the situation described, the company must include the reasonable estimate it so determined in its financial statements as a provisional amount that will then be trued up within the one-year measurement period after the date of enactment of Tax Reform. The third situation, in which no reasonable estimate can be made for an item, requires a company to apply ASC 740 using the pre-Tax Reform tax law until the first reporting period in which it can make a reasonable estimate for the item.
To the extent that a company records a provisional amount in its financial statements, it must update its reporting during the one-year measurement period whenever the facts and circumstances existing at the enactment date are further analyzed. Any company providing provisional amounts must qualitatively disclose the income tax effects for which the accounting is incomplete, the reason it is incomplete and the additional information that is needed to complete the accounting. In addition, when the company revises or finalizes its provisional accounting for any item, it must disclose the nature and amount of any measurement period adjustments recognized in the reporting period, the impact of such adjustments on its effective tax rate and a confirmation when the accounting for such items is complete.
Citi recorded a charge to continuing operations of $22.6 billion in the fourth quarter of 2017, composed of a $12.4 billion remeasurement due to the reduction to the U.S. corporate tax rate and a change to a quasi-territorial tax system, a $7.9 billion valuation allowance against Citi’s FTC carry-forwards and its U.S. residual DTAs related to its non-U.S. branches, and a $2.3 billion reduction in Citi’s FTC carry-forwards related to the deemed repatriation of undistributed earnings of non-U.S. subsidiaries.
Of the aforementioned amounts, the following are considered to be provisional for which certain aspects of Citi’s accounting is incomplete, as described below. First, of the $12.4 billion, $6.2 billion is provisional as Citi continues to analyze the aspects of the quasi-territorial tax regime, particularly as it affects the deferred taxes, including indefinite reinvestment assertions, for non-U.S. operations, as well as the interaction with U.S. tax rate reduction. Also included as provisional is Citi’s state income tax charge for Tax Reform due to the uncertainty of how states will interpret the new federal provisions. The remaining $6.2 billion primarily relates to the reduction in the U.S. corporate tax rate and for which the accounting is complete. Second, Citi’s reported valuation allowance of $7.9 billion is a provisional amount, because there is uncertainty under Tax Reform as to the calculation of the deemed repatriation tax on non-U.S. subsidiary earnings, which itself is a provisional amount, and thus the amount of FTC carry-forwards that will be utilized to offset the resulting tax. In addition, such valuation allowance is also affected by uncertainty as to the methodology to be employed to allocate Citi’s FTC carry-forwards and related overall domestic loss among the redefined FTC baskets under Tax Reform, as well as related calculations affecting the usage of its FTCs in future periods. Transitional guidance is expected from the U.S. Treasury on these issues. Citi also continues to analyze the effects on the amount of residual U.S. tax related to its non-U.S. branches.
In all other material respects, Citi has completed its accounting for Tax Reform, and there are no amounts for which a reasonable estimate was not possible.
Additionally, Citi has not yet made a policy election with respect to its treatment of GILTI. Companies can either account for taxes on GILTI as incurred, or recognize deferred taxes when basis differences exist that are expected to impact the amount of the GILTI inclusion upon reversal.
Citi is still in the process of analyzing the provisions of Tax Reform associated with GILTI and the expected future impact.
See Note 9 to the Consolidated Financial Statements for a further description of the Company’s tax provision and related income tax assets and liabilities.
Commissions, Underwriting and Principal Transactions
Commissions revenues are recognized in income when earned. Underwriting revenues are recognized in income typically at the closing of the transaction. Principal transactions revenues are recognized in income on a trade-date basis. See Note 5 to the Consolidated Financial Statements for a description of the Company’s revenue recognition policies for commissions and fees, and Note 6 to the Consolidated Financial Statements for details of principal transactions revenue.
Earnings per Share
Earnings per share (EPS) is computed after deducting preferred stock dividends. The Company has granted restricted and deferred share awards with dividend rights that are considered to be participating securities, which are akin to a second class of common stock. Accordingly, a portion of Citigroup’s earnings is allocated to those participating securities in the EPS calculation.
Basic earnings per share is computed by dividing income available to common stockholders after the allocation of dividends and undistributed earnings to the participating securities by the weighted average number of common shares outstanding for the period. Diluted earnings per share reflects the potential dilution that could occur if securities or other contracts to issue common stock were exercised. It is computed after giving consideration to the weighted average dilutive effect of the Company’s stock options and warrants and convertible securities and after the allocation of earnings to the participating securities. Anti-dilutive options and warrants are disregarded in the EPS calculations.
Use of Estimates
Management must make estimates and assumptions that affect the Consolidated Financial Statements and the related Notes to the Consolidated Financial Statements. Such estimates are used in connection with certain fair value measurements. See Note 24 to the Consolidated Financial Statements for further discussions on estimates used in the determination of fair value. Moreover, estimates are significant in determining the amounts of other-than-temporary impairments, impairments of goodwill and other intangible assets, provisions for probable losses that may arise from credit-related exposures and probable and estimable losses related to litigation and regulatory proceedings, and income taxes. While management makes its best judgment, actual amounts or results could differ from those estimates.
Cash Flows
Cash equivalents are defined as those amounts included in Cash and due from banks. Cash flows from risk management activities are classified in the same category as the related assets and liabilities.
Related Party Transactions
The Company has related party transactions with certain of its subsidiaries and affiliates. These transactions, which are primarily short-term in nature, include cash accounts, collateralized financing transactions, margin accounts, derivative transactions, charges for operational support and the borrowing and lending of funds, and are entered into in the ordinary course of business.
ACCOUNTING CHANGES
Reclassification of Certain Tax Effects from Accumulated Other Comprehensive Income
On February 14, 2018, the Financial Accounting Standards Board (FASB) issued ASU No. 2018-02, Reclassification of Certain Tax Effects from Accumulated Other Comprehensive Income. The ASU allows a reclassification from Accumulated other comprehensive income (loss) (AOCI) to Retained earnings for the deferred taxes previously recorded in AOCI that exceed the current federal tax rate of 21% resulting from the newly enacted corporate tax rate in the Tax Cuts and Jobs Act (Tax Reform) and other stranded tax amounts related to the application of Tax Reform that Citi elects to reclassify. The ASU allows adjustments to reclassification amounts in subsequent periods as a result of changes to the amounts recorded under SAB 118. If adopted, the ASU is effective in years beginning after December 15, 2018, but permits early adoption in a period for which financial statements have not yet been issued. Citi has elected to early adopt the ASU, which affects only the period that the effects related to Tax Reform are recognized. In addition to the reclassification of deferred taxes recorded in AOCI that exceed the current federal tax rate, Citi has also reclassified amounts recorded in AOCI related to the effects of the shift to a territorial system related to the application of Tax Reform using the portfolio method.
The effect of adopting the ASU resulted in an increase of $3.3 billion to Retained earnings at December 31, 2017 due to the reclassification of AOCI to Retained earnings. This amount is provisional because more information needs to be obtained and analyzed related to Tax Reform as noted above and, thus, the amount to be reclassified
may change in 2018.
Premium Amortization on Purchased Callable Debt Securities
In March 2017, the FASB issued ASU No. 2017-08, Receivables—Nonrefundable Fees and Other Costs (Subtopic 310-20): Premium Amortization on Purchased Callable Debt Securities, which amends the amortization period for certain purchased callable debt securities held at a premium. The ASU requires entities to amortize premiums on debt securities by the first call date when the securities
have fixed and determinable call dates and prices. The scope of the ASU includes all accounting premiums, such as purchase premiums and cumulative fair value hedge adjustments. The ASU does not change the accounting for discounts, which continue to be recognized over the contractual life of a security.
The ASU is effective as of January 1, 2019, but it may be early adopted in any interim or year-end period after issuance. Adoption of the ASU is on a modified retrospective basis through a cumulative effect adjustment to retained earnings as of the beginning of the year of adoption. Citi early adopted the ASU in the second quarter of 2017, with an effective date of January 1, 2017. Adoption of the ASU primarily affected Citi’s available-for-sale (AFS) and held-to-maturity (HTM) portfolios of callable state and municipal securities. The ASU adoption resulted in a net reduction to total stockholders’ equity of $156 million (after tax), effective as of January 1, 2017. This amount is composed of a reduction of approximately $660 million to retained earnings for the incremental amortization of purchase premiums and cumulative hedge adjustments generated under fair value hedges of these callable debt securities, offset by an increase to AOCI of $504 million related to the cumulative fair value hedge adjustments reclassified to retained earnings for AFS securities.
Financial statements for periods prior to 2017 were not subject to restatement under the provisions of this ASU. The amortization recorded in each of quarter of 2017 and cumulatively as of each quarter end under the provisions of the ASU was not materially different than the amount that would have been recorded if the ASU had not been early adopted.
Accounting for Stock-Based Compensation
In March 2016, the FASB issued ASU No. 2016-09, Compensation—Stock Compensation (Topic 718): Improvements to Employee Share-Based Payment Accounting in order to simplify certain complex aspects of the accounting for income taxes and forfeitures related to employee stock-based compensation. The guidance became effective for Citi beginning on January 1, 2017. Under the new standard, excess tax benefits and deficiencies related to employee stock-based compensation are recognized directly within Income tax expense or benefit in Citi’s Consolidated Statement of Income, rather than within Additional paid-in capital. The impact of this change was not material in the first quarter of 2017 or each subsequent quarterly periods of 2017 as the majority of employees’ deferred stock-based compensation awards are granted within the first quarter of each year, and therefore vest within the first quarter of each year, commensurate with vesting in equal annual installments. For additional information on these receivables and payables, see Note 7 to the Consolidated Financial Statements.
Additionally, as permitted under the new guidance, Citi made an accounting policy election to account for forfeitures of awards as they occur, which represents a change from the previous requirement to estimate forfeitures when recognizing compensation expense. This change resulted in a
cumulative effect adjustment to retained earnings that was not material at January 1, 2017.
Recognition and Measurement of Financial Assets and Financial Liabilities
In January 2016, the FASB issued ASU No. 2016-01, Financial Instruments—Overall (Subtopic 825-10): Recognition and Measurement of Financial Assets and Financial Liabilities, which addresses certain aspects of recognition, measurement, presentation and disclosure of financial instruments.
This ASU requires entities to present separately in AOCI the portion of the total change in the fair value of a liability resulting from a change in the instrument-specific credit risk when the entity has elected to measure the liability at fair value in accordance with the fair value option for financial instruments. It also requires equity investments (except those accounted for under the equity method of accounting or those that result in consolidation of the investee) to be measured at fair value with changes in fair value recognized in net income, thus eliminating eligibility for the current available-for-sale category. However, Federal Reserve Bank and Federal Home Loan Bank stock, as well as certain exchange seats, will continue to be presented at cost. The ASU also introduces a measurement alternative for non-marketable equity securities.
Citi early adopted only the provisions of this ASU related to presentation of the change in fair value of liabilities for which the fair value option was elected, related to changes in Citigroup’s own credit spreads in AOCI effective January 1, 2016. Accordingly, since the first quarter of 2016, these amounts have been reflected as a component of AOCI, whereas these amounts were previously recognized in Citigroup’s revenues and net income. The impact of adopting this amendment resulted in a cumulative catch-up reclassification from retained earnings to AOCI of an accumulated after-tax loss of approximately $15 million at January 1, 2016. Financial statements for periods prior to 2016 were not subject to restatement under the provisions of this ASU. For additional information, see Notes 19, 24 and 25 to the Consolidated Financial Statements. Citi adopted the other provisions of ASU 2016-01 on January 1, 2018. The ASU does not have a significant impact on the Company’s Consolidated Financial Statements and related disclosures.
2. DISCONTINUED OPERATIONS AND SIGNIFICANT DISPOSALS
Summary of Discontinued Operations
The Company’s discontinued operations consisted of residual activities related to the sales of the Brazil Credicard business in 2013, the Egg Banking plc Credit Card Business in 2011 and the German Retail Banking business in 2008. All discontinued operations results are recorded within Corporate/Other.
The following summarizes financial information for all discontinued operations:
|
|
|
|
|
|
|
|
|
|
|
|
In millions of dollars
|
2017 |
2016 |
2015 |
Total revenues, net of interest expense |
$ |
— |
|
$ |
— |
|
$ |
— |
|
Income (loss) from discontinued operations |
$ |
(104 |
) |
$ |
(80 |
) |
$ |
(83 |
) |
Provision (benefit) for income taxes |
7 |
|
(22 |
) |
(29 |
) |
Loss from discontinued operations, net of taxes |
$ |
(111 |
) |
$ |
(58 |
) |
$ |
(54 |
) |
Cash flows for discontinued operations were not material for all periods presented.
Significant Disposals
The transactions during 2017, 2016 and 2015 described below were identified as significant disposals. The major classes of assets and liabilities derecognized from the Consolidated Balance Sheet at closing, and the income (loss) before taxes related to each business until the disposal date, are presented below.
Sale of Mexico Asset Management Business
On November 27, 2017, Citi entered into an agreement to sell its Mexico asset management business, which is part of Latin America GCB. The transaction is expected to result in a pretax gain on sale at closing, which is anticipated to occur during the second half of 2018, subject to regulatory approval and other customary closing conditions. The transaction will also result in derecognition of approximately $72 million of net book value, including $32 million of goodwill. Income before taxes of the business was as follows:
|
|
|
|
|
|
|
|
|
|
|
In millions of dollars |
2017 |
2016 |
2015 |
Income before taxes |
$ |
164 |
|
$ |
155 |
|
$ |
159 |
|
Sale of Fixed Income Analytics and Index Business
On August 31, 2017, Citi completed the sale of a fixed income analytics business (Yield Book) and a fixed income index business that were part of Markets and Securities Services within Institutional Clients Group (ICG). As part of the sale, Citi derecognized total assets of $112 million, including goodwill of $72 million, while the derecognized liabilities were $18 million. The transaction generated a pretax gain on sale of $580 million ($355 million after-tax) recorded in Other Revenue in ICG during 2017.
Income before taxes for the divested businesses, excluding the pretax gain on sale, was as follows:
|
|
|
|
|
|
|
|
|
|
|
In millions of dollars |
2017 |
2016 |
2015 |
Income before taxes |
$ |
31 |
|
$ |
55 |
|
$ |
54 |
|
Exit of U.S. Mortgage Service Operations
Citigroup executed agreements during the first quarter of 2017 to effectively exit its direct U.S. mortgage servicing operations by the end of 2018 to intensify focus on originations. The exit of the mortgage servicing operations included the sale of mortgage servicing rights and execution of a subservicing agreement for the remaining Citi-owned loans and certain other mortgage servicing rights. As part of this transaction, Citi has also transferred certain employees.
This transaction, which was part of Corporate/Other, resulted in a pretax loss of $331 million ($207 million after-tax) recorded in Other revenue during 2017. The loss on sale did not include certain other costs and charges related to the disposed operation recorded primarily in Operating expenses during 2017, resulting in a total pretax loss of $382 million. As part of the completed sale, during 2017, Citi derecognized a total of $1,162 million of servicing-related assets, including $1,046 million of mortgage servicing rights, related to approximately 750,000 Fannie Mae and Freddie Mac held loans with outstanding balances of approximately $93 billion. Excluding the loss on sale and the additional charges, income before taxes for the disposed operation was immaterial for 2017, 2016 and 2015.
Sale of CitiFinancial Canada Consumer Finance Business
On March 31, 2017, Citi completed the sale of CitiFinancial Canada (CitiFinancial), which was part of Corporate/Other, and included 220 retail branches and approximately 1,400 employees. As part of the sale, Citi derecognized total assets of approximately $1.9 billion, including $1.7 billion consumer loans (net of allowance), and total liabilities of approximately $1.5 billion related to intercompany borrowings, which were settled at closing of the transaction. Separately, during 2017 and prior to closing of the transaction, CitiFinancial settled $0.4 billion of debt issued through loan securitizations. The sale of CitiFinancial generated a pretax gain on sale of $350 million recorded in Other revenue ($178 million after-tax) during 2017.
Income before taxes, excluding the pretax gain on sale, was as follows:
|
|
|
|
|
|
|
|
|
|
|
In millions of dollars |
2017 |
2016 |
2015 |
Income before taxes |
$ |
41 |
|
$ |
139 |
|
$ |
118 |
|
Novation of the Primerica 80% Coinsurance Agreement
Effective January 1, 2016, Citi completed a novation (an
arrangement that extinguishes Citi’s rights and obligations
under a contract) of the Primerica 80% coinsurance
agreement, which was recorded in Corporate/Other, to a third-party re-insurer. The novation resulted in revenues of $404 million recorded in Other revenue ($263 million after-tax) during 2016. Furthermore, the novation resulted in derecognition of $1.5 billion of available-for-sale securities and cash, $0.95 billion of deferred acquisition costs and $2.7 billion of insurance liabilities.
Income before taxes, excluding the revenue upon
novation, was as follows:
|
|
|
|
|
|
|
|
|
|
|
In millions of dollars |
2017 |
2016 |
2015 |
Income before taxes |
$ |
— |
|
$ |
— |
|
$ |
135 |
|
Sale of OneMain Financial Business
On November 15, 2015, Citi sold OneMain Financial (OneMain), which was part of Corporate/Other, including 1,100 retail branches, 5,500 employees and approximately 1.3 million customer accounts. OneMain had approximately $10.2 billion of assets, including $7.8 billion of loans (net of allowance), and $1.4 billion of available-for-sale securities. OneMain also had $8.4 billion of liabilities, including $6.2 billion of long-term debt and $1.1 billion of short-term borrowings. The transaction generated a pretax gain on sale of $2.6 billion, recorded in Other revenue ($1.6 billion after-tax) in 2015. However, when combined with the loss on redemption of certain long-term debt supporting certain Corporate/Other assets during the fourth quarter of 2015, the resulting net after-tax gain was $0.8 billion.
Income before taxes, excluding the pretax gain on sale and loss on redemption of debt, was as follows:
|
|
|
|
|
|
|
|
|
|
|
In millions of dollars |
2017 |
2016 |
2015 |
Income before taxes |
$ |
— |
|
$ |
— |
|
$ |
663 |
|
Sale of Japan Cards Business
On December 14, 2015, Citi sold its Japan cards business, which was part of Corporate/Other, including $1,350 million of consumer loans (net of allowance), approximately 720,000 customer accounts and 840 employees. The transaction generated a pretax gain on sale of $180 million, recorded in Other revenue ($155 million after-tax) in 2015.
Loss before taxes, excluding the pretax gain on sale, was as follows:
|
|
|
|
|
|
|
|
|
|
|
In millions of dollars |
2017 |
2016 |
2015 |
Loss before taxes |
$ |
— |
|
$ |
— |
|
$ |
(5 |
) |
Sale of Japan Retail Banking Business
On November 1, 2015, Citi sold its Japan retail banking business, which was part of Corporate/Other, including $563 million of consumer loans (net of allowance), $20 billion of deposits, approximately 725,000 customer accounts, 1,600 employees and 32 branches. The transaction generated a pretax gain on sale of $446 million, recorded in Other revenue ($276 million after-tax) in 2015.
Loss before taxes, excluding the pretax gain on sale, was as follows:
|
|
|
|
|
|
|
|
|
|
|
In millions of dollars |
2017 |
2016 |
2015 |
Loss before taxes |
$ |
— |
|
$ |
— |
|
$ |
(57 |
) |
3. BUSINESS SEGMENTS
Citigroup’s activities are conducted through the following business segments: Global Consumer Banking (GCB) and Institutional Clients Group (ICG). In addition, Corporate/Other includes activities not assigned to a specific business segment as well as certain North America and international loan portfolios, other legacy assets and discontinued operations.
The business segments are determined based on products and services provided or type of customers served, of which those identified as non-core are recorded in Corporate/Other and are reflective of how management currently evaluates financial information to make business decisions.
GCB includes a global, full-service consumer franchise delivering a wide array of banking, including commercial banking, credit card lending and investment services through a network of local branches, offices and electronic delivery systems and is composed of three GCB businesses: North America, Latin America and Asia (including consumer banking activities in certain EMEA countries).
ICG is composed of Banking and Markets and securities services and provides corporate, institutional, public sector and high-net-worth clients in 97 countries and jurisdictions with a broad range of banking and financial products and services.
Corporate/Other includes certain unallocated costs of global functions, other corporate expenses and net treasury
results, unallocated corporate expenses, offsets to certain line-item reclassifications and eliminations, the results of certain North America and international legacy loan portfolios, discontinued operations and unallocated taxes.
The accounting policies of these reportable segments are the same as those disclosed in Note 1 to the Consolidated Financial Statements.
The prior-period balances reflect reclassifications to conform the presentation for all periods to the current period’s presentation. Financial data was reclassified to reflect:
|
|
• |
the reporting of the remaining businesses and portfolios of assets of Citi Holdings as part of Corporate/Other (prior to the first quarter of 2017, Citi Holdings was a separately reported business segment);
|
|
|
• |
the re-attribution of certain treasury-related costs between Corporate/Other, GCB and ICG;
|
|
|
• |
the re-attribution of regional revenues within ICG; and
|
|
|
• |
certain other immaterial reclassifications. |
Citi’s consolidated results remain unchanged for all periods presented as a result of the changes and reclassifications discussed above.
The following table presents certain information regarding the Company’s continuing operations by segment:
|
|
|
|
|
|
|
|
|
|
|
|
|
|
|
|
|
|
|
|
|
|
|
|
|
|
|
|
|
|
|
|
|
|
|
|
Revenues,
net of interest expense(1)
|
Provision (benefits)
for income taxes(2)
|
Income (loss) from
continuing operations(2)(3)
|
Identifiable assets |
In millions of dollars, except identifiable assets in billions |
2017 |
2016 |
2015 |
2017 |
2016 |
2015 |
2017 |
2016 |
2015 |
2017 |
2016 |
Global Consumer Banking |
$ |
32,697 |
|
$ |
31,519 |
|
$ |
32,251 |
|
$ |
3,320 |
|
$ |
2,655 |
|
$ |
3,369 |
|
$ |
3,893 |
|
$ |
4,954 |
|
$ |
6,214 |
|
$ |
429 |
|
$ |
412 |
|
Institutional Clients Group |
35,667 |
|
33,227 |
|
33,332 |
|
7,008 |
|
4,260 |
|
4,173 |
|
9,066 |
|
9,525 |
|
9,110 |
|
1,336 |
|
1,277 |
|
Corporate/Other |
3,085 |
|
5,129 |
|
10,771 |
|
19,060 |
|
(471 |
) |
(102 |
) |
(19,586 |
) |
554 |
|
2,062 |
|
77 |
|
103 |
|
Total |
$ |
71,449 |
|
$ |
69,875 |
|
$ |
76,354 |
|
$ |
29,388 |
|
$ |
6,444 |
|
$ |
7,440 |
|
$ |
(6,627 |
) |
$ |
15,033 |
|
$ |
17,386 |
|
$ |
1,842 |
|
$ |
1,792 |
|
|
|
(1) |
Includes total revenues, net of interest expense (excluding Corporate/Other), in North America of $33.9 billion, $32.2 billion and $32.2 billion; in EMEA of $10.7 billion, $9.9 billion and $9.8 billion; in Latin America of $9.4 billion, $8.9 billion and $9.7 billion; and in Asia of $14.4 billion, $13.7 billion and $13.9 billion in 2017, 2016 and 2015, respectively.
|
|
|
(2) |
Corporate/Other, GCB and ICG 2017 results include the impact of Tax Reform. See Notes 1 and 9 to the Consolidated Financial Statements.
|
|
|
(3) |
Includes pretax provisions for credit losses and for benefits and claims in the GCB results of $7.6 billion, $6.4 billion and $5.5 billion; in the ICG results of ($15) million, $486 million and $962 million; and in Corporate/Other results of ($175) million, $69 million and $1.5 billion in 2017, 2016 and 2015, respectively.
|
4. INTEREST REVENUE AND EXPENSE
Interest revenue and Interest expense consisted of the following:
|
|
|
|
|
|
|
|
|
|
|
In millions of dollars |
2017 |
2016 |
2015 |
Interest revenue |
|
|
|
Loan interest, including fees |
$ |
41,361 |
|
$ |
39,752 |
|
$ |
40,510 |
|
Deposits with banks |
1,635 |
|
971 |
|
727 |
|
Federal funds sold and securities borrowed or purchased under agreements to resell |
3,248 |
|
2,543 |
|
2,516 |
|
Investments, including dividends |
8,295 |
|
7,582 |
|
7,017 |
|
Trading account assets(1)
|
5,502 |
|
5,738 |
|
5,942 |
|
Other interest(2)
|
1,163 |
|
1,029 |
|
1,839 |
|
Total interest revenue |
$ |
61,204 |
|
$ |
57,615 |
|
$ |
58,551 |
|
Interest expense |
|
|
|
Deposits(3)
|
$ |
6,586 |
|
$ |
5,300 |
|
$ |
5,052 |
|
Federal funds purchased and securities loaned or sold under agreements to repurchase |
2,661 |
|
1,912 |
|
1,612 |
|
Trading account liabilities(1)
|
638 |
|
410 |
|
217 |
|
Short-term borrowings |
1,059 |
|
477 |
|
523 |
|
Long-term debt |
5,573 |
|
4,412 |
|
4,517 |
|
Total interest expense |
$ |
16,517 |
|
$ |
12,511 |
|
$ |
11,921 |
|
Net interest revenue |
$ |
44,687 |
|
$ |
45,104 |
|
$ |
46,630 |
|
Provision for loan losses |
7,503 |
|
6,749 |
|
7,108 |
|
Net interest revenue after provision for loan losses |
$ |
37,184 |
|
$ |
38,355 |
|
$ |
39,522 |
|
|
|
(1) |
Interest expense on Trading account liabilities of ICG is reported as a reduction of interest revenue from Trading account assets.
|
|
|
(2) |
During 2015, interest earned related to assets of significant disposals (primarily OneMain Financial) was reclassified to Other interest.
|
|
|
(3) |
Includes deposit insurance fees and charges of $1,249 million, $1,145 million and $1,118 million for 2017, 2016 and 2015, respectively.
|
5. COMMISSIONS AND FEES
The primary components of Citi’s Commissions and fees revenue are investment banking fees, trading-related fees, fees related to trade and securities services in ICG and credit card and bank card fees.
Investment banking fees are substantially composed of underwriting and advisory revenues and are recognized when Citigroup’s performance under the terms of a contractual arrangement is completed, which is typically at the closing of a transaction. Underwriting revenue is recorded in Commissions and fees, net of both reimbursable and non-reimbursable expenses, consistent with the AICPA Accounting Guide for Brokers and Dealers in Securities (codified in ASC 940-605-05-1). Expenses associated with advisory transactions are recorded in Other operating expenses, net of client reimbursements. Out-of-pocket expenses are deferred and recognized at the time the related revenue is recognized. In general, expenses incurred related to investment banking transactions that fail to close (are not consummated) are recorded gross in Other operating expenses.
Trading-related fees primarily include commissions and fees from the following: executing transactions for clients on
exchanges and over-the-counter markets; sales of mutual funds and other annuity products; and assisting clients in clearing transactions, providing brokerage services and other such activities. Trading-related fees are recognized when earned in Commissions and fees. Gains or losses, if any, on these transactions are included in Principal transactions (see Note 6 to the Consolidated Financial Statements).
Credit card and bank card fees are primarily composed of interchange revenue and certain card fees, including annual fees, reduced by reward program costs and certain partner payments. Interchange revenue and fees are recognized when earned. Annual card fees are deferred and amortized on a straight-line basis over a 12-month period. Reward costs are recognized when points are earned by the customers.
Insurance premiums consists of premium income from insurance policies which Citi has underwritten and sold to policyholders. Insurance distribution revenue consists of commissions earned from third party insurance companies for marketing and selling insurance policies on behalf of such entities.
The following table presents Commissions and fees revenue:
|
|
|
|
|
|
|
|
|
|
|
In millions of dollars |
2017 |
2016 |
2015 |
Investment banking |
$ |
3,613 |
|
$ |
2,847 |
|
$ |
3,423 |
|
Trading-related |
3,015 |
|
2,799 |
|
3,138 |
|
Trade and securities services |
1,632 |
|
1,564 |
|
1,735 |
|
Credit cards and bank cards |
1,510 |
|
1,324 |
|
1,786 |
|
Corporate finance(1)
|
713 |
|
686 |
|
493 |
|
Other consumer(2)
|
703 |
|
659 |
|
685 |
|
Insurance distribution revenue(3)
|
514 |
|
548 |
|
621 |
|
Insurance premiums (3)
|
122 |
|
288 |
|
1,224 |
|
Checking-related |
478 |
|
467 |
|
497 |
|
Loan servicing |
312 |
|
325 |
|
404 |
|
Other |
327 |
|
431 |
|
479 |
|
Total commissions and fees |
$ |
12,939 |
|
$ |
11,938 |
|
$ |
14,485 |
|
|
|
(1) |
Consists primarily of fees earned from structuring and underwriting loan syndications. |
|
|
(2) |
Primarily consists of fees for investment fund administration and management, third-party collections, commercial demand deposit accounts and certain credit card services. |
|
|
(3) |
Insurance premiums were previously separately reported on the Consolidated Statement of Income. |
6. PRINCIPAL TRANSACTIONS
Citi’s Principal transactions revenue consists of realized and unrealized gains and losses from trading activities. Trading activities include revenues from fixed income, equities, credit and commodities products and foreign exchange transactions that are managed on a portfolio basis characterized by primary risk. Not included in the table below is the impact of net interest revenue related to trading activities, which is an integral part of trading activities’ profitability. For additional information regarding Principal transactions revenue, see Note 4 to the Consolidated Financial Statements for
information about net interest revenue related to trading activities. Principal transactions include CVA (credit valuation adjustments on derivatives), FVA (funding valuation adjustments) on over-the-counter derivatives and, prior to 2016, DVA (debt valuation adjustments on issued liabilities for which the fair value option has been elected). These adjustments are discussed further in Note 24 to the Consolidated Financial Statements.
The following table presents Principal transactions revenue:
|
|
|
|
|
|
|
|
|
|
|
In millions of dollars |
2017 |
2016 |
2015 |
Global Consumer Banking(1)
|
$ |
570 |
|
$ |
629 |
|
$ |
577 |
|
Institutional Clients Group |
7,740 |
|
7,335 |
|
5,824 |
|
Corporate/Other(1)
|
858 |
|
(379 |
) |
(393 |
) |
Total Citigroup |
$ |
9,168 |
|
$ |
7,585 |
|
$ |
6,008 |
|
Interest rate risks(2)
|
$ |
5,124 |
|
$ |
4,115 |
|
$ |
3,798 |
|
Foreign exchange risks(3)
|
2,488 |
|
1,726 |
|
1,532 |
|
Equity risks(4)
|
491 |
|
189 |
|
331 |
|
Commodity and other risks(5)
|
294 |
|
806 |
|
750 |
|
Credit products and risks(6)
|
771 |
|
749 |
|
(403 |
) |
Total |
$ |
9,168 |
|
$ |
7,585 |
|
$ |
6,008 |
|
(1) Primarily relates to foreign exchange risks.
|
|
(2) |
Includes revenues from government securities and corporate debt, municipal securities, mortgage securities and other debt instruments. Also includes spot and forward trading of currencies and exchange-traded and over-the-counter (OTC) currency options, options on fixed income securities, interest rate swaps, currency swaps, swap options, caps and floors, financial futures, OTC options and forward contracts on fixed income securities. |
|
|
(3) |
Includes revenues from foreign exchange spot, forward, option and swap contracts, as well as foreign currency translation (FX translation) gains and losses. |
|
|
(4) |
Includes revenues from common, preferred and convertible preferred stock, convertible corporate debt, equity-linked notes and exchange-traded and OTC equity options and warrants. |
|
|
(5) |
Primarily includes revenues from crude oil, refined oil products, natural gas and other commodities trades. |
|
|
(6) |
Includes revenues from structured credit products. |
7. INCENTIVE PLANS
Discretionary Annual Incentive Awards
Citigroup grants immediate cash bonus payments and various forms of immediate and deferred awards as part of its discretionary annual incentive award program involving a large segment of Citigroup’s employees worldwide. Most of the shares of common stock issued by Citigroup as part of its equity compensation programs are to settle the vesting of the stock components of these awards.
Discretionary annual incentive awards are generally awarded in the first quarter of the year based upon the previous year’s performance. Awards valued at less than U.S. $100,000 (or the local currency equivalent) are generally paid entirely in the form of an immediate cash bonus. Pursuant to Citigroup policy and/or regulatory requirements, certain employees and officers are subject to mandatory deferrals of incentive pay and generally receive 25% to 60% of their awards in a combination of restricted or deferred stock, deferred cash stock units, or deferred cash. Discretionary annual incentive awards to many employees in the EU are subject to deferral requirements regardless of the total award value, with 50% of the immediate incentive delivered in the form of a stock payment or stock unit award subject to a restriction on sale or transfer or hold back (generally, for twelve months).
Deferred annual incentive awards may be delivered in the form of one or more award types—a restricted or deferred stock award under Citi’s Capital Accumulation Program (CAP), or a deferred cash stock unit award and/or a deferred cash award under Citi’s Deferred Cash Award Plan. The applicable mix of awards may vary based on the employee’s minimum deferral requirement and the country of employment.
Subject to certain exceptions (principally, for retirement-eligible employees), continuous employment within Citigroup is required to vest in CAP, deferred cash stock unit and deferred cash awards. Post employment vesting by retirement-eligible employees and participants who meet other conditions is generally conditioned upon their refraining from competition with Citigroup during the remaining vesting period, unless the employment relationship has been terminated by Citigroup under certain conditions.
Generally, the deferred awards vest in equal annual installments over three- or four-year periods. Vested CAP awards are delivered in shares of common stock. Deferred cash awards are payable in cash and, except as prohibited by applicable regulatory guidance, earn a fixed notional rate of interest that is paid only if and when the underlying principal award amount vests. Deferred cash stock unit awards are payable in cash at the vesting value of the underlying stock. Generally, in the EU, vested CAP shares are subject to a restriction on sale or transfer after vesting, and vested deferred cash awards and deferred cash stock units are subject to hold back (generally, for twelve months in each case).
Unvested CAP, deferred cash stock units and deferred cash awards are subject to one or more clawback provisions that apply in certain circumstances, including gross misconduct. CAP and deferred cash stock unit awards, made
to certain employees, are subject to a formulaic performance-based vesting condition pursuant to which amounts otherwise scheduled to vest will be reduced based on the amount of any pretax loss in the participant’s business in the calendar year preceding the scheduled vesting date. A minimum reduction of 20% applies for the first dollar of loss for CAP and deferred cash stock unit awards.
In addition, deferred cash awards are subject to a discretionary performance-based vesting condition under which an amount otherwise scheduled to vest may be reduced in the event of a “material adverse outcome” for which a participant has “significant responsibility.” These awards are also subject to an additional clawback provision pursuant to which unvested awards may be canceled if the employee engaged in misconduct or exercised materially imprudent judgment, or failed to supervise or escalate the behavior of other employees who did.
Sign-on and Long-Term Retention Awards
Stock awards and deferred cash awards may be made at various times during the year as sign-on awards to induce new hires to join Citi or to high-potential employees as long-term retention awards.
Vesting periods and other terms and conditions pertaining to these awards tend to vary by grant. Generally, recipients must remain employed through the vesting dates to vest in the awards, except in cases of death, disability or involuntary termination other than for gross misconduct. These awards do not usually provide for post-employment vesting by retirement-eligible participants.
Outstanding (Unvested) Stock Awards
A summary of the status of unvested stock awards granted as discretionary annual incentive or sign-on and long-term retention awards is presented below:
|
|
|
|
|
|
|
Unvested stock awards |
Shares |
Weighted-
average grant
date fair
value per share
|
Unvested at December 31, 2016 |
42,672,176 |
|
$ |
43.24 |
|
Granted(1)
|
13,914,752 |
|
59.12 |
|
Canceled |
(1,335,297 |
) |
47.29 |
|
Vested(2)
|
(18,320,591 |
) |
45.63 |
|
Unvested at December 31, 2017 |
36,931,040 |
|
$ |
47.89 |
|
|
|
(1) |
The weighted-average fair value of the shares granted during 2016 and 2015 was $37.35 and $50.33, respectively.
|
|
|
(2) |
The weighted-average fair value of the shares vesting during 2017 was approximately $57.45 per share.
|
Total unrecognized compensation cost related to unvested stock awards was $530 million at December 31, 2017. The cost is expected to be recognized over a weighted-average period of 1.6 years.
Performance Share Units
Certain executive officers were awarded a target number of performance share units (PSUs) each February from 2014 to 2017, for performance in the year prior to the award date. For grants prior to 2016, PSUs will be earned only to the extent that Citigroup attains specified performance goals relating to Citigroup’s return on assets and relative total shareholder return against peers over the three-year period beginning with the year of award. The actual dollar amounts ultimately earned could vary from zero, if performance goals are not met, to as much as 150% of target, if performance goals are meaningfully exceeded.
The PSUs granted in February 2016 are earned over a three-year performance period based on Citigroup’s relative total shareholder return as compared to peers. The actual dollar amounts ultimately earned could vary from zero, if performance goals are not met, to as much as 150% of target, if performance goals are meaningfully exceeded.
The PSUs granted in February 2017 are earned over a three-year performance period based half on return on tangible common equity performance in 2019, and the remaining half on cumulative earnings per share over 2017 to 2019.
For the PSUs awarded in 2016 and 2017, if the total shareholder return is negative over the three-year performance period, executives may earn no more than 100% of the target PSUs, regardless of the extent to which Citi outperforms peer firms.
For all award years, the value of each PSU is equal to the value of one share of Citi common stock. Dividend equivalents will be accrued and paid on the number of earned PSUs after the end of the performance period.
PSUs are subject to variable accounting, pursuant to which the associated value of the award will fluctuate with changes in Citigroup’s stock price and the attainment of the specified performance goals for each award, until the award is settled solely in cash after the end of the performance period. The value of the award, subject to the performance goals, is estimated using a simulation model that incorporates multiple valuation assumptions, including the probability of achieving the specified performance goals of each award. The risk-free rate used in the model is based on the applicable U.S. Treasury yield curve. Other significant assumptions for the awards are as follows:
|
|
|
|
|
|
|
|
Valuation Assumptions |
2017 |
2016 |
2015 |
Expected volatility |
25.79 |
% |
24.37 |
% |
27.13 |
% |
Expected dividend yield |
1.30 |
% |
0.40 |
% |
0.08 |
% |
A summary of the performance share unit activity for 2017 is presented below:
|
|
|
|
|
|
|
Performance Share Units |
Units |
Weighted-
average grant
date fair
value per unit
|
Outstanding, beginning of period |
1,844,560 |
|
$ |
38.22 |
|
Granted(1)
|
500,609 |
|
59.22 |
|
Canceled |
(277,546 |
) |
48.34 |
|
Payments |
(280,897 |
) |
48.34 |
|
Outstanding, end of period |
1,786,726 |
|
$ |
40.94 |
|
(1) The weighted-average grant date fair value per unit awarded in 2016 and 2015 was $27.03 and $44.07, respectively.
PSUs granted in 2015 and 2017 were equitably adjusted after the enactment of Tax Reform, as required under the terms of those awards. The adjustments were intended to reproduce the expected value of the awards immediately prior to the passage of Tax Reform.
Stock Option Programs
All outstanding stock options are fully vested with the related expense recognized as a charge to income in prior periods. Generally, the stock options outstanding have a six-year term, with some stock options subject to various transfer restrictions. Cash received from employee stock option exercises under this program for the year ended December 31, 2017 was approximately $14 million.
Information with respect to stock option activity under Citigroup’s stock option programs is shown below:
|
|
|
|
|
|
|
|
|
|
|
|
|
|
|
|
|
|
|
|
|
|
|
|
|
|
|
2017 |
2016 |
2015 |
|
Options |
Weighted-
average
exercise
price
|
Intrinsic
value
per share
|
Options |
Weighted-
average
exercise
price
|
Intrinsic
value
per share
|
Options |
Weighted-
average
exercise
price
|
Intrinsic
value
per share
|
Outstanding, beginning of period |
1,527,396 |
|
$ |
131.78 |
|
$ |
— |
|
6,656,588 |
|
$ |
67.92 |
|
$ |
— |
|
26,514,119 |
|
$ |
48.00 |
|
$ |
6.11 |
|
Canceled |
— |
|
— |
|
— |
|
(25,334 |
) |
40.80 |
|
— |
|
(7,901 |
) |
40.80 |
|
— |
|
Expired |
— |
|
— |
|
— |
|
(2,613,909 |
) |
48.80 |
|
— |
|
(1,646,581 |
) |
40.85 |
|
— |
|
Exercised |
(388,583 |
) |
43.35 |
|
15.67 |
|
(2,489,949 |
) |
49.10 |
|
6.60 |
|
(18,203,048 |
) |
41.39 |
|
13.03 |
|
Outstanding, end of period |
1,138,813 |
|
$ |
161.96 |
|
$ |
— |
|
1,527,396 |
|
$ |
131.78 |
|
$ |
— |
|
6,656,588 |
|
$ |
67.92 |
|
$ |
— |
|
Exercisable, end of period |
1,138,813 |
|
|
|
|
1,527,396 |
|
|
|
|
|
6,656,588 |
|
|
|
|
|
The following table summarizes information about stock options outstanding under Citigroup’s stock option programs at December 31, 2017:
|
|
|
|
|
|
|
|
|
|
|
|
|
|
|
Options outstanding |
Options exercisable |
Range of exercise prices |
Number
outstanding
|
Weighted-average
contractual life
remaining
|
Weighted-average
exercise price
|
Number
exercisable
|
Weighted-average
exercise price
|
$39.00—$99.99 |
312,309 |
|
3.0 years |
$ |
43.56 |
|
312,309 |
|
$ |
43.56 |
|
$100.00—$199.99 |
502,416 |
|
1.0 year |
147.13 |
|
502,416 |
|
147.13 |
|
$200.00—$299.99 |
124,088 |
|
0.1 years |
240.28 |
|
124,088 |
|
240.28 |
|
$300.00—$399.99 |
200,000 |
|
0.1 years |
335.50 |
|
200,000 |
|
335.50 |
|
Total at December 31, 2017 |
1,138,813 |
|
1.3 years |
$ |
161.96 |
|
1,138,813 |
|
$ |
161.96 |
|
Other Variable Incentive Compensation
Citigroup has various incentive plans globally that are used to motivate and reward performance primarily in the areas of sales, operational excellence and customer satisfaction. Participation in these plans is generally limited to employees who are not eligible for discretionary annual incentive awards. Other forms of variable compensation include monthly commissions paid to Financial Advisors and Mortgage Loan Officers.
Summary
Except for awards subject to variable accounting, the total expense recognized for stock awards represents the grant date fair value of such awards, which is generally recognized as a charge to income ratably over the vesting period, other than for awards to retirement-eligible employees and immediately vested awards. Whenever awards are made or are expected to be made to retirement-eligible employees, the charge to income is accelerated based on when the applicable conditions to retirement eligibility were or will be met. If the employee is retirement eligible on the grant date, or the award is vested at grant date, the entire expense is recognized in the year prior to grant.
Recipients of Citigroup stock awards generally do not have any stockholder rights until shares are delivered upon vesting or exercise, or after the expiration of applicable required holding periods. Recipients of restricted or deferred stock awards and deferred cash stock unit awards, however, may, except as prohibited by applicable regulatory guidance,
be entitled to receive dividends or dividend-equivalent payments during the vesting period. Recipients of restricted stock awards generally are entitled to vote the shares in their award during the vesting period. Once a stock award vests, the shares are freely transferable, unless they are subject to a restriction on sale or transfer for a specified period.
All equity awards granted since April 19, 2005 have been made pursuant to stockholder-approved stock incentive plans that are administered by the Personnel and Compensation Committee of the Citigroup Board of Directors, which is composed entirely of independent non-employee directors.
At December 31, 2017, approximately 39.2 million shares of Citigroup common stock were authorized and available for grant under Citigroup’s 2014 Stock Incentive Plan, the only plan from which equity awards are currently granted.
The 2014 Stock Incentive Plan and predecessor plans permit the use of treasury stock or newly issued shares in connection with awards granted under the plans. Newly issued shares were distributed to settle the vesting of the majority of annual deferred stock awards from 2012 to 2015. Treasury shares were used to settle vestings in 2016 and 2017, and the first quarter of 2018, except where local laws favor newly issued shares. The use of treasury stock or newly issued shares to settle stock awards does not affect the compensation expense recorded in the Consolidated Statement of Income for equity awards.
Incentive Compensation Cost
The following table shows components of compensation expense, relating to certain of the above incentive compensation programs:
|
|
|
|
|
|
|
|
|
|
|
In millions of dollars |
2017 |
2016 |
2015 |
Charges for estimated awards to retirement-eligible employees |
$ |
659 |
|
$ |
555 |
|
$ |
541 |
|
Amortization of deferred cash awards, deferred cash stock units and performance stock units |
354 |
|
336 |
|
325 |
|
Immediately vested stock award expense(1)
|
70 |
|
73 |
|
61 |
|
Amortization of restricted and deferred stock awards(2)
|
474 |
|
509 |
|
461 |
|
Other variable incentive compensation |
694 |
|
710 |
|
773 |
|
Total |
$ |
2,251 |
|
$ |
2,183 |
|
$ |
2,161 |
|
|
|
(1) |
Represents expense for immediately vested stock awards that generally were stock payments in lieu of cash compensation. The expense is generally accrued as cash incentive compensation in the year prior to grant. |
|
|
(2) |
All periods include amortization expense for all unvested awards to non-retirement-eligible employees. |
Future Expenses Associated with Outstanding (Unvested) Awards
Citi expects to record compensation expense in future periods as a result of awards granted for performance in 2017 and prior years. Because the awards contain service or other conditions that will be satisfied in the future, the expense of these already-granted awards is recognized over those future periods. The portion of these awards that is subject to variable accounting will cause the expense amount to fluctuate with changes in Citigroup’s common stock price. Citi's expected future expenses, excluding the impact of forfeitures, cancelations, clawbacks and repositioning-related accelerations that have not yet occurred, are summarized in the table below:
|
|
|
|
|
|
|
|
|
|
|
|
|
|
|
|
|
In millions of dollars |
2018 |
2019 |
2020 |
2021 and beyond(1)
|
Total |
Awards granted in 2017 and prior: |
|
|
|
Deferred stock awards |
$ |
276 |
|
$ |
146 |
|
$ |
67 |
|
$ |
11 |
|
$ |
500 |
|
Deferred cash awards |
170 |
|
94 |
|
38 |
|
8 |
|
310 |
|
Future expense related to awards already granted |
$ |
446 |
|
$ |
240 |
|
$ |
105 |
|
$ |
19 |
|
$ |
810 |
|
Future expense related to awards granted in 2018(2)
|
$ |
238 |
|
$ |
185 |
|
$ |
148 |
|
$ |
111 |
|
$ |
682 |
|
Total |
$ |
684 |
|
$ |
425 |
|
$ |
253 |
|
$ |
130 |
|
$ |
1,492 |
|
|
|
(2) |
Refers to awards granted on or about February 15, 2018, as part of Citi's discretionary annual incentive awards for services performed in 2017. |
8. RETIREMENT BENEFITS
Pension and Postretirement Plans
The Company has several non-contributory defined benefit pension plans covering certain U.S. employees and has various defined benefit pension and termination indemnity plans covering employees outside the U.S.
The U.S. qualified defined benefit plan was frozen effective January 1, 2008 for most employees. Accordingly, no additional compensation-based contributions have been credited to the cash balance portion of the plan for existing plan participants after 2007. However, certain employees covered under the prior final pay plan formula continue to accrue benefits. The Company also offers postretirement health care and life insurance benefits to certain eligible U.S. retired employees, as well as to certain eligible employees outside the U.S.
The Company also sponsors a number of non-contributory, nonqualified pension plans. These plans, which are unfunded, provide supplemental defined pension benefits to certain U.S.
employees. With the exception of certain employees covered under the prior final pay plan formula, the benefits under these plans were frozen in prior years.
The plan obligations, plan assets and periodic plan expense for the Company’s most significant pension and postretirement benefit plans (Significant Plans) are measured and disclosed quarterly, instead of annually. The Significant Plans captured approximately 90% of the Company’s global pension and postretirement plan obligations as of December 31, 2017. All other plans (All Other Plans) are measured annually with a December 31 measurement date.
Net (Benefit) Expense
The following table summarizes the components of net (benefit) expense recognized in the Consolidated Statement of Income for the Company’s pension and postretirement plans, for Significant Plans and All Other Plans:
|
|
|
|
|
|
|
|
|
|
|
|
|
|
|
|
|
|
|
|
|
|
|
|
|
|
|
|
|
|
|
|
|
|
|
|
|
|
|
Pension plans |
Postretirement benefit plans |
|
U.S. plans |
Non-U.S. plans |
U.S. plans |
Non-U.S. plans |
In millions of dollars |
2017 |
2016 |
2015 |
2017 |
2016 |
2015 |
2017 |
2016 |
2015 |
2017 |
2016 |
2015 |
Benefits earned during the year |
$ |
3 |
|
$ |
4 |
|
$ |
6 |
|
$ |
153 |
|
$ |
154 |
|
$ |
168 |
|
$ |
— |
|
$ |
— |
|
$ |
— |
|
$ |
9 |
|
$ |
10 |
|
$ |
12 |
|
Interest cost on benefit obligation |
533 |
|
548 |
|
581 |
|
295 |
|
282 |
|
317 |
|
26 |
|
25 |
|
33 |
|
101 |
|
94 |
|
108 |
|
Expected return on plan assets |
(865 |
) |
(886 |
) |
(893 |
) |
(299 |
) |
(287 |
) |
(323 |
) |
(6 |
) |
(9 |
) |
(3 |
) |
(89 |
) |
(86 |
) |
(105 |
) |
Amortization of unrecognized |
|
|
|
|
|
|
|
|
|
|
|
|
|
|
|
|
|
|
|
|
|
|
|
|
Prior service (benefit) cost |
2 |
|
2 |
|
1 |
|
(3 |
) |
(1 |
) |
2 |
|
— |
|
— |
|
— |
|
(10 |
) |
(10 |
) |
(11 |
) |
Net actuarial loss |
173 |
|
169 |
|
148 |
|
61 |
|
69 |
|
73 |
|
— |
|
(1 |
) |
— |
|
35 |
|
30 |
|
43 |
|
Curtailment loss (gain)(1)
|
6 |
|
13 |
|
14 |
|
— |
|
(2 |
) |
— |
|
— |
|
— |
|
— |
|
— |
|
— |
|
(1 |
) |
Settlement loss (1)
|
— |
|
— |
|
— |
|
12 |
|
6 |
|
44 |
|
— |
|
— |
|
— |
|
— |
|
— |
|
— |
|
Total net (benefit) expense |
$ |
(148 |
) |
$ |
(150 |
) |
$ |
(143 |
) |
$ |
219 |
|
$ |
221 |
|
$ |
281 |
|
$ |
20 |
|
$ |
15 |
|
$ |
30 |
|
$ |
46 |
|
$ |
38 |
|
$ |
46 |
|
|
|
(1) |
Losses and gains due to curtailment and settlement benefits relate to repositioning and divestiture actions. |
The estimated net actuarial loss and prior service (benefit) cost that will be amortized from Accumulated other comprehensive income (loss) into net expense in 2018 are approximately $241 million and $(2) million, respectively, for defined benefit pension plans.
For postretirement plans, the estimated 2018 net actuarial loss and prior service (benefit) cost amortizations are approximately $28 million and $(9) million, respectively.
Contributions
The Company’s funding practice for U.S. and non-U.S. pension and postretirement plans is generally to fund to minimum funding requirements in accordance with applicable local laws and regulations. The Company may increase its contributions above the minimum required contribution, if appropriate. In addition, management has the ability to change its funding practices. For the U.S. pension plans, there were no required minimum cash contributions for 2017 or 2016.
The following table summarizes the actual Company contributions for the years ended December 31, 2017 and 2016, as well as estimated expected Company contributions for 2018. Expected contributions are subject to change, since contribution decisions are affected by various factors, such as market performance, tax considerations and regulatory requirements.
|
|
|
|
|
|
|
|
|
|
|
|
|
|
|
|
|
|
|
|
|
|
|
|
|
|
|
|
|
|
|
|
|
|
|
|
|
|
|
Pension plans(1)
|
Postretirement benefit plans(1)
|
|
U.S. plans(2)
|
Non-U.S. plans |
U.S. plans |
Non-U.S. plans |
In millions of dollars |
2018 |
2017 |
2016 |
2018 |
2017 |
2016 |
2018 |
2017 |
2016 |
2018 |
2017 |
2016 |
Contributions made by the Company |
$ |
— |
|
$ |
50 |
|
$ |
500 |
|
$ |
79 |
|
$ |
90 |
|
$ |
82 |
|
$ |
— |
|
$ |
140 |
|
$ |
— |
|
$ |
4 |
|
$ |
4 |
|
$ |
4 |
|
Benefits paid directly by the Company |
60 |
|
55 |
|
56 |
|
49 |
|
45 |
|
44 |
|
6 |
|
36 |
|
6 |
|
6 |
|
5 |
|
5 |
|
|
|
(1) |
Amounts reported for 2018 are expected amounts. |
|
|
(2) |
The U.S. pension plans include benefits paid directly by the Company for the nonqualified pension plans. |
Funded Status and Accumulated Other Comprehensive Income
The following tables summarize the funded status and amounts recognized in the Consolidated Balance Sheet for the Company’s pension and postretirement plans:
|
|
|
|
|
|
|
|
|
|
|
|
|
|
|
|
|
|
|
|
|
|
|
|
|
|
|
Pension plans |
Postretirement benefit plans |
In millions of dollars |
U.S. plans |
Non-U.S. plans |
U.S. plans |
Non-U.S. plans |
|
2017 |
2016 |
2017 |
2016 |
2017 |
2016 |
2017 |
2016 |
Change in projected benefit obligation |
|
|
|
|
|
|
|
|
|
|
|
|
|
|
|
|
Projected benefit obligation at beginning of year |
$ |
14,000 |
|
$ |
13,943 |
|
$ |
6,522 |
|
$ |
6,534 |
|
$ |
686 |
|
$ |
817 |
|
$ |
1,141 |
|
$ |
1,291 |
|
Benefits earned during the year |
3 |
|
4 |
|
153 |
|
154 |
|
— |
|
— |
|
9 |
|
10 |
|
Interest cost on benefit obligation |
533 |
|
548 |
|
295 |
|
282 |
|
26 |
|
25 |
|
101 |
|
94 |
|
Plan amendments |
— |
|
— |
|
4 |
|
(28 |
) |
— |
|
— |
|
— |
|
— |
|
Actuarial loss (gain) |
536 |
|
367 |
|
127 |
|
589 |
|
43 |
|
(105 |
) |
19 |
|
3 |
|
Benefits paid, net of participants’ contributions and government subsidy |
(769 |
) |
(780 |
) |
(278 |
) |
(324 |
) |
(56 |
) |
(51 |
) |
(64 |
) |
(59 |
) |
Divestitures |
— |
|
— |
|
(29 |
) |
(22 |
) |
— |
|
— |
|
(4 |
) |
— |
|
Settlement gain(1)
|
— |
|
— |
|
(192 |
) |
(38 |
) |
— |
|
— |
|
— |
|
— |
|
Curtailment (gain) loss(1)
|
6 |
|
13 |
|
(3 |
) |
(15 |
) |
— |
|
— |
|
— |
|
(4 |
) |
Foreign exchange impact and other(2)
|
(269 |
) |
(95 |
) |
834 |
|
(610 |
) |
— |
|
— |
|
59 |
|
(194 |
) |
Projected benefit obligation at year end |
$ |
14,040 |
|
$ |
14,000 |
|
$ |
7,433 |
|
$ |
6,522 |
|
$ |
699 |
|
$ |
686 |
|
$ |
1,261 |
|
$ |
1,141 |
|
|
|
(1) |
Curtailment and settlement (gains) losses relate to repositioning and divestiture activities. |
|
|
(2) |
With respect to the U.S. Plan, de-risking activities during 2017 resulted in a reduction to plan obligations and assets. |
|
|
|
|
|
|
|
|
|
|
|
|
|
|
|
|
|
|
|
|
|
|
|
|
|
|
|
Pension plans |
Postretirement benefit plans |
|
U.S. plans |
Non-U.S. plans |
U.S. plans |
Non-U.S. plans |
In millions of dollars |
2017 |
2016 |
2017 |
2016 |
2017 |
2016 |
2017 |
2016 |
Change in plan assets |
|
|
|
|
|
|
|
|
|
|
|
|
|
|
|
|
Plan assets at fair value at beginning of year |
$ |
12,363 |
|
$ |
12,137 |
|
$ |
6,149 |
|
$ |
6,104 |
|
$ |
129 |
|
$ |
166 |
|
$ |
1,015 |
|
$ |
1,133 |
|
Actual return on plan assets |
1,295 |
|
572 |
|
462 |
|
967 |
|
13 |
|
8 |
|
113 |
|
122 |
|
Company contributions |
105 |
|
556 |
|
135 |
|
126 |
|
176 |
|
6 |
|
9 |
|
9 |
|
Divestitures |
— |
|
— |
|
(31 |
) |
(5 |
) |
— |
|
— |
|
— |
|
— |
|
Settlements |
— |
|
— |
|
(192 |
) |
(38 |
) |
— |
|
— |
|
— |
|
— |
|
Benefits paid, net of participants’ contributions and government subsidy |
(769 |
) |
(779 |
) |
(278 |
) |
(324 |
) |
(56 |
) |
(51 |
) |
(64 |
) |
(59 |
) |
Foreign exchange impact and other(1)
|
(269 |
) |
(123 |
) |
883 |
|
(681 |
) |
— |
|
— |
|
46 |
|
(190 |
) |
Plan assets at fair value at year end |
$ |
12,725 |
|
$ |
12,363 |
|
$ |
7,128 |
|
$ |
6,149 |
|
$ |
262 |
|
$ |
129 |
|
$ |
1,119 |
|
$ |
1,015 |
|
|
|
|
|
|
|
|
|
|
Funded status of the plans |
|
|
|
|
|
|
|
|
Qualified plans(2)
|
$ |
(565 |
) |
$ |
(908 |
) |
$ |
(305 |
) |
$ |
(373 |
) |
$ |
(437 |
) |
$ |
(557 |
) |
$ |
(142 |
) |
$ |
(126 |
) |
Nonqualified plans(3)
|
(750 |
) |
(729 |
) |
— |
|
— |
|
— |
|
— |
|
— |
|
— |
|
Funded status of the plans at year end |
$ |
(1,315 |
) |
$ |
(1,637 |
) |
$ |
(305 |
) |
$ |
(373 |
) |
$ |
(437 |
) |
$ |
(557 |
) |
$ |
(142 |
) |
$ |
(126 |
) |
|
|
|
|
|
|
|
|
|
Net amount recognized |
|
|
|
|
|
|
|
|
|
|
|
|
|
|
|
|
Qualified plans |
|
|
|
|
|
|
|
|
Benefit asset |
$ |
— |
|
$ |
— |
|
$ |
900 |
|
$ |
711 |
|
$ |
— |
|
$ |
— |
|
$ |
181 |
|
$ |
166 |
|
Benefit liability |
(565 |
) |
(908 |
) |
(1,205 |
) |
(1,084 |
) |
(437 |
) |
(557 |
) |
(323 |
) |
(292 |
) |
Qualified plans |
$ |
(565 |
) |
$ |
(908 |
) |
$ |
(305 |
) |
$ |
(373 |
) |
$ |
(437 |
) |
$ |
(557 |
) |
$ |
(142 |
) |
$ |
(126 |
) |
Nonqualified plans |
(750 |
) |
(729 |
) |
— |
|
— |
|
— |
|
— |
|
— |
|
— |
|
Net amount recognized on the balance sheet |
$ |
(1,315 |
) |
$ |
(1,637 |
) |
$ |
(305 |
) |
$ |
(373 |
) |
$ |
(437 |
) |
$ |
(557 |
) |
$ |
(142 |
) |
$ |
(126 |
) |
|
|
|
|
|
|
|
|
|
Amounts recognized in Accumulated other comprehensive income (loss)
|
|
|
|
|
|
|
|
|
|
|
|
|
|
|
|
Net transition obligation |
$ |
— |
|
$ |
— |
|
$ |
(1 |
) |
$ |
(1 |
) |
$ |
— |
|
$ |
— |
|
$ |
— |
|
$ |
— |
|
Prior service benefit |
(15 |
) |
(17 |
) |
22 |
|
29 |
|
— |
|
— |
|
92 |
|
98 |
|
Net actuarial gain (loss) |
(6,823 |
) |
(6,891 |
) |
(1,318 |
) |
(1,302 |
) |
72 |
|
106 |
|
(382 |
) |
(399 |
) |
Net amount recognized in equity (pretax) |
$ |
(6,838 |
) |
$ |
(6,908 |
) |
$ |
(1,297 |
) |
$ |
(1,274 |
) |
$ |
72 |
|
$ |
106 |
|
$ |
(290 |
) |
$ |
(301 |
) |
|
|
|
|
|
|
|
|
|
|
Accumulated benefit obligation at year end
|
$ |
14,034 |
|
$ |
13,994 |
|
$ |
7,038 |
|
$ |
6,090 |
|
$ |
699 |
|
$ |
686 |
|
$ |
1,261 |
|
$ |
1,141 |
|
|
|
(1) |
With respect to the U.S. Plan, de-risking activities during 2017 resulted in a reduction to plan obligations and assets. |
|
|
(2) |
The U.S. qualified pension plan is fully funded under specified Employee Retirement Income Security Act (ERISA) funding rules as of January 1, 2018 and no minimum required funding is expected for 2018. |
|
|
(3) |
The nonqualified plans of the Company are unfunded. |
The following table shows the change in Accumulated other comprehensive income (loss) related to the Company’s pension, postretirement and post employment plans:
|
|
|
|
|
|
|
|
|
|
|
In millions of dollars |
2017 |
2016 |
2015 |
Beginning of year balance, net of tax(1)(2)
|
$ |
(5,164 |
) |
$ |
(5,116 |
) |
$ |
(5,159 |
) |
Actuarial assumptions changes and plan experience |
(760 |
) |
(854 |
) |
898 |
|
Net asset gain (loss) due to difference between actual and expected returns |
625 |
|
400 |
|
(1,457 |
) |
Net amortizations |
229 |
|
232 |
|
236 |
|
Prior service (cost) credit |
(4 |
) |
28 |
|
(6 |
) |
Curtailment/settlement gain(3)
|
17 |
|
17 |
|
57 |
|
Foreign exchange impact and other |
(93 |
) |
99 |
|
291 |
|
Impact of Tax Reform(4)
|
(1,020 |
) |
— |
|
— |
|
Change in deferred taxes, net |
(13 |
) |
30 |
|
24 |
|
Change, net of tax |
$ |
(1,019 |
) |
$ |
(48 |
) |
$ |
43 |
|
End of year balance, net of tax(1)(2)
|
$ |
(6,183 |
) |
$ |
(5,164 |
) |
$ |
(5,116 |
) |
|
|
(1) |
See Note 19 to the Consolidated Financial Statements for further discussion of net Accumulated other comprehensive income (loss) balance.
|
|
|
(2) |
Includes net-of-tax amounts for certain profit sharing plans outside the U.S. |
|
|
(3) |
Curtailment and settlement gains broadly relate to repositioning and divestiture activities. |
|
|
(4) |
In the fourth quarter of 2017, Citi adopted ASU 2018-02, which transferred these amounts from AOCI to Retained earnings. See Note 1 to the Consolidated Financial Statements. |
At December 31, 2017 and 2016, the aggregate projected benefit obligation (PBO), the aggregate accumulated benefit obligation (ABO) and the aggregate fair value of plan assets are presented for all defined benefit pension plans with a PBO in excess of plan assets and for all defined benefit pension plans with an ABO in excess of plan assets as follows:
|
|
|
|
|
|
|
|
|
|
|
|
|
|
|
|
|
|
|
|
|
|
|
|
|
|
|
PBO exceeds fair value of plan assets |
ABO exceeds fair value of plan assets |
|
U.S. plans(1)
|
Non-U.S. plans |
U.S. plans(1)
|
Non-U.S. plans |
In millions of dollars |
2017 |
2016 |
2017 |
2016 |
2017 |
2016 |
2017 |
2016 |
Projected benefit obligation |
$ |
14,040 |
|
$ |
14,000 |
|
$ |
2,721 |
|
$ |
2,484 |
|
$ |
14,040 |
|
$ |
14,000 |
|
$ |
2,596 |
|
$ |
2,282 |
|
Accumulated benefit obligation |
14,034 |
|
13,994 |
|
2,381 |
|
2,168 |
|
14,034 |
|
13,994 |
|
2,296 |
|
2,012 |
|
Fair value of plan assets |
12,725 |
|
12,363 |
|
1,516 |
|
1,399 |
|
12,725 |
|
12,363 |
|
1,407 |
|
1,224 |
|
|
|
(1) |
At December 31, 2017 and 2016, for both the U.S. qualified plan and nonqualified plans, the aggregate PBO and the aggregate ABO exceeded plan assets. |
Plan Assumptions
The Company utilizes a number of assumptions to determine plan obligations and expenses. Changes in one or a combination of these assumptions will have an impact on the Company’s pension and postretirement PBO, funded status and (benefit) expense. Changes in the plans’ funded status resulting from changes in the PBO and fair value of plan assets will have a corresponding impact on Accumulated other comprehensive income (loss).
The actuarial assumptions at the respective years ended December 31 in the table below are used to measure the year-end PBO and the net periodic (benefit) expense for the subsequent year (period). Since Citi’s Significant Plans are measured on a quarterly basis, the year-end rates for those plans are used to calculate the net periodic (benefit) expense for the subsequent year’s first quarter. As a result of the quarterly measurement process, the net periodic (benefit) expense for the Significant Plans is calculated at each respective quarter end based on the preceding quarter-end rates (as shown below for the U.S. and non-U.S. pension and postretirement plans). The actuarial assumptions for All Other Plans are measured annually.
Certain assumptions used in determining pension and postretirement benefit obligations and net benefit expense for the Company’s plans are shown in the following table:
|
|
|
|
At year end |
2017 |
2016 |
Discount rate |
|
|
U.S. plans |
|
|
Qualified pension |
3.60% |
4.10% |
Nonqualified pension |
3.60 |
4.00 |
Postretirement |
3.50 |
3.90 |
Non-U.S. pension plans |
|
|
Range |
0.00 to 10.20 |
0.25 to 72.50 |
Weighted average |
4.17 |
4.40 |
|
Non-U.S. postretirement plans
|
|
|
Range |
1.75 to 10.10 |
1.75 to 11.05 |
Weighted average |
8.10 |
8.27 |
Future compensation increase rate(1)
|
|
Non-U.S. pension plans |
|
|
Range |
1.17 to 13.67 |
1.25 to 70.00 |
Weighted average |
3.08 |
3.21 |
Expected return on assets |
|
|
U.S. plans |
|
|
Qualified pension |
6.80 |
6.80 |
Postretirement(2)
|
6.80/3.00 |
6.80 |
Non-U.S. pension plans |
|
|
Range |
0.00 to 11.50 |
1.00 to 11.50 |
Weighted average |
4.52 |
4.55 |
Non-U.S. postretirement plans |
|
|
Range |
8.00 to 9.80 |
8.00 to 10.30 |
Weighted average |
8.01 |
8.02 |
|
|
(1) |
Not material for U.S. plans. |
|
|
(2) |
In 2017, the VEBA Trust was funded with an expected rate of return of assets of 3.00%.
|
|
|
|
|
|
During the year |
2017 |
2016 |
2015 |
Discount rate |
|
|
|
U.S. plans |
|
|
|
Qualified pension |
4.10%/4.05%/ 3.80%/3.75% |
4.40%/3.95%/ 3.65%/3.55% |
4.00%/3.85%/ 4.45%/4.35% |
Nonqualified pension |
4.00/3.95/ 3.75/3.65 |
4.35/3.90/ 3.55/3.45 |
3.90/3.70/ 4.30/4.25 |
Postretirement |
3.90/3.85/ 3.60/3.55 |
4.20/3.75/ 3.40/3.30 |
3.80/3.65/ 4.20/4.10 |
Non-U.S. pension plans(1)
|
|
|
Range |
0.25 to 72.50 |
0.25 to 42.00 |
1.00 to 32.50 |
Weighted average |
4.40 |
4.76 |
4.74 |
Non-U.S. postretirement plans(1)
|
|
|
Range |
1.75 to 11.05 |
2.00 to 13.20 |
2.25 to 12.00 |
Weighted average |
8.27 |
7.90 |
7.50 |
Future compensation increase rate (2)
|
|
Non-U.S. pension plans(1)
|
|
|
Range |
1.25 to 70.00 |
1.00 to 40.00 |
0.75 to 30.00 |
Weighted average |
3.21 |
3.24 |
3.27 |
Expected return on assets |
|
|
U.S. plans |
|
|
|
Qualified pension |
6.80 |
7.00 |
7.00 |
Postretirement |
6.80 |
7.00 |
7.00 |
Non-U.S. pension plans(1)
|
|
|
Range |
1.00 to 11.50 |
1.60 to 11.50 |
1.30 to 11.50 |
Weighted average |
4.55 |
4.95 |
5.08 |
Non-U.S. postretirement plans(1)
|
|
|
Range |
8.00 to 10.30 |
8.00 to 10.70 |
8.50 to 10.40 |
Weighted average |
8.02 |
8.01 |
8.51 |
(1) Reflects rates utilized to determine the first quarter expense for Significant non-U.S. pension and postretirement plans.
|
|
(2) |
Not material for U.S. plans. |
Discount Rate
The discount rates for the U.S. pension and postretirement plans were selected by reference to a Citigroup-specific analysis using each plan’s specific cash flows and compared with high-quality corporate bond indices for reasonableness. The discount rates for the non-U.S. pension and postretirement plans are selected by reference to high-quality corporate bond rates in countries that have developed corporate bond markets. However, where developed corporate bond markets do not exist, the discount rates are selected by reference to local government bond rates with a premium added to reflect the additional risk for corporate bonds in certain countries.
Effective December 31, 2017, the established rounding convention was to the nearest 5 bps for the top five non-U.S. countries, and 25 bps for all other countries.
Expected Rate of Return
The Company determines its assumptions for the expected rate of return on plan assets for its U.S. pension and postretirement plans using a “building block” approach, which focuses on ranges of anticipated rates of return for each asset class. A weighted average range of nominal rates is then determined based on target allocations to each asset class. Market performance over a number of earlier years is evaluated covering a wide range of economic conditions to determine whether there are sound reasons for projecting any past trends.
The Company considers the expected rate of return to be a long-term assessment of return expectations and does not anticipate changing this assumption unless there are significant changes in investment strategy or economic conditions. This contrasts with the selection of the discount rate and certain other assumptions, which are reconsidered annually (or quarterly for the Significant Plans) in accordance with GAAP.
The expected rate of return for the U.S. pension and postretirement plans was 6.80% at December 31, 2017 and 2016 and 7.00% at December 31, 2015. The expected return on assets reflects the expected annual appreciation of the plan assets and reduces the Company’s annual pension expense. The expected return on assets is deducted from the sum of service cost, interest cost and other components of pension expense to arrive at the net pension (benefit) expense. Net pension (benefit) expense for the U.S. pension plans for 2017, 2016 and 2015 reflects deductions of $865 million, $886 million and $893 million of expected returns, respectively.
The following table shows the expected rates of return used in determining the Company’s pension expense compared to the actual rate of return on plan assets during 2017, 2016 and 2015 for the U.S. pension and postretirement plans:
|
|
|
|
|
|
2017 |
2016 |
2015 |
Expected rate of return(1)
|
6.80%/3.00% |
7.00% |
7.00% |
Actual rate of return(2)
|
10.90 |
4.90 |
(1.70) |
|
|
(1) |
In 2017, the VEBA Trust was funded for postretirement benefits with an expected rate of return of assets of 3.00%.
|
|
|
(2) |
Actual rates of return are presented net of fees. |
For the non-U.S. pension plans, pension expense for 2017 was reduced by the expected return of $299 million, compared with the actual return of $462 million. Pension expense for 2016 and 2015 was reduced by expected returns of $287 million and $323 million, respectively.
Mortality Tables
At December 31, 2017, the Company maintained the Retirement Plan 2014 (RP-2014) mortality table and adopted the Mortality Projection 2017 (MP-2017) projection table for the U.S. plans.
|
|
|
|
U.S. plans |
2017(1)
|
2016(2)
|
Mortality |
|
|
Pension |
RP-2014/MP-2017 |
RP-2014/MP-2016 |
Postretirement |
RP-2014/MP-2017 |
RP-2014/MP-2016 |
|
|
(1) |
The RP-2014 table is the white-collar RP-2014 table. The MP-2017 projection scale is projected from 2006, with convergence to .75% ultimate rate of annual improvement by 2033.
|
|
|
(2) |
The RP-2014 table is the white-collar RP-2014 table, with a 4% increase in rates to reflect the lower life expectancy of Citi plan participants. The MP-2016 projection scale is projected from 2011, with convergence to 0.75% ultimate rate of annual improvement by 2032.
|
Sensitivities of Certain Key Assumptions
The following tables summarize the effect on pension expense of a one-percentage-point change in the discount rate:
|
|
|
|
|
|
|
|
|
|
|
|
One-percentage-point increase |
In millions of dollars |
2017 |
2016 |
2015 |
U.S. plans |
$ |
29 |
|
$ |
31 |
|
$ |
26 |
|
Non-U.S. plans |
(27 |
) |
(33 |
) |
(32 |
) |
|
|
|
|
|
One-percentage-point decrease |
In millions of dollars |
2017 |
2016 |
2015 |
U.S. plans |
$ |
(44 |
) |
$ |
(47 |
) |
$ |
(44 |
) |
Non-U.S. plans |
41 |
|
37 |
|
44 |
|
Since the U.S. qualified pension plan was frozen, most of the prospective service cost has been eliminated and the gain/loss amortization period was changed to the life expectancy for inactive participants. As a result, pension expense for the U.S. qualified pension plan is driven more by interest costs than service costs, and an increase in the discount rate would increase pension expense, while a decrease in the discount rate would decrease pension expense.
The following tables summarize the effect on pension expense of a one-percentage-point change in the expected rates of return:
|
|
|
|
|
|
|
|
|
|
|
|
One-percentage-point increase |
In millions of dollars |
2017 |
2016 |
2015 |
U.S. plans |
$ |
(127 |
) |
$ |
(127 |
) |
$ |
(128 |
) |
Non-U.S. plans |
(64 |
) |
(61 |
) |
(63 |
) |
|
|
|
|
|
|
|
|
|
|
|
|
One-percentage-point decrease |
In millions of dollars |
2017 |
2016 |
2015 |
U.S. plans |
$ |
127 |
|
$ |
127 |
|
$ |
128 |
|
Non-U.S. plans |
64 |
|
61 |
|
63 |
|
Health Care Cost Trend Rate
Assumed health care cost trend rates were as follows:
|
|
|
|
|
2017 |
2016 |
|
Health care cost increase rate for
U.S. plans
|
|
|
Following year |
6.50% |
6.50% |
Ultimate rate to which cost increase is assumed to decline |
5.00 |
5.00 |
Year in which the ultimate rate is reached(1)
|
2023 |
2023 |
|
|
(1) |
Weighted average for plans with different following year and ultimate rates. |
|
|
|
|
|
2017 |
2016 |
|
Health care cost increase rate for
Non-U.S. plans (weighted average)
|
|
|
Following year |
6.87% |
6.86% |
Ultimate rate to which cost increase is assumed to decline |
6.87 |
6.85 |
Range of years in which the ultimate rate is reached |
2018–2019 |
2017–2029 |
A one-percentage-point change in assumed health care cost trend rates would have the following effects:
|
|
|
|
|
|
|
|
|
|
|
|
|
|
|
One-
percentage-
point increase
|
One-
percentage-
point decrease
|
In millions of dollars |
2017 |
2016 |
2017 |
2016 |
U.S. plans |
|
|
|
|
Effect on benefits earned and interest cost for postretirement plans |
$ |
1 |
|
$ |
1 |
|
$ |
(1 |
) |
$ |
(1 |
) |
Effect on accumulated postretirement benefit obligation for postretirement plans |
33 |
|
30 |
|
(29 |
) |
(26 |
) |
|
|
|
|
|
|
One-percentage-
point increase
|
One-
percentage-
point decrease
|
In millions of dollars |
2017 |
2016 |
2017 |
2016 |
|
Non-U.S. plans
|
|
|
|
|
Effect on benefits earned and interest cost for postretirement plans |
$ |
13 |
|
$ |
12 |
|
$ |
(10 |
) |
$ |
(10 |
) |
Effect on accumulated postretirement benefit obligation for postretirement plans |
150 |
|
144 |
|
(125 |
) |
(118 |
) |
Plan Assets
Citigroup’s pension and postretirement plans’ asset allocations for the U.S. plans and the target allocations by asset category based on asset fair values, are as follows:
|
|
|
|
|
|
|
|
|
|
|
|
Target asset
allocation
|
U.S. pension assets
at December 31,
|
U.S. postretirement assets
at December 31,
|
Asset category(1)
|
2018 |
2017 |
2016 |
2017 |
2016 |
Equity securities(2)
|
0-30% |
20 |
% |
18 |
% |
20 |
% |
18 |
% |
Debt securities(3)
|
25-72 |
48 |
|
47 |
|
48 |
|
47 |
|
Real estate |
0-10 |
5 |
|
5 |
|
5 |
|
5 |
|
Private equity |
0-12 |
3 |
|
4 |
|
3 |
|
4 |
|
Other investments |
0-37 |
24 |
|
26 |
|
24 |
|
26 |
|
Total |
|
100 |
% |
100 |
% |
100 |
% |
100 |
% |
|
|
(1) |
Asset allocations for the U.S. plans are set by investment strategy, not by investment product. For example, private equities with an underlying investment in real estate are classified in the real estate asset category, not private equity. |
|
|
(2) |
Equity securities in the U.S. pension and postretirement plans do not include any Citigroup common stock at the end of 2017 and 2016. |
|
|
(3) |
In December 2017, Citi contributed $140 million to the VEBA Trust for postretirement benefits, which amount was invested solely in debt securities which are not reflected in the table above.
|
Third-party investment managers and advisers provide their services to Citigroup’s U.S. pension and postretirement plans. Assets are rebalanced as the Company’s Pension Plan Investment Committee deems appropriate. Citigroup’s investment strategy, with respect to its assets, is to maintain a globally diversified investment portfolio across several asset classes that, when combined with Citigroup’s contributions to
the plans, will maintain the plans’ ability to meet all required benefit obligations.
Citigroup’s pension and postretirement plans’ weighted-average asset allocations for the non-U.S. plans and the actual ranges, and the weighted-average target allocations by asset category based on asset fair values, are as follows:
|
|
|
|
|
|
|
|
|
|
Non-U.S. pension plans |
|
Target asset
allocation
|
Actual range
at December 31,
|
Weighted-average
at December 31,
|
Asset category(1)
|
2018 |
2017 |
2016 |
2017 |
2016 |
Equity securities |
0-63% |
0-67% |
0–69% |
15 |
% |
14 |
% |
Debt securities |
0-100 |
0-99 |
0–100 |
79 |
|
79 |
|
Real estate |
0-18 |
0-18 |
0–18 |
1 |
|
1 |
|
Other investments |
0-100 |
0-100 |
0–100 |
5 |
|
6 |
|
Total |
|
|
|
100 |
% |
100 |
% |
|
|
(1) |
Similar to the U.S. plans, asset allocations for certain non-U.S. plans are set by investment strategy, not by investment product. |
|
|
|
|
|
|
|
|
|
|
Non-U.S. postretirement plans |
|
Target asset
allocation
|
Actual range
at December 31,
|
Weighted-average
at December 31,
|
Asset category(1)
|
2018 |
2017 |
2016 |
2017 |
2016 |
Equity securities |
0-37% |
0-38% |
0–38% |
38 |
% |
38 |
% |
Debt securities |
58-100 |
58-100 |
57–100 |
58 |
|
58 |
|
Other investments |
0-5 |
0-4 |
0–4 |
4 |
|
4 |
|
Total |
|
|
|
100 |
% |
100 |
% |
|
|
(1) |
Similar to the U.S. plans, asset allocations for certain non-U.S. plans are set by investment strategy, not by investment product. |
Fair Value Disclosure
For information on fair value measurements, including descriptions of Levels 1, 2 and 3 of the fair value hierarchy and the valuation methodology utilized by the Company, see Notes 1 and 24 to the Consolidated Financial Statements. ASU 2015-07 removed the requirement to categorize within the fair value hierarchy investments for which fair value is measured using the NAV per share practical expedient.
Certain investments may transfer between the fair value hierarchy classifications during the year due to changes in valuation methodology and pricing sources.
Plan assets by detailed asset categories and the fair value hierarchy are as follows:
|
|
|
|
|
|
|
|
|
|
|
|
|
|
|
U.S. pension and postretirement benefit plans(1)
|
In millions of dollars |
Fair value measurement at December 31, 2017 |
Asset categories |
Level 1 |
Level 2 |
Level 3 |
Total |
|
U.S. equities
|
$ |
726 |
|
$ |
— |
|
$ |
— |
|
$ |
726 |
|
|
Non-U.S. equities
|
926 |
|
— |
|
— |
|
926 |
|
|
Mutual funds
|
271 |
|
— |
|
— |
|
271 |
|
|
Commingled funds
|
— |
|
1,184 |
|
— |
|
1,184 |
|
|
Debt securities
|
1,381 |
|
3,080 |
|
— |
|
4,461 |
|
Annuity contracts |
— |
|
— |
|
1 |
|
1 |
|
Derivatives |
11 |
|
323 |
|
— |
|
334 |
|
Other investments |
— |
|
— |
|
22 |
|
22 |
|
Total investments |
$ |
3,315 |
|
$ |
4,587 |
|
$ |
23 |
|
$ |
7,925 |
|
Cash and short-term investments |
$ |
257 |
|
$ |
1,004 |
|
$ |
— |
|
$ |
1,261 |
|
Other investment liabilities |
(60 |
) |
(343 |
) |
— |
|
(403 |
) |
Net investments at fair value |
$ |
3,512 |
|
$ |
5,248 |
|
$ |
23 |
|
$ |
8,783 |
|
Other investment receivables redeemed at NAV |
|
|
|
$ |
16 |
|
Securities valued at NAV |
|
|
|
4,189 |
|
Total net assets |
|
|
|
$ |
12,988 |
|
|
|
(1) |
The investments of the U.S. pension and postretirement plans are commingled in one trust. At December 31, 2017, the allocable interests of the U.S. pension and postretirement plans were 99.0% and 1.0%, respectively. In 2017, the VEBA Trust was funded for postretirement benefits.
|
|
|
|
|
|
|
|
|
|
|
|
|
|
|
|
U.S. pension and postretirement benefit plans(1)
|
In millions of dollars |
Fair value measurement at December 31, 2016 |
Asset categories |
Level 1 |
Level 2 |
Level 3 |
Total |
|
U.S. equities
|
$ |
639 |
|
$ |
— |
|
$ |
— |
|
$ |
639 |
|
|
Non-U.S. equities
|
773 |
|
— |
|
— |
|
773 |
|
|
Mutual funds
|
216 |
|
— |
|
— |
|
216 |
|
Commingled funds |
— |
|
866 |
|
— |
|
866 |
|
Debt securities |
1,297 |
|
2,845 |
|
— |
|
4,142 |
|
Annuity contracts |
— |
|
— |
|
1 |
|
1 |
|
Derivatives |
8 |
|
543 |
|
— |
|
551 |
|
Other investments |
— |
|
— |
|
4 |
|
4 |
|
Total investments |
$ |
2,933 |
|
$ |
4,254 |
|
$ |
5 |
|
$ |
7,192 |
|
Cash and short-term investments |
$ |
116 |
|
$ |
1,239 |
|
$ |
— |
|
$ |
1,355 |
|
Other investment liabilities |
(106 |
) |
(553 |
) |
— |
|
(659 |
) |
Net investments at fair value |
$ |
2,943 |
|
$ |
4,940 |
|
$ |
5 |
|
$ |
7,888 |
|
Other investment receivables redeemed at NAV |
|
|
|
$ |
100 |
|
Securities valued at NAV |
|
|
|
4,504 |
|
Total net assets |
|
|
|
$ |
12,492 |
|
|
|
(1) |
The investments of the U.S. pension and postretirement plans are commingled in one trust. At December 31, 2016, the allocable interests of the U.S. pension and postretirement plans were 99.0% and 1.0%, respectively.
|
|
|
|
|
|
|
|
|
|
|
|
|
|
|
|
Non-U.S. pension and postretirement benefit plans |
In millions of dollars |
Fair value measurement at December 31, 2017 |
Asset categories |
Level 1 |
Level 2 |
Level 3 |
Total |
U.S. equities |
$ |
4 |
|
$ |
12 |
|
$ |
— |
|
$ |
16 |
|
Non-U.S. equities |
103 |
|
122 |
|
1 |
|
226 |
|
Mutual funds |
3,098 |
|
74 |
|
— |
|
3,172 |
|
Commingled funds |
24 |
|
— |
|
— |
|
24 |
|
Debt securities |
3,999 |
|
1,555 |
|
7 |
|
5,561 |
|
Real estate |
— |
|
3 |
|
1 |
|
4 |
|
Annuity contracts |
— |
|
1 |
|
9 |
|
10 |
|
Derivatives |
1 |
|
3,102 |
|
— |
|
3,103 |
|
Other investments |
1 |
|
— |
|
214 |
|
215 |
|
Total investments |
$ |
7,230 |
|
$ |
4,869 |
|
$ |
232 |
|
$ |
12,331 |
|
Cash and short-term investments |
$ |
119 |
|
$ |
3 |
|
$ |
— |
|
$ |
122 |
|
Other investment liabilities |
(2 |
) |
(4,220 |
) |
— |
|
(4,222 |
) |
Net investments at fair value |
$ |
7,347 |
|
$ |
652 |
|
$ |
232 |
|
$ |
8,231 |
|
Securities valued at NAV |
|
|
|
$ |
16 |
|
Total net assets |
|
|
|
$ |
8,247 |
|
|
|
|
|
|
|
|
|
|
|
|
|
|
|
|
Non-U.S. pension and postretirement benefit plans |
In millions of dollars |
Fair value measurement at December 31, 2016 |
Asset categories |
Level 1 |
Level 2 |
Level 3 |
Total |
U.S. equities |
$ |
4 |
|
$ |
11 |
|
$ |
— |
|
$ |
15 |
|
Non-U.S. equities |
87 |
|
174 |
|
1 |
|
262 |
|
Mutual funds |
2,345 |
|
406 |
|
— |
|
2,751 |
|
Commingled funds |
22 |
|
— |
|
— |
|
22 |
|
Debt securities |
3,406 |
|
1,206 |
|
7 |
|
4,619 |
|
Real estate |
— |
|
3 |
|
1 |
|
4 |
|
Annuity contracts |
— |
|
1 |
|
8 |
|
9 |
|
Derivatives |
— |
|
43 |
|
— |
|
43 |
|
Other investments |
1 |
|
— |
|
187 |
|
188 |
|
Total investments |
$ |
5,865 |
|
$ |
1,844 |
|
$ |
204 |
|
$ |
7,913 |
|
Cash and short-term investments |
$ |
116 |
|
$ |
2 |
|
$ |
— |
|
$ |
118 |
|
Other investment liabilities |
(1 |
) |
(960 |
) |
— |
|
(961 |
) |
Net investments at fair value |
$ |
5,980 |
|
$ |
886 |
|
$ |
204 |
|
$ |
7,070 |
|
Securities valued at NAV |
|
|
|
$ |
92 |
|
Total net assets |
|
|
|
$ |
7,162 |
|
Level 3 Rollforward
The reconciliations of the beginning and ending balances during the year for Level 3 assets are as follows:
|
|
|
|
|
|
|
|
|
|
|
|
|
|
|
|
|
|
|
|
In millions of dollars |
U.S. pension and postretirement benefit plans |
Asset categories |
Beginning Level 3 fair value at
Dec. 31, 2016
|
Realized gains (losses) |
Unrealized gains (losses) |
Purchases, sales and issuances |
Transfers in and/or out of Level 3 |
Ending Level 3 fair value at Dec. 31, 2017 |
Annuity contracts |
$ |
1 |
|
$ |
— |
|
$ |
— |
|
$ |
— |
|
$ |
— |
|
$ |
1 |
|
Other investments |
4 |
|
|
|
|
|
18 |
|
— |
|
22 |
|
Total investments |
$ |
5 |
|
$ |
— |
|
$ |
— |
|
$ |
18 |
|
$ |
— |
|
$ |
23 |
|
|
|
|
|
|
|
|
|
|
|
|
|
|
|
|
|
|
|
|
|
In millions of dollars |
U.S. pension and postretirement benefit plans |
Asset categories |
Beginning Level 3 fair value at
Dec. 31, 2015
|
Realized gains (losses) |
Unrealized gains (losses) |
Purchases, sales and issuances |
Transfers in and/or out of Level 3 |
Ending Level 3 fair value at Dec. 31, 2016 |
Annuity contracts |
$ |
25 |
|
$ |
— |
|
$ |
(3 |
) |
$ |
(21 |
) |
$ |
— |
|
$ |
1 |
|
Other investments |
149 |
|
8 |
|
(10 |
) |
(143 |
) |
— |
|
4 |
|
U.S. equities |
— |
|
(2 |
) |
2 |
|
— |
|
— |
|
— |
|
Total investments |
$ |
174 |
|
$ |
6 |
|
$ |
(11 |
) |
$ |
(164 |
) |
$ |
— |
|
$ |
5 |
|
|
|
|
|
|
|
|
|
|
|
|
|
|
|
|
|
|
In millions of dollars |
Non-U.S. pension and postretirement benefit plans |
Asset categories |
Beginning Level 3 fair value at Dec. 31, 2016 |
Unrealized gains (losses) |
Purchases, sales and issuances |
Transfers in and/or out of Level 3 |
Ending Level 3 fair value at Dec. 31, 2017 |
Non-U.S. equities |
$ |
1 |
|
$ |
— |
|
$ |
— |
|
$ |
— |
|
$ |
1 |
|
Debt securities |
7 |
|
— |
|
— |
|
— |
|
7 |
|
Real estate |
1 |
|
— |
|
— |
|
— |
|
1 |
|
Annuity contracts |
8 |
|
1 |
|
— |
|
— |
|
9 |
|
Other investments |
187 |
|
31 |
|
(4 |
) |
— |
|
214 |
|
Total investments |
$ |
204 |
|
$ |
32 |
|
$ |
(4 |
) |
$ |
— |
|
$ |
232 |
|
|
|
|
|
|
|
|
|
|
|
|
|
|
|
|
|
|
In millions of dollars |
Non-U.S. pension and postretirement benefit plans |
Asset categories |
Beginning Level 3 fair value at
Dec. 31, 2015
|
Unrealized gains (losses) |
Purchases, sales and issuances |
Transfers in and/or out of Level 3 |
Ending Level 3 fair value at Dec. 31, 2016 |
Non-U.S. equities |
$ |
47 |
|
$ |
(3 |
) |
$ |
(2 |
) |
$ |
(41 |
) |
$ |
1 |
|
Debt securities |
5 |
|
— |
|
2 |
|
— |
|
7 |
|
Real estate |
1 |
|
— |
|
— |
|
— |
|
1 |
|
Annuity contracts |
8 |
|
— |
|
— |
|
— |
|
8 |
|
Other investments |
196 |
|
— |
|
(9 |
) |
— |
|
187 |
|
Total investments |
$ |
257 |
|
$ |
(3 |
) |
$ |
(9 |
) |
$ |
(41 |
) |
$ |
204 |
|
Investment Strategy
The Company’s global pension and postretirement funds’ investment strategy is to invest in a prudent manner for the exclusive purpose of providing benefits to participants. The investment strategies are targeted to produce a total return that, when combined with the Company’s contributions to the funds, will maintain the funds’ ability to meet all required benefit obligations. Risk is controlled through diversification of asset types and investments in domestic and international equities, fixed income securities and cash and short-term investments. The target asset allocation in most locations outside the U.S. is primarily in equity and debt securities. These allocations may vary by geographic region and country depending on the nature of applicable obligations and various other regional considerations. The wide variation in the actual range of plan asset allocations for the funded non-U.S. plans is a result of differing local statutory requirements and economic conditions. For example, in certain countries local law requires that all pension plan assets must be invested in fixed income investments, government funds or local-country securities.
Significant Concentrations of Risk in Plan Assets
The assets of the Company’s pension plans are diversified to limit the impact of any individual investment. The U.S. qualified pension plan is diversified across multiple asset classes, with publicly traded fixed income, hedge funds, publicly traded equity and private equity representing the most significant asset allocations. Investments in these four asset classes are further diversified across funds, managers, strategies, vintages, sectors and geographies, depending on the specific characteristics of each asset class. The pension assets for the Company’s non-U.S. Significant Plans are primarily invested in publicly traded fixed income and publicly traded equity securities.
Oversight and Risk Management Practices
The framework for the Company’s pension oversight process includes monitoring of retirement plans by plan fiduciaries and/or management at the global, regional or country level, as appropriate. Independent Risk Management contributes to the risk oversight and monitoring for the Company’s U.S. qualified pension plan and non-U.S. Significant Pension Plans. Although the specific components of the oversight process are tailored to the requirements of each region, country and plan, the following elements are common to the Company’s monitoring and risk management process:
|
|
• |
periodic asset/liability management studies and strategic asset allocation reviews; |
|
|
• |
periodic monitoring of funding levels and funding ratios; |
|
|
• |
periodic monitoring of compliance with asset allocation guidelines; |
|
|
• |
periodic monitoring of asset class and/or investment manager performance against benchmarks; and |
|
|
• |
periodic risk capital analysis and stress testing. |
Estimated Future Benefit Payments
The Company expects to pay the following estimated benefit payments in future years:
|
|
|
|
|
|
|
|
|
|
|
|
|
|
|
Pension plans |
Postretirement benefit plans |
In millions of dollars |
U.S. plans |
Non-U.S. plans |
U.S. plans |
Non-U.S. plans |
2018 |
$ |
787 |
|
$ |
432 |
|
$ |
61 |
|
$ |
65 |
|
2019 |
814 |
|
398 |
|
60 |
|
70 |
|
2020 |
846 |
|
425 |
|
59 |
|
75 |
|
2021 |
864 |
|
434 |
|
58 |
|
81 |
|
2022 |
876 |
|
457 |
|
56 |
|
87 |
|
2023–2027 |
4,480 |
|
2,532 |
|
248 |
|
532 |
|
Prescription Drugs
In December 2003, the Medicare Prescription Drug Improvement and Modernization Act of 2003 (Act of 2003) was enacted. The Act of 2003 established a prescription drug benefit under Medicare known as “Medicare Part D,” and a federal subsidy to sponsors of U.S. retiree health care benefit plans that provide a benefit that is at least actuarially equivalent to Medicare Part D. The benefits provided to certain participants are at least actuarially equivalent to Medicare Part D and, accordingly, the Company is entitled to a subsidy.
The subsidy reduced the accumulated postretirement benefit obligation (APBO) by approximately $4 million and $5 million as of December 31, 2017 and 2016, respectively, and the postretirement expense by approximately $0.1 million and $0.2 million for 2017 and 2016, respectively.
Certain provisions of the Patient Protection and Affordable Care Act of 2010 improved the Medicare Part D option known as the Employer Group Waiver Plan (EGWP) with respect to the Medicare Part D subsidy. The EGWP provides prescription
drug benefits that are more cost effective for Medicare-eligible participants and large employers. Effective April 1, 2013, the Company began sponsoring and implementing an EGWP for eligible retirees. The Company subsidy received under the EGWP for 2017 and 2016 was $15.0 million and $12.9 million, respectively.
The other provisions of the Act of 2010 are not expected to have a significant impact on Citigroup’s pension and postretirement plans.
Post Employment Plans
The Company sponsors U.S. post employment plans that provide income continuation and health and welfare benefits to certain eligible U.S. employees on long-term disability.
As of December 31, 2017 and 2016, the plans’ funded status recognized in the Company’s Consolidated Balance Sheet was $(46) million and $(157) million, respectively. The pre-tax amounts recognized in Accumulated other comprehensive income (loss) as of December 31, 2017 and 2016 were $3 million and $34 million, respectively. The improvement in funded status as of December 31, 2017 was primarily due to the Company’s funding of the VEBA Trust during 2017.
The following table summarizes the components of net expense recognized in the Consolidated Statement of Income for the Company’s U.S. post employment plans:
|
|
|
|
|
|
|
|
|
|
|
|
Net expense |
In millions of dollars |
2017 |
2016 |
2015 |
Service related expense |
|
|
|
|
|
|
Interest cost on benefit obligation |
$ |
2 |
|
$ |
3 |
|
$ |
4 |
|
Amortization of unrecognized |
|
|
|
Prior service (benefit) cost |
(31 |
) |
(31 |
) |
(31 |
) |
Net actuarial loss |
2 |
|
5 |
|
12 |
|
Total service related benefit |
$ |
(27 |
) |
$ |
(23 |
) |
$ |
(15 |
) |
Non-service related expense |
$ |
30 |
|
$ |
21 |
|
$ |
3 |
|
Total net expense (benefit) |
$ |
3 |
|
$ |
(2 |
) |
$ |
(12 |
) |
The following table summarizes certain assumptions used in determining the post employment benefit obligations and net benefit expense for the Company’s U.S. post employment plans:
|
|
|
|
|
2017 |
2016 |
Discount rate |
3.20% |
3.40% |
Expected return on assets(1)
|
3.00 |
N/A |
Health care cost increase rate |
|
|
Following year |
6.50 |
6.50 |
Ultimate rate to which cost increase is assumed to decline |
5.00 |
5.00 |
Year in which the ultimate rate is reached |
2023 |
2023 |
|
|
1) |
In 2017, the VEBA Trust was funded with an expected rate of return of assets of 3.00%.
|
N/A Not applicable
Defined Contribution Plans
The Company sponsors defined contribution plans in the U.S. and in certain non-U.S. locations, all of which are administered in accordance with local laws. The most significant defined contribution plan is the Citi Retirement Savings Plan (formerly known as the Citigroup 401(k) Plan) sponsored by the Company in the U.S.
Under the Citi Retirement Savings Plan, eligible U.S. employees received matching contributions of up to 6% of their eligible compensation for 2017 and 2016, subject to statutory limits. Additionally, for eligible employees whose eligible compensation is $100,000 or less, a fixed contribution of up to 2% of eligible compensation is provided. All Company contributions are invested according to participants’ individual elections. The following table summarizes the Company contributions for the defined contribution plans:
|
|
|
|
|
|
|
|
|
|
|
|
U.S. plans |
In millions of dollars |
2017 |
2016 |
2015 |
Company contributions |
$ |
383 |
|
$ |
371 |
|
$ |
380 |
|
|
|
|
|
|
Non-U.S. plans |
In millions of dollars |
2017 |
2016 |
2015 |
Company contributions |
$ |
270 |
|
$ |
268 |
|
$ |
282 |
|
9. INCOME TAXES
Details of the Company’s income tax provision are presented below:
Income Tax Provision
|
|
|
|
|
|
|
|
|
|
|
In millions of dollars |
2017 |
2016 |
2015 |
Current |
|
|
|
|
|
|
Federal |
$ |
332 |
|
$ |
1,016 |
|
$ |
861 |
|
Non-U.S. |
3,910 |
|
3,585 |
|
3,397 |
|
State |
269 |
|
384 |
|
388 |
|
Total current income taxes |
$ |
4,511 |
|
$ |
4,985 |
|
$ |
4,646 |
|
Deferred |
|
|
|
|
|
|
Federal |
$ |
24,902 |
|
$ |
1,280 |
|
$ |
3,019 |
|
Non-U.S. |
(377 |
) |
53 |
|
(4 |
) |
State |
352 |
|
126 |
|
(221 |
) |
Total deferred income taxes |
$ |
24,877 |
|
$ |
1,459 |
|
$ |
2,794 |
|
Provision for income tax on continuing operations before non-controlling interests(1)
|
$ |
29,388 |
|
$ |
6,444 |
|
$ |
7,440 |
|
Provision (benefit) for income taxes on discontinued operations |
7 |
|
(22 |
) |
(29 |
) |
Income tax expense (benefit) reported in stockholders’ equity related to: |
|
|
|
|
|
|
FX translation |
188 |
|
(402 |
) |
(906 |
) |
Investment securities |
(149 |
) |
59 |
|
(498 |
) |
Employee stock plans |
(4 |
) |
13 |
|
(35 |
) |
Cash flow hedges |
(12 |
) |
27 |
|
176 |
|
Benefit plans |
13 |
|
(30 |
) |
(24 |
) |
FVO DVA |
(250 |
) |
(201 |
) |
— |
|
Retained earnings(2)
|
(295 |
) |
— |
|
— |
|
Income taxes before non-controlling interests |
$ |
28,886 |
|
$ |
5,888 |
|
$ |
6,124 |
|
|
|
(1) |
Includes the effect of securities transactions and other-than-temporary-impairment losses resulting in a provision (benefit) of $272 million and $(22) million in 2017, $332 million and $(217) million in 2016 and $239 million and $(93) million in 2015, respectively.
|
|
|
(2) |
Reflects the tax effect of the accounting change for ASU 2017-08, “Premium Amortization on Purchased Callable Debt Securities”. See Note 1 to the Consolidated Financial Statements.
|
Tax Rate
The reconciliation of the federal statutory income tax rate to the Company’s effective income tax rate applicable to income from continuing operations (before non-controlling interests and the cumulative effect of accounting changes) for each of the periods indicated is as follows:
|
|
|
|
|
|
|
|
|
2017 |
2016 |
2015 |
Federal statutory rate |
35.0 |
% |
35.0 |
% |
35.0 |
% |
State income taxes, net of federal benefit |
1.1 |
|
1.8 |
|
1.7 |
|
Non-U.S. income tax rate differential |
(1.6 |
) |
(3.6 |
) |
(4.6 |
) |
Audit settlements(1)
|
— |
|
(0.6 |
) |
(1.7 |
) |
Effect of tax law changes(2)
|
99.7 |
|
— |
|
0.4 |
|
Basis difference in affiliates |
(2.1 |
) |
(0.1 |
) |
— |
|
Tax advantaged investments |
(2.2 |
) |
(2.4 |
) |
(1.8 |
) |
Other, net |
(0.8 |
) |
(0.1 |
) |
1.0 |
|
Effective income tax rate |
129.1 |
% |
30.0 |
% |
30.0 |
% |
|
|
(1) |
For 2016, primarily relates to the conclusion of an IRS audit for 2012–2013. For 2015, primarily relates to the conclusion of a New York City tax audit for 2009–2011. |
|
|
(2) |
For 2017, includes the $22,594 million charge for Tax Reform. For 2015, includes the results of tax reforms enacted in New York City and several states, which resulted in a DTA charge of approximately $101 million.
|
As set forth in the table above, Citi’s effective tax rate for 2017 was 129.1% (29.8% before the effect of Tax Reform, about the same as the effective tax rate in 2016).
Deferred Income Taxes
Deferred income taxes at December 31 related to the following:
|
|
|
|
|
|
|
|
In millions of dollars |
2017 |
2016 |
Deferred tax assets |
|
|
|
|
Credit loss deduction |
$ |
3,423 |
|
$ |
5,146 |
|
Deferred compensation and employee benefits |
1,585 |
|
3,798 |
|
Repositioning and settlement reserves |
454 |
|
1,033 |
|
U.S. tax on non-U.S. earnings |
2,452 |
|
10,050 |
|
Investment and loan basis differences |
3,384 |
|
5,594 |
|
Cash flow hedges |
233 |
|
327 |
|
Tax credit and net operating loss carry-forwards |
21,575 |
|
20,793 |
|
Fixed assets and leases |
1,090 |
|
1,739 |
|
Other deferred tax assets |
1,988 |
|
2,714 |
|
Gross deferred tax assets |
$ |
36,184 |
|
$ |
51,194 |
|
Valuation allowance |
$ |
9,387 |
|
$ |
— |
|
Deferred tax assets after valuation allowance |
$ |
26,797 |
|
$ |
51,194 |
|
Deferred tax liabilities |
|
|
|
|
Intangibles |
$ |
(1,247 |
) |
$ |
(1,711 |
) |
Debt issuances |
(294 |
) |
(641 |
) |
Non-U.S. withholding taxes |
(668 |
) |
(739 |
) |
Interest-related items |
(562 |
) |
(765 |
) |
Other deferred tax liabilities |
(1,545 |
) |
(670 |
) |
Gross deferred tax liabilities |
$ |
(4,316 |
) |
$ |
(4,526 |
) |
Net deferred tax assets |
$ |
22,481 |
|
$ |
46,668 |
|
Unrecognized Tax Benefits
The following is a rollforward of the Company’s unrecognized tax benefits:
|
|
|
|
|
|
|
|
|
|
|
In millions of dollars |
2017 |
2016 |
2015 |
Total unrecognized tax benefits at January 1 |
$ |
1,092 |
|
$ |
1,235 |
|
$ |
1,060 |
|
Net amount of increases for current year’s tax positions |
43 |
|
34 |
|
32 |
|
Gross amount of increases for prior years’ tax positions |
324 |
|
273 |
|
311 |
|
Gross amount of decreases for prior years’ tax positions |
(246 |
) |
(225 |
) |
(61 |
) |
Amounts of decreases relating to settlements |
(199 |
) |
(174 |
) |
(45 |
) |
Reductions due to lapse of statutes of limitation |
(11 |
) |
(21 |
) |
(22 |
) |
Foreign exchange, acquisitions and dispositions |
10 |
|
(30 |
) |
(40 |
) |
Total unrecognized tax benefits at December 31 |
$ |
1,013 |
|
$ |
1,092 |
|
$ |
1,235 |
|
The total amounts of unrecognized tax benefits at December 31, 2017, 2016 and 2015 that, if recognized, would affect Citi’s tax expense, are $0.8 billion, $0.8 billion and $0.9 billion, respectively. The remaining uncertain tax positions have offsetting amounts in other jurisdictions or are temporary differences.
Interest and penalties (not included in “unrecognized tax benefits” above) are a component of Provision for income taxes.
|
|
|
|
|
|
|
|
|
|
|
|
|
|
|
|
|
|
|
|
|
2017 |
2016 |
2015 |
In millions of dollars |
Pretax |
Net of tax |
Pretax |
Net of tax |
Pretax |
Net of tax |
Total interest and penalties on the Consolidated Balance Sheet at January 1 |
$ |
260 |
|
$ |
164 |
|
$ |
233 |
|
$ |
146 |
|
$ |
269 |
|
$ |
169 |
|
Total interest and penalties in the Consolidated Statement of Income |
5 |
|
21 |
|
105 |
|
68 |
|
(29 |
) |
(18 |
) |
Total interest and penalties on the Consolidated Balance Sheet at December 31(1)
|
121 |
|
101 |
|
260 |
|
164 |
|
233 |
|
146 |
|
|
|
(1) |
Includes $3 million for non-U.S. penalties in 2017, 2016 and 2015. Also includes $3 million for state penalties in 2017, 2016 and 2015.
|
As of December 31, 2017, Citi is under audit by the Internal Revenue Service and other major taxing jurisdictions around the world. It is thus reasonably possible that significant changes in the gross balance of unrecognized tax benefits may occur within the next 12 months, although Citi does not expect such audits to result in amounts that would cause a significant change to its effective tax rate.
The following are the major tax jurisdictions in which the Company and its affiliates operate and the earliest tax year subject to examination:
|
|
|
Jurisdiction |
Tax year |
United States |
2014 |
Mexico |
2011 |
New York State and City |
2009 |
United Kingdom |
2014 |
India |
2014 |
Singapore |
2011 |
Hong Kong |
2011 |
Ireland |
2013 |
Non-U.S. Earnings
Non-U.S. pretax earnings approximated $13.7 billion in 2017 (of which a $0.1 billion loss was recorded in Discontinued operations), $11.6 billion in 2016 and $11.3 billion in 2015. As a U.S. corporation, Citigroup and its U.S. subsidiaries are currently subject to U.S. taxation on all non-U.S. pretax earnings of a non-U.S. branch. Starting in 2018, there will be a separate foreign tax credit (FTC) basket for branches. Also starting in 2018, dividends from a non-U.S. subsidiary or affiliate are effectively exempt from U.S. taxation. The Company provides income taxes on the book over tax basis differences of non-U.S. subsidiaries except to the extent that such differences are indefinitely reinvested outside the U.S.
At December 31, 2017, $14.1 billion of basis differences of non-U.S. subsidiaries was indefinitely invested. At the existing tax rates, additional taxes (net of U.S. FTCs) of $3.5 billion would have to be provided if such basis differences were realized. These amounts are significantly less than the corresponding amounts at December 31, 2016 due to the deemed repatriation of unremitted earnings of non-U.S. subsidiaries under the provisions of Tax Reform.
Income taxes are not provided for the Company’s “savings bank base year bad debt reserves” that arose before 1988, because under current U.S. tax rules, such taxes will become payable only to the extent that such amounts are distributed in excess of limits prescribed by federal law. At December 31, 2017, the amount of the base year reserves totaled approximately $358 million (subject to a tax of $75 million).
Deferred Tax Assets
As of December 31, 2017, Citi had a valuation allowance of $9.4 billion, composed of valuation allowances of $5.7 billion on its FTC carry-forwards, $2.2 billion on its U.S. residual DTA related to its non-U.S. branches, $1.4 billion on local non-U.S. DTAs and $0.1 billion on state net operating loss carry-forwards. The valuation allowance against FTCs results from the impact of the lower tax rate and the new separate FTC basket for non-U.S. branches, as well as diminished ability under Tax Reform to generate income from sources outside the U.S. to support FTC utilization. The absolute amount of Citi’s post-Tax Reform-related valuation allowances may change in future years. First, the separate FTC basket for non-U.S. branches will result in additional DTAs (for FTCs) requiring a valuation allowance, given that the local tax rate for these branches exceeds on average the U.S. tax rate of 21%. Second, in Citi’s general basket for FTCs, changes in the forecasted amount of income in U.S. locations derived from sources outside the U.S. could alter the amount of valuation allowance that is needed against such FTCs. As of December 31, 2016, Citi had no valuation allowance on its DTAs. The following table summarizes Citi’s DTAs:
|
|
|
|
|
|
|
|
In billions of dollars |
|
|
Jurisdiction/component(1)
|
DTAs balance December 31, 2017 |
DTAs balance December 31, 2016 |
U.S. federal(2)
|
|
|
|
|
Net operating losses (NOLs)(3)
|
$ |
2.3 |
|
$ |
3.5 |
|
Foreign tax credits (FTCs) |
7.6 |
|
14.2 |
|
General business credits (GBCs) |
1.4 |
|
0.9 |
|
Future tax deductions and credits |
4.8 |
|
21.9 |
|
Total U.S. federal |
$ |
16.1 |
|
$ |
40.5 |
|
State and local |
|
|
|
|
New York NOLs |
$ |
2.3 |
|
$ |
2.2 |
|
Other state NOLs |
0.2 |
|
0.2 |
|
Future tax deductions |
1.3 |
|
1.7 |
|
Total state and local |
$ |
3.8 |
|
$ |
4.1 |
|
Non-U.S. |
|
|
|
|
NOLs |
$ |
0.6 |
|
$ |
0.6 |
|
Future tax deductions |
2.0 |
|
1.5 |
|
Total non-U.S. |
$ |
2.6 |
|
$ |
2.1 |
|
Total |
$ |
22.5 |
|
$ |
46.7 |
|
|
|
(1) |
All amounts are net of valuation allowances. |
|
|
(2) |
Included in the net U.S. federal DTAs of $16.1 billion as of December 31, 2017 were deferred tax liabilities of $2.4 billion that will reverse in the relevant carry-forward period and may be used to support the DTAs.
|
|
|
(3) |
Consists of non-consolidated tax return NOL carry-forwards that are eventually expected to be utilized in Citigroup’s consolidated tax return. |
The following table summarizes the amounts of tax carry-forwards and their expiration dates:
|
|
|
|
|
|
|
|
In billions of dollars |
|
Year of expiration |
December 31, 2017 |
December 31, 2016 |
U.S. tax return foreign tax credit carry-forwards(1)
|
|
|
|
|
2018 |
$ |
0.4 |
|
$ |
2.7 |
|
2019 |
1.3 |
|
1.3 |
|
2020 |
3.2 |
|
3.1 |
|
2021 |
2.0 |
|
1.9 |
|
2022 |
3.4 |
|
3.3 |
|
2023(2)
|
0.4 |
|
0.5 |
|
2025(2)
|
1.4 |
|
1.4 |
|
2027(2)
|
1.2 |
|
— |
|
Total U.S. tax return foreign tax credit carry-forwards |
$ |
13.3 |
|
$ |
14.2 |
|
U.S. tax return general business credit carry-forwards |
|
|
|
|
2032 |
$ |
0.2 |
|
$ |
— |
|
2033 |
0.3 |
|
0.3 |
|
2034 |
0.2 |
|
0.2 |
|
2035 |
0.2 |
|
0.2 |
|
2036 |
0.2 |
|
0.2 |
|
2037 |
0.3 |
|
— |
|
Total U.S. tax return general business credit carry-forwards |
$ |
1.4 |
|
$ |
0.9 |
|
U.S. subsidiary separate federal NOL carry-forwards |
|
|
|
|
2027 |
$ |
0.2 |
|
$ |
0.2 |
|
2028 |
0.1 |
|
0.1 |
|
2030 |
0.3 |
|
0.3 |
|
2032 |
0.1 |
|
— |
|
2033 |
1.6 |
|
1.7 |
|
2034 |
2.3 |
|
2.3 |
|
2035 |
3.3 |
|
3.2 |
|
2036 |
2.1 |
|
2.2 |
|
2037 |
1.0 |
|
— |
|
Total U.S. subsidiary separate federal NOL carry-forwards(3)
|
$ |
11.0 |
|
$ |
10.0 |
|
New York State NOL carry-forwards(3)
|
|
|
|
|
2034 |
$ |
13.6 |
|
$ |
13.0 |
|
New York City NOL carry-forwards(3)
|
|
|
|
|
2034 |
$ |
13.1 |
|
$ |
12.2 |
|
Non-U.S. NOL carry-forwards(1)
|
|
|
|
|
Various |
$ |
2.0 |
|
$ |
2.1 |
|
|
|
(1) |
Before valuation allowance. |
|
|
(2) |
The $3.0 billion in FTC carry-forwards that expire in 2023, 2025 and 2027 are in a non-consolidated tax return entity but are eventually expected to be utilized (net of valuation allowances) in Citigroup’s consolidated tax return.
|
The time remaining for utilization of the FTC component has shortened, given the passage of time. Although realization is not assured, Citi believes that the realization of the recognized net DTAs of $22.5 billion at December 31, 2017 is more-likely-than-not based upon expectations as to future taxable income in the jurisdictions in which the DTAs arise
and available tax planning strategies (as defined in ASC 740, Income Taxes) that would be implemented, if necessary, to prevent a carry-forward from expiring.
Citi believes the U.S. federal and New York state and city NOL carry-forward period of 20 years provides enough time to fully utilize the DTAs pertaining to the existing NOL carry-forwards. This is due to Citi’s forecast of sufficient U.S. taxable income and the fact that New York state and city continue to tax Citi’s non-U.S. income.
With respect to the FTCs component of the DTAs, the carry-forward period is 10 years. Utilization of FTCs in any year is restricted to 21% of foreign source taxable income in that year. However, overall domestic losses that Citi has incurred of approximately $52 billion as of December 31, 2017 are allowed to be reclassified as foreign source income to the extent of 50%–100% of domestic source income produced in subsequent years. Such resulting foreign source income would cover the FTC carry-forwards after valuation allowance. As noted in the tables above, Citi’s FTC carry-forwards were $7.6 billion ($13.3 billion before valuation allowance) as of December 31, 2017, compared to $14.2 billion as of December 31, 2016. This decrease represented $6.6 billion of the $24.2 billion decrease in Citi’s overall DTAs during 2017. Citi believes that it will generate sufficient U.S. taxable income within the 10-year carry-forward period to be able to utilize the net FTCs after the valuation allowance, in addition to any FTCs produced in the tax return for such period, which must be used prior to any carry-forward utilization.
10. EARNINGS PER SHARE
The following table reconciles the income and share data used in the basic and diluted earnings per share (EPS) computations:
|
|
|
|
|
|
|
|
|
|
|
In millions, except per-share amounts |
2017 |
2016 |
2015 |
Income (loss) from continuing operations before attribution of noncontrolling interests |
$ |
(6,627 |
) |
$ |
15,033 |
|
$ |
17,386 |
|
Less: Noncontrolling interests from continuing operations |
60 |
|
63 |
|
90 |
|
Net income (loss) from continuing operations (for EPS purposes) |
$ |
(6,687 |
) |
$ |
14,970 |
|
$ |
17,296 |
|
Income (loss) from discontinued operations, net of taxes |
(111 |
) |
(58 |
) |
(54 |
) |
Citigroup's net income (loss) |
$ |
(6,798 |
) |
$ |
14,912 |
|
$ |
17,242 |
|
Less: Preferred dividends(1)
|
1,213 |
|
1,077 |
|
769 |
|
Net income (loss) available to common shareholders |
$ |
(8,011 |
) |
$ |
13,835 |
|
$ |
16,473 |
|
Less: Dividends and undistributed earnings allocated to employee restricted and deferred shares with nonforfeitable rights to dividends, applicable to basic EPS |
37 |
|
195 |
|
224 |
|
Net income (loss) allocated to common shareholders for basic EPS |
$ |
(8,048 |
) |
$ |
13,640 |
|
$ |
16,249 |
|
Add: Interest expense, net of tax, and dividends on convertible securities and adjustment of undistributed earnings allocated to employee restricted and deferred shares with nonforfeitable rights to dividends, applicable to diluted EPS |
— |
|
— |
|
— |
|
Net income (loss) allocated to common shareholders for diluted EPS |
$ |
(8,048 |
) |
$ |
13,640 |
|
$ |
16,249 |
|
Weighted-average common shares outstanding applicable to basic EPS |
2,698.5 |
|
2,888.1 |
|
3,004.0 |
|
Effect of dilutive securities(2)
|
|
|
|
|
Options(3)
|
— |
|
0.1 |
|
3.6 |
|
Other employee plans non-dividend eligible |
— |
|
0.1 |
|
0.1 |
|
Adjusted weighted-average common shares outstanding applicable to diluted EPS(4)
|
2,698.5 |
|
2,888.3 |
|
3,007.7 |
|
Basic earnings per share(5)
|
|
|
|
|
Income (loss) from continuing operations |
$ |
(2.94 |
) |
$ |
4.74 |
|
$ |
5.43 |
|
Discontinued operations |
(0.04 |
) |
(0.02 |
) |
(0.02 |
) |
Net income (loss) |
$ |
(2.98 |
) |
$ |
4.72 |
|
$ |
5.41 |
|
Diluted earnings per share(5)
|
|
|
|
Income (loss) from continuing operations |
$ |
(2.94 |
) |
$ |
4.74 |
|
$ |
5.42 |
|
Discontinued operations |
(0.04 |
) |
(0.02 |
) |
(0.02 |
) |
Net income (loss) |
$ |
(2.98 |
) |
$ |
4.72 |
|
$ |
5.40 |
|
|
|
(1) |
See Note 20 to the Consolidated Financial Statements for the potential future impact of preferred stock dividends.
|
|
|
(2) |
Warrants issued to the U.S. Treasury as part of the Troubled Asset Relief Program (TARP) and the loss-sharing agreement (all of which were subsequently sold to the public in January 2011), with exercise prices of $178.50 and $104.96 per share for approximately 21.0 million and 25.5 million shares of Citigroup common stock, respectively. Both warrants were not included in the computation of earnings per share in 2017, 2016 and 2015 because they were anti-dilutive.
|
|
|
(3) |
During 2017, 2016 and 2015, weighted-average options to purchase 0.8 million, 4.2 million and 0.9 million shares of common stock, respectively, were outstanding but not included in the computation of earnings per share because the weighted-average exercise prices of $204.80, $98.01 and $199.16 per share, respectively, were anti-dilutive.
|
|
|
(4) |
Due to rounding, common shares outstanding applicable to basic EPS and the effect of dilutive securities may not sum to common shares outstanding applicable to diluted EPS. |
|
|
(5) |
Due to rounding, earnings per share on continuing operations and discontinued operations may not sum to earnings per share on net income. |
11. FEDERAL FUNDS, SECURITIES BORROWED, LOANED AND SUBJECT TO REPURCHASE AGREEMENTS
Federal funds sold and securities borrowed or purchased under agreements to resell, at their respective carrying values, consisted of the following:
|
|
|
|
|
|
|
|
|
December 31 |
December 31 |
In millions of dollars |
2017 |
2016 |
Federal funds sold |
$ |
— |
|
$ |
— |
|
Securities purchased under agreements to resell |
130,984 |
|
131,473 |
|
Deposits paid for securities borrowed |
101,494 |
|
105,340 |
|
Total(1)
|
$ |
232,478 |
|
$ |
236,813 |
|
Federal funds purchased and securities loaned or sold under agreements to repurchase, at their respective carrying values, consisted of the following:
|
|
|
|
|
|
|
|
|
December 31 |
December 31 |
In millions of dollars |
2017 |
2016 |
Federal funds purchased |
$ |
326 |
|
$ |
178 |
|
Securities sold under agreements to repurchase |
142,646 |
|
125,685 |
|
Deposits received for securities loaned |
13,305 |
|
15,958 |
|
Total(1)
|
$ |
156,277 |
|
$ |
141,821 |
|
|
|
(1) |
The above tables do not include securities-for-securities lending transactions of $14.0 billion and $9.3 billion at December 31, 2017 and December 31, 2016, respectively, where the Company acts as lender and receives securities that can be sold or pledged as collateral. In these transactions, the Company recognizes the securities received at fair value within Other assets and the obligation to return those securities as a liability within Brokerage payables.
|
The resale and repurchase agreements represent collateralized financing transactions. Citi executes these transactions primarily through its broker-dealer subsidiaries to facilitate customer matched-book activity and to efficiently fund a portion of Citi’s trading inventory. Transactions executed by Citi’s bank subsidiaries primarily facilitate customer financing activity.
To maintain reliable funding under a wide range of market conditions, including under periods of stress, Citi manages these activities by taking into consideration the quality of the underlying collateral, and stipulating financing tenor. Citi manages the risks in its collateralized financing transactions by conducting daily stress tests to account for changes in capacity, tenors, haircut, collateral profile and client actions. Additionally, Citi maintains counterparty diversification by establishing concentration triggers and assessing counterparty reliability and stability under stress.
It is the Company’s policy to take possession of the underlying collateral, monitor its market value relative to the amounts due under the agreements and, when necessary,
require prompt transfer of additional collateral in order to maintain contractual margin protection. For resale and repurchase agreements, when necessary, the company posts additional collateral in order to maintain contractual margin protection.
Collateral typically consists of government and government-agency securities, corporate and municipal bonds, equities and mortgage-backed and other asset-backed securities.
The resale and repurchase agreements are generally documented under industry standard agreements that allow the prompt close-out of all transactions (including the liquidation of securities held) and the offsetting of obligations to return cash or securities by the non-defaulting party, following a payment default or other type of default under the relevant master agreement. Events of default generally include (i) failure to deliver cash or securities as required under the transaction, (ii) failure to provide or return cash or securities as used for margining purposes, (iii) breach of representation, (iv) cross-default to another transaction entered into among the parties, or, in some cases, their affiliates, and (v) a repudiation of obligations under the agreement. The counterparty that receives the securities in these transactions is generally unrestricted in its use of the securities, with the exception of transactions executed on a tri-party basis, where the collateral is maintained by a custodian and operational limitations may restrict its use of the securities.
A substantial portion of the resale and repurchase agreements is recorded at fair value, as described in Notes 24 and 25 to the Consolidated Financial Statements. The remaining portion is carried at the amount of cash initially advanced or received, plus accrued interest, as specified in the respective agreements.
The securities borrowing and lending agreements also represent collateralized financing transactions similar to the resale and repurchase agreements. Collateral typically consists of government and government-agency securities and corporate debt and equity securities.
Similar to the resale and repurchase agreements, securities borrowing and lending agreements are generally documented under industry standard agreements that allow the prompt close-out of all transactions (including the liquidation of securities held) and the offsetting of obligations to return cash or securities by the non-defaulting party, following a payment default or other default by the other party under the relevant master agreement. Events of default and rights to use securities under the securities borrowing and lending agreements are similar to the resale and repurchase agreements referenced above.
A substantial portion of securities borrowing and lending agreements is recorded at the amount of cash advanced or received. The remaining portion is recorded at fair value as the Company elected the fair value option for certain securities borrowed and loaned portfolios, as described in Note 25 to the Consolidated Financial Statements. With respect to securities loaned, the Company receives cash collateral in an amount generally in excess of the market value of the securities loaned. The Company monitors the market value of securities borrowed and securities loaned on a daily basis and obtains or
posts additional collateral in order to maintain contractual margin protection.
The enforceability of offsetting rights incorporated in the master netting agreements for resale and repurchase agreements and securities borrowing and lending agreements is evidenced to the extent that a supportive legal opinion has been obtained from counsel of recognized standing that provides the requisite level of certainty regarding the enforceability of these agreements. Also, the exercise of rights by the non-defaulting party to terminate and closeout transactions on a net basis under these agreements will not be stayed or avoided under applicable law upon an event of default including bankruptcy, insolvency or similar proceeding.
A legal opinion may not have been sought or obtained for certain jurisdictions where local law is silent or sufficiently ambiguous to determine the enforceability of offsetting rights or where adverse case law or conflicting regulation may cast
doubt on the enforceability of such rights. In some jurisdictions and for some counterparty types, the insolvency law for a particular counterparty type may be nonexistent or unclear as overlapping regimes may exist. For example, this may be the case for certain sovereigns, municipalities, central banks and U.S. pension plans.
The following tables present the gross and net resale and repurchase agreements and securities borrowing and lending
agreements and the related offsetting amount permitted under ASC 210-20-45. The tables also include amounts related to financial instruments that are not permitted to be offset under ASC 210-20-45 but would be eligible for offsetting to the extent that an event of default occurred and a legal opinion supporting enforceability of the offsetting rights has been obtained. Remaining exposures continue to be secured by financial collateral, but the Company may not have sought or been able to obtain a legal opinion evidencing enforceability of the offsetting right.
|
|
|
|
|
|
|
|
|
|
|
|
|
|
|
|
|
|
As of December 31, 2017 |
In millions of dollars |
Gross amounts
of recognized
assets |
Gross amounts
offset on the
Consolidated
Balance Sheet(1)
|
Net amounts of
assets included on
the Consolidated
Balance Sheet(2)
|
Amounts
not offset on the
Consolidated Balance
Sheet but eligible for
offsetting upon
counterparty default(3)
|
Net
amounts(4)
|
Securities purchased under agreements to resell |
$ |
204,460 |
|
$ |
73,476 |
|
$ |
130,984 |
|
$ |
103,022 |
|
$ |
27,962 |
|
Deposits paid for securities borrowed |
101,494 |
|
— |
|
101,494 |
|
22,271 |
|
79,223 |
|
Total |
$ |
305,954 |
|
$ |
73,476 |
|
$ |
232,478 |
|
$ |
125,293 |
|
$ |
107,185 |
|
|
|
|
|
|
|
|
|
|
|
|
|
|
|
|
|
|
In millions of dollars |
Gross amounts
of recognized
liabilities |
Gross amounts
offset on the
Consolidated
Balance Sheet(1)
|
Net amounts of
liabilities included on
the Consolidated
Balance Sheet(2)
|
Amounts
not offset on the
Consolidated Balance
Sheet but eligible for
offsetting upon
counterparty default(3)
|
Net
amounts(4)
|
Securities sold under agreements to repurchase |
$ |
216,122 |
|
$ |
73,476 |
|
$ |
142,646 |
|
$ |
73,716 |
|
$ |
68,930 |
|
Deposits received for securities loaned |
13,305 |
|
— |
|
13,305 |
|
4,079 |
|
9,226 |
|
Total |
$ |
229,427 |
|
$ |
73,476 |
|
$ |
155,951 |
|
$ |
77,795 |
|
$ |
78,156 |
|
|
|
|
|
|
|
|
|
|
|
|
|
|
|
|
|
|
|
As of December 31, 2016 |
In millions of dollars |
Gross amounts
of recognized
assets |
Gross amounts
offset on the
Consolidated
Balance Sheet(1)
|
Net amounts of
assets included on
the Consolidated
Balance Sheet(2)
|
Amounts
not offset on the
Consolidated Balance
Sheet but eligible for
offsetting upon
counterparty default(3)
|
Net
amounts(4)
|
Securities purchased under agreements to resell |
$ |
176,284 |
|
$ |
44,811 |
|
$ |
131,473 |
|
$ |
102,874 |
|
$ |
28,599 |
|
Deposits paid for securities borrowed |
105,340 |
|
— |
|
105,340 |
|
16,200 |
|
89,140 |
|
Total |
$ |
281,624 |
|
$ |
44,811 |
|
$ |
236,813 |
|
$ |
119,074 |
|
$ |
117,739 |
|
|
|
|
|
|
|
|
|
|
|
|
|
|
|
|
|
|
In millions of dollars |
Gross amounts
of recognized
liabilities |
Gross amounts
offset on the
Consolidated
Balance Sheet(1)
|
Net amounts of
liabilities included on
the Consolidated
Balance Sheet(2)
|
Amounts
not offset on the
Consolidated Balance
Sheet but eligible for
offsetting upon
counterparty default(3)
|
Net
amounts(4)
|
Securities sold under agreements to repurchase |
$ |
170,496 |
|
$ |
44,811 |
|
$ |
125,685 |
|
$ |
63,517 |
|
$ |
62,168 |
|
Deposits received for securities loaned |
15,958 |
|
— |
|
15,958 |
|
3,529 |
|
12,429 |
|
Total |
$ |
186,454 |
|
$ |
44,811 |
|
$ |
141,643 |
|
$ |
67,046 |
|
$ |
74,597 |
|
|
|
(1) |
Includes financial instruments subject to enforceable master netting agreements that are permitted to be offset under ASC 210-20-45. |
|
|
(2) |
The total of this column for each period excludes federal funds sold/purchased. See tables above. |
|
|
(3) |
Includes financial instruments subject to enforceable master netting agreements that are not permitted to be offset under ASC 210-20-45 but would be eligible for offsetting to the extent that an event of default has occurred and a legal opinion supporting enforceability of the offsetting right has been obtained. |
|
|
(4) |
Remaining exposures continue to be secured by financial collateral, but Citi may not have sought or been able to obtain a legal opinion evidencing enforceability of the offsetting right. |
The following tables present the gross amount of liabilities associated with repurchase agreements and securities lending agreements, by remaining contractual maturity:
|
|
|
|
|
|
|
|
|
|
|
|
|
|
|
|
|
|
As of December 31, 2017 |
In millions of dollars |
Open and overnight |
Up to 30 days |
31–90 days |
Greater than 90 days |
Total |
Securities sold under agreements to repurchase |
$ |
82,073 |
|
$ |
68,372 |
|
$ |
33,846 |
|
$ |
31,831 |
|
$ |
216,122 |
|
Deposits received for securities loaned |
9,946 |
|
266 |
|
1,912 |
|
1,181 |
|
13,305 |
|
Total |
$ |
92,019 |
|
$ |
68,638 |
|
$ |
35,758 |
|
$ |
33,012 |
|
$ |
229,427 |
|
|
|
|
|
|
|
|
|
|
|
|
|
|
|
|
|
|
|
As of December 31, 2016 |
In millions of dollars |
Open and overnight |
Up to 30 days |
31–90 days |
Greater than 90 days |
Total |
Securities sold under agreements to repurchase |
$ |
79,740 |
|
$ |
50,399 |
|
$ |
19,396 |
|
$ |
20,961 |
|
$ |
170,496 |
|
Deposits received for securities loaned |
10,813 |
|
2,169 |
|
2,044 |
|
932 |
|
15,958 |
|
Total |
$ |
90,553 |
|
$ |
52,568 |
|
$ |
21,440 |
|
$ |
21,893 |
|
$ |
186,454 |
|
The following tables present the gross amount of liabilities associated with repurchase agreements and securities lending agreements, by class of underlying collateral:
|
|
|
|
|
|
|
|
|
|
|
|
As of December 31, 2017 |
In millions of dollars |
Repurchase agreements |
Securities lending agreements |
Total |
U.S. Treasury and federal agency securities |
$ |
58,774 |
|
$ |
— |
|
$ |
58,774 |
|
State and municipal securities |
1,605 |
|
— |
|
1,605 |
|
Foreign government securities |
89,576 |
|
105 |
|
89,681 |
|
Corporate bonds |
20,194 |
|
657 |
|
20,851 |
|
Equity securities |
20,724 |
|
11,907 |
|
32,631 |
|
Mortgage-backed securities |
17,791 |
|
— |
|
17,791 |
|
Asset-backed securities |
5,479 |
|
— |
|
5,479 |
|
Other |
1,979 |
|
636 |
|
2,615 |
|
Total |
$ |
216,122 |
|
$ |
13,305 |
|
$ |
229,427 |
|
|
|
|
|
|
|
|
|
|
|
|
|
As of December 31, 2016 |
In millions of dollars |
Repurchase agreements |
Securities lending agreements |
Total |
U.S. Treasury and federal agency securities |
$ |
66,263 |
|
$ |
— |
|
$ |
66,263 |
|
State and municipal securities |
334 |
|
— |
|
334 |
|
Foreign government securities |
52,988 |
|
1,390 |
|
54,378 |
|
Corporate bonds |
17,164 |
|
630 |
|
17,794 |
|
Equity securities |
12,206 |
|
13,913 |
|
26,119 |
|
Mortgage-backed securities |
11,421 |
|
— |
|
11,421 |
|
Asset-backed securities |
5,428 |
|
— |
|
5,428 |
|
Other |
4,692 |
|
25 |
|
4,717 |
|
Total |
$ |
170,496 |
|
$ |
15,958 |
|
$ |
186,454 |
|
12. BROKERAGE RECEIVABLES AND BROKERAGE
PAYABLES
Citi has receivables and payables for financial instruments sold to and purchased from brokers, dealers and customers, which arise in the ordinary course of business. Citi is exposed to risk of loss from the inability of brokers, dealers or customers to pay for purchases or to deliver the financial instruments sold, in which case Citi would have to sell or purchase the financial instruments at prevailing market prices. Credit risk is reduced to the extent that an exchange or clearing organization acts as a counterparty to the transaction and replaces the broker, dealer or customer in question.
Citi seeks to protect itself from the risks associated with customer activities by requiring customers to maintain margin collateral in compliance with regulatory and internal guidelines. Margin levels are monitored daily, and customers deposit additional collateral as required. Where customers cannot meet collateral requirements, Citi may liquidate sufficient underlying financial instruments to bring the customer into compliance with the required margin level.
Exposure to credit risk is impacted by market volatility, which may impair the ability of clients to satisfy their obligations to Citi. Credit limits are established and closely monitored for customers and for brokers and dealers engaged in forwards, futures and other transactions deemed to be credit sensitive.
Brokerage receivables and Brokerage payables consisted of the following:
|
|
|
|
|
|
|
|
|
December 31, |
In millions of dollars |
2017 |
2016 |
Receivables from customers |
$ |
19,215 |
|
$ |
10,374 |
|
Receivables from brokers, dealers and clearing organizations |
19,169 |
|
18,513 |
|
Total brokerage receivables(1)
|
$ |
38,384 |
|
$ |
28,887 |
|
Payables to customers |
$ |
38,741 |
|
$ |
37,237 |
|
Payables to brokers, dealers and clearing organizations |
22,601 |
|
19,915 |
|
Total brokerage payables(1)
|
$ |
61,342 |
|
$ |
57,152 |
|
|
|
(1) |
Includes brokerage receivables and payables recorded by Citi broker-dealer entities that are accounted for in accordance with the AICPA Accounting Guide for Brokers and Dealers in Securities as codified in ASC 940-320. |
Overview
The following table presents Citi’s investments by category:
|
|
|
|
|
|
|
|
|
December 31, |
In millions of dollars |
2017 |
2016 |
Securities available-for-sale (AFS) |
$ |
290,914 |
|
$ |
299,424 |
|
Debt securities held-to-maturity (HTM)(1)
|
53,320 |
|
45,667 |
|
Non-marketable equity securities carried at fair value(2)
|
1,206 |
|
1,774 |
|
Non-marketable equity securities carried at cost(3)
|
6,850 |
|
6,439 |
|
Total investments |
$ |
352,290 |
|
$ |
353,304 |
|
|
|
(1) |
Carried at adjusted amortized cost basis, net of any credit-related impairment. |
|
|
(2) |
Unrealized gains and losses for non-marketable equity securities carried at fair value are recognized in earnings. |
|
|
(3) |
Primarily consists of shares issued by the Federal Reserve Bank, Federal Home Loan Banks, and various clearing houses of which Citigroup is a member. |
The following table presents interest and dividend income on investments:
|
|
|
|
|
|
|
|
|
|
|
In millions of dollars |
2017 |
2016 |
2015 |
Taxable interest |
$ |
7,538 |
|
$ |
6,858 |
|
$ |
6,433 |
|
Interest exempt from U.S. federal income tax |
535 |
|
549 |
|
196 |
|
Dividend income |
222 |
|
175 |
|
388 |
|
Total interest and dividend income |
$ |
8,295 |
|
$ |
7,582 |
|
$ |
7,017 |
|
The following table presents realized gains and losses on the sale of investments, which excludes losses from other-than-temporary impairment (OTTI):
|
|
|
|
|
|
|
|
|
|
|
In millions of dollars |
2017 |
2016 |
2015 |
Gross realized investment gains |
$ |
1,039 |
|
$ |
1,460 |
|
$ |
1,124 |
|
Gross realized investment losses |
(261 |
) |
(512 |
) |
(442 |
) |
Net realized gains on sale of investments |
$ |
778 |
|
$ |
948 |
|
$ |
682 |
|
The Company has sold certain debt securities that were classified as HTM. These sales were in response to significant deterioration in the creditworthiness of the issuers or securities or because the Company has collected a substantial portion (at least 85%) of the principal outstanding at acquisition of the security. In addition, certain other securities were reclassified to AFS investments in response to
significant credit deterioration. Because the Company generally intends to sell these reclassified securities, Citi recorded OTTI on the securities. The following table sets forth, for the periods indicated, the carrying value of HTM securities sold and reclassified to AFS, as well as the related gain (loss) or the OTTI losses recorded on these securities.
|
|
|
|
|
|
|
|
|
|
|
|
In millions of dollars |
2017 |
2016 |
2015 |
Carrying value of HTM securities sold |
$ |
81 |
|
$ |
49 |
|
$ |
392 |
|
Net realized gain (loss) on sale of HTM securities |
13 |
|
14 |
|
10 |
|
Carrying value of securities reclassified to AFS |
74 |
|
150 |
|
243 |
|
OTTI losses on securities reclassified to AFS |
— |
|
(6 |
) |
(15 |
) |
Securities Available-for-Sale
The amortized cost and fair value of AFS securities were as follows:
|
|
|
|
|
|
|
|
|
|
|
|
|
|
|
|
|
|
|
|
|
|
|
|
|
|
|
2017 |
2016 |
In millions of dollars |
Amortized
cost
|
Gross
unrealized
gains
|
Gross
unrealized
losses
|
Fair
value
|
Amortized
cost
|
Gross
unrealized
gains
|
Gross
unrealized
losses
|
Fair
value
|
Debt securities AFS |
|
|
|
|
|
|
|
|
Mortgage-backed securities(1)
|
|
|
|
|
|
|
|
|
U.S. government-sponsored agency guaranteed |
$ |
42,116 |
|
$ |
125 |
|
$ |
500 |
|
$ |
41,741 |
|
$ |
38,663 |
|
$ |
248 |
|
$ |
506 |
|
$ |
38,405 |
|
Prime |
11 |
|
6 |
|
— |
|
17 |
|
2 |
|
— |
|
— |
|
2 |
|
Alt-A |
26 |
|
90 |
|
— |
|
116 |
|
43 |
|
7 |
|
— |
|
50 |
|
Non-U.S. residential |
2,744 |
|
13 |
|
6 |
|
2,751 |
|
3,852 |
|
13 |
|
7 |
|
3,858 |
|
Commercial |
334 |
|
— |
|
2 |
|
332 |
|
357 |
|
2 |
|
1 |
|
358 |
|
Total mortgage-backed securities |
$ |
45,231 |
|
$ |
234 |
|
$ |
508 |
|
$ |
44,957 |
|
$ |
42,917 |
|
$ |
270 |
|
$ |
514 |
|
$ |
42,673 |
|
U.S. Treasury and federal agency securities |
|
|
|
|
|
|
|
|
U.S. Treasury |
$ |
108,344 |
|
$ |
77 |
|
$ |
971 |
|
$ |
107,450 |
|
$ |
113,606 |
|
$ |
629 |
|
$ |
452 |
|
$ |
113,783 |
|
Agency obligations |
10,813 |
|
7 |
|
124 |
|
10,696 |
|
9,952 |
|
21 |
|
85 |
|
9,888 |
|
Total U.S. Treasury and federal agency securities |
$ |
119,157 |
|
$ |
84 |
|
$ |
1,095 |
|
$ |
118,146 |
|
$ |
123,558 |
|
$ |
650 |
|
$ |
537 |
|
$ |
123,671 |
|
State and municipal(2)
|
$ |
8,870 |
|
$ |
140 |
|
$ |
245 |
|
$ |
8,765 |
|
$ |
10,797 |
|
$ |
80 |
|
$ |
757 |
|
$ |
10,120 |
|
Foreign government |
100,615 |
|
508 |
|
590 |
|
100,533 |
|
98,112 |
|
590 |
|
554 |
|
98,148 |
|
Corporate |
14,144 |
|
51 |
|
86 |
|
14,109 |
|
17,195 |
|
105 |
|
176 |
|
17,124 |
|
Asset-backed securities(1)
|
3,906 |
|
14 |
|
2 |
|
3,918 |
|
6,810 |
|
6 |
|
22 |
|
6,794 |
|
Other debt securities |
297 |
|
— |
|
— |
|
297 |
|
503 |
|
— |
|
— |
|
503 |
|
Total debt securities AFS |
$ |
292,220 |
|
$ |
1,031 |
|
$ |
2,526 |
|
$ |
290,725 |
|
$ |
299,892 |
|
$ |
1,701 |
|
$ |
2,560 |
|
$ |
299,033 |
|
Marketable equity securities AFS |
$ |
186 |
|
$ |
4 |
|
$ |
1 |
|
$ |
189 |
|
$ |
377 |
|
$ |
20 |
|
$ |
6 |
|
$ |
391 |
|
Total securities AFS |
$ |
292,406 |
|
$ |
1,035 |
|
$ |
2,527 |
|
$ |
290,914 |
|
$ |
300,269 |
|
$ |
1,721 |
|
$ |
2,566 |
|
$ |
299,424 |
|
|
|
(1) |
The Company invests in mortgage-backed and asset-backed securities. These securitizations are generally considered VIEs. The Company’s maximum exposure to loss from these VIEs is equal to the carrying amount of the securities, which is reflected in the table above. For mortgage-backed and asset-backed securitizations in which the Company has other involvement, see Note 21 to the Consolidated Financial Statements.
|
|
|
(2) |
In the second quarter of 2017, Citi early adopted ASU 2017-08. Upon adoption, a cumulative effect adjustment was recorded to reduce retained earnings, effective January 1, 2017, for the incremental amortization of purchase premiums and cumulative fair value hedge adjustments on callable state and municipal debt securities. See Note 1 to the Consolidated Financial Statements.
|
At December 31, 2017, the amortized cost of approximately 4,600 investments in equity and fixed income securities exceeded their fair value by $2,527 million. Of the $2,527 million, the gross unrealized losses on equity securities were $1 million. Of the remainder, $1,854 million represented unrealized losses on fixed income investments that have been in a gross-unrealized-loss position for less than
a year and, of these, 99% were rated investment grade; and $672 million represented unrealized losses on fixed income investments that have been in a gross-unrealized-loss position for a year or more and, of these, 94% were rated investment grade. Of the $672 million mentioned above, $234 million represent state and municipal securities.
The following table shows the fair value of AFS securities that have been in an unrealized loss position:
|
|
|
|
|
|
|
|
|
|
|
|
|
|
|
|
|
|
|
|
|
Less than 12 months |
12 months or longer |
Total |
In millions of dollars |
Fair
value
|
Gross
unrealized
losses
|
Fair
value
|
Gross
unrealized
losses
|
Fair
value
|
Gross
unrealized
losses
|
December 31, 2017 |
|
|
|
|
|
|
Securities AFS |
|
|
|
|
|
|
Mortgage-backed securities |
|
|
|
|
|
|
U.S. government-sponsored agency guaranteed |
$ |
30,994 |
|
$ |
438 |
|
$ |
2,206 |
|
$ |
62 |
|
$ |
33,200 |
|
$ |
500 |
|
Prime |
— |
|
— |
|
— |
|
— |
|
— |
|
— |
|
Non-U.S. residential |
753 |
|
6 |
|
— |
|
— |
|
753 |
|
6 |
|
Commercial |
150 |
|
1 |
|
57 |
|
1 |
|
207 |
|
2 |
|
Total mortgage-backed securities |
$ |
31,897 |
|
$ |
445 |
|
$ |
2,263 |
|
$ |
63 |
|
$ |
34,160 |
|
$ |
508 |
|
U.S. Treasury and federal agency securities |
|
|
|
|
|
|
U.S. Treasury |
$ |
79,050 |
|
$ |
856 |
|
$ |
7,404 |
|
$ |
115 |
|
$ |
86,454 |
|
$ |
971 |
|
Agency obligations |
8,857 |
|
110 |
|
1,163 |
|
14 |
|
10,020 |
|
124 |
|
Total U.S. Treasury and federal agency securities |
$ |
87,907 |
|
$ |
966 |
|
$ |
8,567 |
|
$ |
129 |
|
$ |
96,474 |
|
$ |
1,095 |
|
State and municipal |
$ |
1,009 |
|
$ |
11 |
|
$ |
1,155 |
|
$ |
234 |
|
$ |
2,164 |
|
$ |
245 |
|
Foreign government |
53,206 |
|
356 |
|
9,051 |
|
234 |
|
62,257 |
|
590 |
|
Corporate |
6,737 |
|
74 |
|
859 |
|
12 |
|
7,596 |
|
86 |
|
Asset-backed securities |
449 |
|
1 |
|
25 |
|
1 |
|
474 |
|
2 |
|
Other debt securities |
— |
|
— |
|
— |
|
— |
|
— |
|
— |
|
Marketable equity securities AFS |
11 |
|
1 |
|
— |
|
— |
|
11 |
|
1 |
|
Total securities AFS |
$ |
181,216 |
|
$ |
1,854 |
|
$ |
21,920 |
|
$ |
673 |
|
$ |
203,136 |
|
$ |
2,527 |
|
December 31, 2016 |
|
|
|
|
|
|
|
|
|
|
|
|
Securities AFS |
|
|
|
|
|
|
|
|
|
|
|
|
Mortgage-backed securities |
|
|
|
|
|
|
|
|
|
|
|
|
U.S. government-sponsored agency guaranteed |
$ |
23,534 |
|
$ |
436 |
|
$ |
2,236 |
|
$ |
70 |
|
$ |
25,770 |
|
$ |
506 |
|
Prime |
1 |
|
— |
|
— |
|
— |
|
1 |
|
— |
|
Non-U.S. residential |
486 |
|
— |
|
1,276 |
|
7 |
|
1,762 |
|
7 |
|
Commercial |
75 |
|
1 |
|
58 |
|
— |
|
133 |
|
1 |
|
Total mortgage-backed securities |
$ |
24,096 |
|
$ |
437 |
|
$ |
3,570 |
|
$ |
77 |
|
$ |
27,666 |
|
$ |
514 |
|
U.S. Treasury and federal agency securities |
|
|
|
|
|
|
|
|
|
|
|
|
U.S. Treasury |
$ |
44,342 |
|
$ |
445 |
|
$ |
1,335 |
|
$ |
7 |
|
$ |
45,677 |
|
$ |
452 |
|
Agency obligations |
6,552 |
|
83 |
|
250 |
|
2 |
|
6,802 |
|
85 |
|
Total U.S. Treasury and federal agency securities |
$ |
50,894 |
|
$ |
528 |
|
$ |
1,585 |
|
$ |
9 |
|
$ |
52,479 |
|
$ |
537 |
|
State and municipal |
$ |
1,616 |
|
$ |
55 |
|
$ |
3,116 |
|
$ |
702 |
|
$ |
4,732 |
|
$ |
757 |
|
Foreign government |
38,226 |
|
243 |
|
8,973 |
|
311 |
|
47,199 |
|
554 |
|
Corporate |
7,011 |
|
129 |
|
1,877 |
|
47 |
|
8,888 |
|
176 |
|
Asset-backed securities |
411 |
|
— |
|
3,213 |
|
22 |
|
3,624 |
|
22 |
|
Other debt securities |
5 |
|
— |
|
— |
|
— |
|
5 |
|
— |
|
Marketable equity securities AFS |
19 |
|
2 |
|
24 |
|
4 |
|
43 |
|
6 |
|
Total securities AFS |
$ |
122,278 |
|
$ |
1,394 |
|
$ |
22,358 |
|
$ |
1,172 |
|
$ |
144,636 |
|
$ |
2,566 |
|
The following table presents the amortized cost and fair value of AFS debt securities by contractual maturity dates:
|
|
|
|
|
|
|
|
|
|
|
|
|
|
|
December 31, |
|
2017 |
2016 |
In millions of dollars |
Amortized
cost
|
Fair
value
|
Amortized
cost
|
Fair
value
|
Mortgage-backed securities(1)
|
|
|
|
|
Due within 1 year |
$ |
45 |
|
$ |
45 |
|
$ |
132 |
|
$ |
132 |
|
After 1 but within 5 years |
1,306 |
|
1,304 |
|
736 |
|
738 |
|
After 5 but within 10 years |
1,376 |
|
1,369 |
|
2,279 |
|
2,265 |
|
After 10 years(2)
|
42,504 |
|
42,239 |
|
39,770 |
|
39,538 |
|
Total |
$ |
45,231 |
|
$ |
44,957 |
|
$ |
42,917 |
|
$ |
42,673 |
|
U.S. Treasury and federal agency securities |
|
|
|
|
Due within 1 year |
$ |
4,913 |
|
$ |
4,907 |
|
$ |
4,945 |
|
$ |
4,945 |
|
After 1 but within 5 years |
111,236 |
|
110,238 |
|
101,369 |
|
101,323 |
|
After 5 but within 10 years |
3,008 |
|
3,001 |
|
17,153 |
|
17,314 |
|
After 10 years(2)
|
— |
|
— |
|
91 |
|
89 |
|
Total |
$ |
119,157 |
|
$ |
118,146 |
|
$ |
123,558 |
|
$ |
123,671 |
|
State and municipal |
|
|
|
|
Due within 1 year |
$ |
1,792 |
|
$ |
1,792 |
|
$ |
2,093 |
|
$ |
2,092 |
|
After 1 but within 5 years |
2,579 |
|
2,576 |
|
2,668 |
|
2,662 |
|
After 5 but within 10 years |
514 |
|
528 |
|
335 |
|
334 |
|
After 10 years(2)
|
3,985 |
|
3,869 |
|
5,701 |
|
5,032 |
|
Total |
$ |
8,870 |
|
$ |
8,765 |
|
$ |
10,797 |
|
$ |
10,120 |
|
Foreign government |
|
|
|
|
Due within 1 year |
$ |
32,130 |
|
$ |
32,100 |
|
$ |
32,540 |
|
$ |
32,547 |
|
After 1 but within 5 years |
53,034 |
|
53,165 |
|
51,008 |
|
50,881 |
|
After 5 but within 10 years |
12,949 |
|
12,680 |
|
12,388 |
|
12,440 |
|
After 10 years(2)
|
2,502 |
|
2,588 |
|
2,176 |
|
2,280 |
|
Total |
$ |
100,615 |
|
$ |
100,533 |
|
$ |
98,112 |
|
$ |
98,148 |
|
All other(3)
|
|
|
|
|
Due within 1 year |
$ |
3,998 |
|
$ |
3,991 |
|
$ |
2,629 |
|
$ |
2,628 |
|
After 1 but within 5 years |
9,047 |
|
9,027 |
|
12,339 |
|
12,334 |
|
After 5 but within 10 years |
3,415 |
|
3,431 |
|
6,566 |
|
6,528 |
|
After 10 years(2)
|
1,887 |
|
1,875 |
|
2,974 |
|
2,931 |
|
Total |
$ |
18,347 |
|
$ |
18,324 |
|
$ |
24,508 |
|
$ |
24,421 |
|
Total debt securities AFS |
$ |
292,220 |
|
$ |
290,725 |
|
$ |
299,892 |
|
$ |
299,033 |
|
|
|
(1) |
Includes mortgage-backed securities of U.S. government-sponsored agencies. |
|
|
(2) |
Investments with no stated maturities are included as contractual maturities of greater than 10 years. Actual maturities may differ due to call or prepayment rights. |
|
|
(3) |
Includes corporate, asset-backed and other debt securities. |
Debt Securities Held-to-Maturity
The carrying value and fair value of debt securities HTM were as follows:
|
|
|
|
|
|
|
|
|
|
|
|
|
|
|
|
|
|
|
|
In millions of dollars |
Adjusted amortized
cost basis(1)
|
Net unrealized gains
(losses)
recognized in
AOCI
|
Carrying
value(2)
|
Gross
unrealized
gains
|
Gross
unrealized
(losses)
|
Fair
value
|
December 31, 2017 |
|
|
|
|
|
Debt securities held-to-maturity |
|
|
|
|
|
|
Mortgage-backed securities(3)
|
|
|
|
|
|
|
U.S. government agency guaranteed |
$ |
23,854 |
|
$ |
26 |
|
$ |
23,880 |
|
$ |
40 |
|
$ |
(157 |
) |
$ |
23,763 |
|
Prime |
— |
|
— |
|
— |
|
— |
|
— |
|
— |
|
Alt-A |
206 |
|
(65 |
) |
141 |
|
57 |
|
— |
|
198 |
|
Non-U.S. residential |
1,887 |
|
(46 |
) |
1,841 |
|
65 |
|
— |
|
1,906 |
|
Commercial |
237 |
|
— |
|
237 |
|
— |
|
— |
|
237 |
|
Total mortgage-backed securities |
$ |
26,184 |
|
$ |
(85 |
) |
$ |
26,099 |
|
$ |
162 |
|
$ |
(157 |
) |
$ |
26,104 |
|
State and municipal (4)
|
$ |
8,925 |
|
$ |
(28 |
) |
$ |
8,897 |
|
$ |
378 |
|
$ |
(73 |
) |
$ |
9,202 |
|
Foreign government |
740 |
|
— |
|
740 |
|
— |
|
(18 |
) |
722 |
|
Asset-backed securities(3)
|
17,588 |
|
(4 |
) |
17,584 |
|
162 |
|
(22 |
) |
17,724 |
|
Total debt securities held-to-maturity |
$ |
53,437 |
|
$ |
(117 |
) |
$ |
53,320 |
|
$ |
702 |
|
$ |
(270 |
) |
$ |
53,752 |
|
December 31, 2016 |
|
|
|
|
|
|
|
|
|
|
|
Debt securities held-to-maturity |
|
|
|
|
|
|
|
|
|
|
|
|
Mortgage-backed securities(3)
|
|
|
|
|
|
|
|
|
|
|
|
|
U.S. government agency guaranteed |
$ |
22,462 |
|
$ |
33 |
|
$ |
22,495 |
|
$ |
47 |
|
$ |
(186 |
) |
$ |
22,356 |
|
Prime |
31 |
|
(7 |
) |
24 |
|
10 |
|
(1 |
) |
33 |
|
Alt-A |
314 |
|
(27 |
) |
287 |
|
69 |
|
(1 |
) |
355 |
|
Non-U.S. residential |
1,871 |
|
(47 |
) |
1,824 |
|
49 |
|
— |
|
1,873 |
|
Commercial |
14 |
|
— |
|
14 |
|
— |
|
— |
|
14 |
|
Total mortgage-backed securities |
$ |
24,692 |
|
$ |
(48 |
) |
$ |
24,644 |
|
$ |
175 |
|
$ |
(188 |
) |
$ |
24,631 |
|
State and municipal |
$ |
9,025 |
|
$ |
(442 |
) |
$ |
8,583 |
|
$ |
129 |
|
$ |
(238 |
) |
$ |
8,474 |
|
Foreign government |
1,339 |
|
— |
|
1,339 |
|
— |
|
(26 |
) |
1,313 |
|
Asset-backed securities(3)
|
11,107 |
|
(6 |
) |
11,101 |
|
41 |
|
(5 |
) |
11,137 |
|
Total debt securities held-to-maturity(5)
|
$ |
46,163 |
|
$ |
(496 |
) |
$ |
45,667 |
|
$ |
345 |
|
$ |
(457 |
) |
$ |
45,555 |
|
|
|
(1) |
For securities transferred to HTM from Trading account assets, adjusted amortized cost basis is defined as the fair value of the securities at the date of transfer plus any accretion income and less any impairments recognized in earnings subsequent to transfer. For securities transferred to HTM from AFS, adjusted amortized cost basis is defined as the original purchase cost, adjusted for the cumulative accretion or amortization of any purchase discount or premium, plus or minus any cumulative fair value hedge adjustments, net of accretion or amortization, and less any other-than-temporary impairment recognized in earnings.
|
|
|
(2) |
HTM securities are carried on the Consolidated Balance Sheet at adjusted amortized cost basis, plus or minus any unamortized unrealized gains and losses and fair value hedge adjustments recognized in AOCI prior to reclassifying the securities from AFS to HTM. Changes in the values of these securities are not reported in the financial statements, except for the amortization of any difference between the carrying value at the transfer date and par value of the securities, and the recognition of any non-credit fair value adjustments in AOCI in connection with the recognition of any credit impairment in earnings related to securities the Company continues to intend to hold until maturity. |
|
|
(3) |
The Company invests in mortgage-backed and asset-backed securities. These securitizations are generally considered VIEs. The Company’s maximum exposure to loss from these VIEs is equal to the carrying amount of the securities, which is reflected in the table above. For mortgage-backed and asset-backed securitizations in which the Company has other involvement, see Note 21 to the Consolidated Financial Statements.
|
|
|
(4) |
In the second quarter of 2017, Citi early adopted ASU 2017-08. Upon adoption, a cumulative effect adjustment was recorded to reduce retained earnings, effective January 1, 2017, for the incremental amortization of purchase premiums and cumulative fair value hedge adjustments that would have been recorded under the ASU on callable state and municipal debt securities. See Note 1 to the Consolidated Financial Statements.
|
|
|
(5) |
During the fourth quarter of 2016, securities with a total fair value of approximately $5.8 billion were transferred from AFS to HTM, composed of $5 billion of U.S. government agency mortgage-backed securities and $830 million of municipal securities. The transfer reflects the Company’s intent to hold these securities to maturity or to issuer call, in part, in order to reduce the impact of price volatility on AOCI and certain capital measures under Basel III. While these securities were transferred to HTM at fair value as of the transfer date, no subsequent changes in value may be recorded, other than in connection with the recognition of any subsequent other-than-temporary impairment and the amortization of differences between the carrying values at the transfer date and the par values of each security as an adjustment of yield. Any net unrealized holding losses within AOCI related to the respective securities at the date of transfer, inclusive of any cumulative fair value hedge adjustments, will be amortized as an adjustment of yield in a manner consistent with the amortization of any premium or discount.
|
The Company has the positive intent and ability to hold these securities to maturity or, where applicable, the exercise of any issuer call options, absent any unforeseen significant changes in circumstances, including deterioration in credit or changes in regulatory capital requirements.
The net unrealized losses classified in AOCI for HTM securities primarily relate to debt securities previously classified as AFS that were transferred to HTM, and include any cumulative fair
value hedge adjustments. The net unrealized loss amount also includes any non-credit-related changes in fair value of HTM securities that have suffered credit impairment recorded in earnings. The AOCI balance related to HTM securities is amortized as an adjustment of yield, in a manner consistent with the accretion of any difference between the carrying value at the transfer date and par value of the same debt securities.
The table below shows the fair value of debt securities HTM that have been in an unrecognized loss position:
|
|
|
|
|
|
|
|
|
|
|
|
|
|
|
|
|
|
|
|
|
Less than 12 months |
12 months or longer |
Total |
In millions of dollars |
Fair
value |
Gross
unrecognized
losses |
Fair
value |
Gross
unrecognized
losses |
Fair
value |
Gross
unrecognized
losses |
December 31, 2017 |
|
|
|
|
|
|
Debt securities held-to-maturity |
|
|
|
|
|
|
Mortgage-backed securities |
$ |
46 |
|
$ |
— |
|
$ |
15,096 |
|
$ |
157 |
|
$ |
15,142 |
|
$ |
157 |
|
State and municipal |
353 |
|
5 |
|
835 |
|
68 |
|
1,188 |
|
73 |
|
Foreign government |
723 |
|
18 |
|
— |
|
— |
|
723 |
|
18 |
|
Asset-backed securities |
71 |
|
3 |
|
134 |
|
19 |
|
205 |
|
22 |
|
Total debt securities held-to-maturity |
$ |
1,193 |
|
$ |
26 |
|
$ |
16,065 |
|
$ |
244 |
|
$ |
17,258 |
|
$ |
270 |
|
December 31, 2016 |
|
|
|
|
|
|
Debt securities held-to-maturity |
|
|
|
|
|
|
Mortgage-backed securities |
$ |
17 |
|
$ |
— |
|
$ |
17,176 |
|
$ |
188 |
|
$ |
17,193 |
|
$ |
188 |
|
State and municipal |
2,200 |
|
58 |
|
1,210 |
|
180 |
|
3,410 |
|
238 |
|
Foreign government |
1,313 |
|
26 |
|
— |
|
— |
|
1,313 |
|
26 |
|
Asset-backed securities |
2 |
|
— |
|
2,503 |
|
5 |
|
2,505 |
|
5 |
|
Total debt securities held-to-maturity |
$ |
3,532 |
|
$ |
84 |
|
$ |
20,889 |
|
$ |
373 |
|
$ |
24,421 |
|
$ |
457 |
|
Note: Excluded from the gross unrecognized losses presented in the above table are $(117) million and $(496) million of net unrealized losses recorded in AOCI as of December 31, 2017 and December 31, 2016, respectively, primarily related to the difference between the amortized cost and carrying value of HTM securities that were reclassified from AFS. Substantially all of these net unrecognized losses relate to securities that have been in a loss position for 12 months or longer at December 31, 2017 and December 31, 2016.
The following table presents the carrying value and fair value of HTM debt securities by contractual maturity dates:
|
|
|
|
|
|
|
|
|
|
|
|
|
|
|
December 31, |
|
2017 |
2016 |
In millions of dollars |
Carrying value |
Fair value |
Carrying value |
Fair value |
Mortgage-backed securities |
|
|
|
|
Due within 1 year |
$ |
— |
|
$ |
— |
|
$ |
— |
|
$ |
— |
|
After 1 but within 5 years |
720 |
|
720 |
|
760 |
|
766 |
|
After 5 but within 10 years |
148 |
|
149 |
|
54 |
|
55 |
|
After 10 years(1)
|
25,231 |
|
25,235 |
|
23,830 |
|
23,810 |
|
Total |
$ |
26,099 |
|
$ |
26,104 |
|
$ |
24,644 |
|
$ |
24,631 |
|
State and municipal |
|
|
|
|
Due within 1 year |
$ |
407 |
|
$ |
425 |
|
$ |
406 |
|
$ |
406 |
|
After 1 but within 5 years |
259 |
|
270 |
|
112 |
|
110 |
|
After 5 but within 10 years |
512 |
|
524 |
|
363 |
|
367 |
|
After 10 years(1)
|
7,719 |
|
7,983 |
|
7,702 |
|
7,591 |
|
Total |
$ |
8,897 |
|
$ |
9,202 |
|
$ |
8,583 |
|
$ |
8,474 |
|
Foreign government |
|
|
|
|
Due within 1 year |
$ |
381 |
|
$ |
381 |
|
$ |
824 |
|
$ |
818 |
|
After 1 but within 5 years |
359 |
|
341 |
|
515 |
|
495 |
|
After 5 but within 10 years |
— |
|
— |
|
— |
|
— |
|
After 10 years(1)
|
— |
|
— |
|
— |
|
— |
|
Total |
$ |
740 |
|
$ |
722 |
|
$ |
1,339 |
|
$ |
1,313 |
|
All other(2)
|
|
|
|
|
Due within 1 year |
$ |
— |
|
$ |
— |
|
$ |
— |
|
$ |
— |
|
After 1 but within 5 years |
— |
|
— |
|
— |
|
— |
|
After 5 but within 10 years |
1,669 |
|
1,680 |
|
513 |
|
514 |
|
After 10 years(1)
|
15,915 |
|
16,044 |
|
10,588 |
|
10,623 |
|
Total |
$ |
17,584 |
|
$ |
17,724 |
|
$ |
11,101 |
|
$ |
11,137 |
|
Total debt securities held-to-maturity |
$ |
53,320 |
|
$ |
53,752 |
|
$ |
45,667 |
|
$ |
45,555 |
|
|
|
(1) |
Investments with no stated maturities are included as contractual maturities of greater than 10 years. Actual maturities may differ due to call or prepayment rights. |
|
|
(2) |
Includes corporate and asset-backed securities. |
Evaluating Investments for Other-Than-Temporary Impairment (OTTI)
Overview
The Company conducts periodic reviews of all securities with unrealized losses to evaluate whether the impairment is other-than-temporary.
An unrealized loss exists when the current fair value of an individual security is less than its adjusted amortized cost basis. Unrealized losses that are determined to be temporary in nature are recorded, net of tax, in AOCI for AFS securities. Losses related to HTM securities generally are not recorded, as these investments are carried at adjusted amortized cost basis. However, for HTM securities with credit-related losses, the credit loss is recognized in earnings as OTTI and any difference between the cost basis adjusted for the OTTI and fair value is recognized in AOCI and amortized as an adjustment of yield over the remaining contractual life of the security.
Regardless of the classification of the securities as AFS or HTM, the Company assesses each position with an unrealized loss for OTTI. Factors considered in determining whether a loss is temporary include:
|
|
• |
the length of time and the extent to which fair value has been below cost; |
|
|
• |
the severity of the impairment; |
|
|
• |
the cause of the impairment and the financial condition and near-term prospects of the issuer; |
|
|
• |
activity in the market of the issuer that may indicate adverse credit conditions; and |
|
|
• |
the Company’s ability and intent to hold the investment for a period of time sufficient to allow for recovery of the amortized cost basis. |
The Company’s review for impairment generally entails:
|
|
• |
identification and evaluation of impaired investments; |
|
|
• |
analysis of individual investments that have fair values less than the amortized cost, including consideration of the length of time the investment has been in an unrealized loss position and the expected recovery period; |
|
|
• |
consideration of evidential matter, including an evaluation of factors or triggers that could cause individual investments to qualify as having other-than-temporary impairment and those that would not support other-than-temporary impairment; and |
|
|
• |
documentation of the results of these analyses, as required under business policies. |
Debt Securities
The entire difference between the adjusted amortized cost basis and fair value is recognized in earnings as OTTI for impaired debt securities that the Company has an intent to sell or for which the Company believes it will more-likely-than-not be required to sell prior to recovery of the adjusted amortized cost basis. However, for those securities that the Company does not intend to sell and is not likely to be required to sell, only the credit-related impairment is recognized in earnings and any non-credit-related impairment is recorded in AOCI.
For debt securities, credit impairment exists where the present value of cash flows management expects to receive is not sufficient to recover the entire amortized cost basis of a security.
Equity Securities
For equity securities, management considers the various factors described above, including its intent and ability to hold the equity security for a period of time sufficient for recovery or whether it is more-likely-than-not that the Company will be required to sell the security prior to recovery of its cost basis. Where management lacks that intent or ability, the security’s decline in fair value is deemed to be other-than-temporary and is recorded in earnings. AFS equity securities deemed to be other-than-temporarily impaired are written down to fair value, with the full difference between fair value and cost recognized in earnings.
Management also assesses equity method investments that have fair values that are less than their respective carrying values for OTTI. Fair value is measured as price multiplied by quantity if the investee has publicly listed securities. If the investee is not publicly listed, other methods are used (see Note 24 to the Consolidated Financial Statements).
For impaired equity method investments that Citi plans to sell prior to recovery of value or would likely be required to sell with no expectation that the fair value will recover prior to the expected sale date, the full impairment is recognized in earnings as OTTI regardless of severity and duration. The measurement of the OTTI does not include partial projected recoveries subsequent to the balance sheet date.
For impaired equity method investments that management does not plan to sell and is not likely to be required to sell prior to recovery of value, the evaluation of whether an impairment is other-than-temporary is based on (i) whether and when an equity method investment will recover in value and (ii) whether the investor has the intent and ability to hold that investment for a period of time sufficient to recover the value. The determination of whether the impairment is considered other-than-temporary considers the following indicators, regardless of the time and extent of impairment:
|
|
• |
the cause of the impairment and the financial condition and near-term prospects of the issuer, including any specific events that may influence the operations of the issuer; |
|
|
• |
the intent and ability to hold the investment for a period of time sufficient to allow for any anticipated recovery in market value; and |
|
|
• |
the length of time and extent to which fair value has been less than the carrying value. |
The sections below describe the Company’s process for identifying credit-related impairments for security types that have the most significant unrealized losses as of December 31, 2017.
Mortgage-Backed Securities
For U.S. mortgage-backed securities, credit impairment is assessed using a cash flow model that estimates the principal and interest cash flows on the underlying mortgages using the security-specific collateral and transaction structure. The model distributes the estimated cash flows to the various tranches of securities, considering the transaction structure and any subordination and credit enhancements that exist in that structure. The cash flow model incorporates actual cash flows on the mortgage-backed securities through the current period and then estimates the remaining cash flows using a number of assumptions, including default rates, prepayment rates, recovery rates (on foreclosed properties) and loss severity rates (on non-agency mortgage-backed securities).
Management develops specific assumptions using market data, internal estimates and estimates published by rating agencies and other third-party sources. Default rates are projected by considering current underlying mortgage loan performance, generally assuming the default of (i) 10% of current loans, (ii) 25% of 30–59 day delinquent loans, (iii) 70% of 60–90 day delinquent loans and (iv) 100% of 91+ day delinquent loans. These estimates are extrapolated along a default timing curve to estimate the total lifetime pool default
rate. Other assumptions contemplate the actual collateral attributes, including geographic concentrations, rating actions and current market prices.
Cash flow projections are developed using different stress test scenarios. Management evaluates the results of those stress tests (including the severity of any cash shortfall indicated and the likelihood of the stress scenarios actually occurring based on the underlying pool’s characteristics and performance) to assess whether management expects to recover the amortized cost basis of the security. If cash flow projections indicate that the Company does not expect to recover its amortized cost basis, the Company recognizes the estimated credit loss in earnings.
State and Municipal Securities
The process for identifying credit impairments in Citigroup’s AFS and HTM state and municipal bonds is primarily based on a credit analysis that incorporates third-party credit ratings. Citigroup monitors the bond issuers and any insurers providing default protection in the form of financial guarantee insurance. The average external credit rating, ignoring any insurance, is Aa3/AA-. In the event of an external rating downgrade or other indicator of credit impairment (i.e., based on instrument-specific estimates of cash flows or probability of issuer default), the subject bond is specifically reviewed for adverse changes in the amount or timing of expected contractual principal and interest payments.
For state and municipal bonds with unrealized losses that Citigroup plans to sell or would be more-likely-than-not required to sell (for AFS only) or that will be subject to an issuer call deemed probable of exercise prior to the expected recovery of its amortized cost basis (for AFS and HTM), the full impairment is recognized in earnings as OTTI.
Recognition and Measurement of OTTI
The following tables present total OTTI recognized in earnings:
|
|
|
|
|
|
|
|
|
|
|
|
|
|
OTTI on Investments and Other Assets |
Year ended
December 31, 2017 |
In millions of dollars |
AFS(1)
|
HTM |
Other
assets
|
Total |
Impairment losses related to securities that the Company does not intend to sell nor will likely be required to sell: |
|
|
|
|
Total OTTI losses recognized during the period |
$ |
2 |
|
$ |
— |
|
$ |
— |
|
$ |
2 |
|
Less: portion of impairment loss recognized in AOCI (before taxes) |
— |
|
— |
|
— |
|
— |
|
Net impairment losses recognized in earnings for securities that the Company does not intend to sell nor will likely be required to sell |
$ |
2 |
|
$ |
— |
|
$ |
— |
|
$ |
2 |
|
Impairment losses recognized in earnings for securities that the Company intends to sell, would be more-likely-than-not required to sell or will be subject to an issuer call deemed probable of exercise |
59 |
|
2 |
|
— |
|
61 |
|
Total impairment losses recognized in earnings |
$ |
61 |
|
$ |
2 |
|
$ |
— |
|
$ |
63 |
|
|
|
(1) |
Includes OTTI on non-marketable equity securities. |
|
|
|
|
|
|
|
|
|
|
|
|
|
|
OTTI on Investments and Other Assets |
Year ended
December 31, 2016 |
In millions of dollars |
AFS(1)(2)
|
HTM |
Other
assets (3)
|
Total |
Impairment losses related to securities that the Company does not intend to sell nor will likely be required to sell: |
|
|
|
|
Total OTTI losses recognized during the period |
$ |
3 |
|
$ |
1 |
|
$ |
— |
|
$ |
4 |
|
Less: portion of impairment loss recognized in AOCI (before taxes) |
— |
|
— |
|
— |
|
— |
|
Net impairment losses recognized in earnings for securities that the Company does not intend to sell nor will likely be required to sell |
$ |
3 |
|
$ |
1 |
|
$ |
— |
|
$ |
4 |
|
Impairment losses recognized in earnings for securities that the Company intends to sell, would be more-likely-than-not required to sell or will be subject to an issuer call deemed probable of exercise |
246 |
|
38 |
|
332 |
|
616 |
|
Total impairment losses recognized in earnings |
$ |
249 |
|
$ |
39 |
|
$ |
332 |
|
$ |
620 |
|
|
|
(1) |
Includes OTTI on non-marketable equity securities. |
|
|
(2) |
Includes a $160 million impairment related to AFS securities affected by changes in the Venezuela exchange rate during the year ended December 31, 2016.
|
|
|
(3) |
The impairment charge is related to the carrying value of an equity investment, which was sold in 2016. |
|
|
|
|
|
|
|
|
|
|
|
|
|
|
OTTI on Investments and Other Assets |
Year ended
December 31, 2015
|
In millions of dollars |
AFS(1)
|
HTM |
Other
assets |
Total |
Impairment losses related to securities that the Company does not intend to sell nor will likely be required to sell: |
|
|
|
|
Total OTTI losses recognized during the period |
$ |
33 |
|
$ |
1 |
|
$ |
— |
|
$ |
34 |
|
Less: portion of impairment loss recognized in AOCI (before taxes) |
— |
|
— |
|
— |
|
— |
|
Net impairment losses recognized in earnings for securities that the Company does not intend to sell nor will likely be required to sell |
$ |
33 |
|
$ |
1 |
|
$ |
— |
|
$ |
34 |
|
Impairment losses recognized in earnings for securities that the Company intends to sell or more-likely-than-not will be required to sell before recovery |
182 |
|
43 |
|
6 |
|
231 |
|
Total impairment losses recognized in earnings |
$ |
215 |
|
$ |
44 |
|
$ |
6 |
|
$ |
265 |
|
|
|
(1) |
Includes OTTI on non-marketable equity securities. |
The following are 12-month rollforwards of the credit-related impairments recognized in earnings for AFS and HTM debt securities held that the Company does not intend to sell nor likely will be required to sell:
|
|
|
|
|
|
|
|
|
|
|
|
|
|
|
|
|
|
Cumulative OTTI credit losses recognized in earnings on securities still held |
In millions of dollars |
Dec. 31, 2016 balance |
|
Credit
impairments
recognized in
earnings on
securities not
previously
impaired |
|
Credit
impairments
recognized in
earnings on
securities that
have
been previously
impaired |
|
Reductions due to
credit-impaired
securities sold,
transferred or
matured(1)
|
|
Dec. 31, 2017 balance |
|
AFS debt securities |
|
|
|
|
|
Mortgage-backed securities(1)(2)
|
$ |
— |
|
$ |
— |
|
$ |
— |
|
$ |
38 |
|
$ |
38 |
|
State and municipal |
4 |
|
— |
|
— |
|
— |
|
4 |
|
Foreign government securities |
— |
|
— |
|
— |
|
— |
|
— |
|
Corporate |
5 |
|
— |
|
— |
|
(1 |
) |
4 |
|
All other debt securities |
22 |
|
— |
|
2 |
|
(22 |
) |
2 |
|
Total OTTI credit losses recognized for AFS debt securities |
$ |
31 |
|
$ |
— |
|
$ |
2 |
|
$ |
15 |
|
$ |
48 |
|
HTM debt securities |
|
|
|
|
|
Mortgage-backed securities(1)(3)
|
$ |
101 |
|
$ |
— |
|
$ |
— |
|
$ |
(47 |
) |
$ |
54 |
|
State and municipal |
3 |
|
— |
|
— |
|
— |
|
3 |
|
Total OTTI credit losses recognized for HTM debt securities |
$ |
104 |
|
$ |
— |
|
$ |
— |
|
$ |
(47 |
) |
$ |
57 |
|
(1) Includes $38 million in cumulative OTTI reclassified from HTM to AFS due to the transfer of the related securities from HTM to AFS.
(2) Primarily consists of Prime securities.
(3) Primarily consists of Alt-A securities.
|
|
|
|
|
|
|
|
|
|
|
|
|
|
|
|
|
|
Cumulative OTTI credit losses recognized in earnings on securities still held |
In millions of dollars |
Dec. 31, 2015 balance |
|
Credit
impairments
recognized in
earnings on
securities not
previously
impaired |
|
Credit
impairments
recognized in
earnings on
securities that
have
been previously
impaired |
|
Reductions due to
credit-impaired
securities sold,
transferred or
matured |
|
Dec. 31, 2016 balance |
|
AFS debt securities |
|
|
|
|
|
Mortgage-backed securities |
$ |
— |
|
$ |
1 |
|
$ |
— |
|
$ |
(1 |
) |
$ |
— |
|
State and municipal |
12 |
|
— |
|
— |
|
(8 |
) |
4 |
|
Foreign government securities |
5 |
|
— |
|
— |
|
(5 |
) |
— |
|
Corporate |
9 |
|
1 |
|
1 |
|
(6 |
) |
5 |
|
All other debt securities |
47 |
|
— |
|
— |
|
(25 |
) |
22 |
|
Total OTTI credit losses recognized for AFS debt securities |
$ |
73 |
|
$ |
2 |
|
$ |
1 |
|
$ |
(45 |
) |
$ |
31 |
|
HTM debt securities |
|
|
|
|
|
Mortgage-backed securities(1)
|
$ |
132 |
|
$ |
— |
|
$ |
— |
|
$ |
(31 |
) |
$ |
101 |
|
|
State and municipal
|
4 |
|
1 |
|
— |
|
(2 |
) |
3 |
|
Total OTTI credit losses recognized for HTM debt securities |
$ |
136 |
|
$ |
1 |
|
$ |
— |
|
$ |
(33 |
) |
$ |
104 |
|
|
|
(1) |
Primarily consists of Alt-A securities. |
Investments in Alternative Investment Funds That Calculate Net Asset Value
The Company holds investments in certain alternative investment funds that calculate net asset value (NAV) or its equivalent, including hedge funds, private equity funds, funds of funds and real estate funds, as provided by third-party asset managers. Investments in such funds are generally classified as non-marketable equity securities carried at fair value. The fair values of these investments are estimated using the NAV of the Company’s ownership interest in the funds. Some of these investments are in “covered funds” for purposes of the
Volcker Rule, which prohibits certain proprietary investment activities and limits the ownership of, and relationships with, covered funds. On April 21, 2017, Citi’s request for extension of the permitted holding period under the Volcker Rule for certain of its investments in illiquid funds was approved. This allows the Company to hold such investments until the earlier of 5 years from the July 21, 2017 (expiration date of the general conformance period), or the date such investments mature or are otherwise conformed with the Volcker Rule.
|
|
|
|
|
|
|
|
|
|
|
|
|
|
|
|
|
Fair value |
Unfunded
commitments |
Redemption frequency
(if currently eligible)
monthly, quarterly, annually
|
Redemption
notice
period
|
In millions of dollars |
December 31, 2017 |
December 31, 2016 |
December 31, 2017 |
December 31, 2016 |
|
|
Hedge funds |
$ |
1 |
|
$ |
4 |
|
$ |
— |
|
$ |
— |
|
Generally quarterly |
10–95 days |
Private equity funds(1)(2)
|
372 |
|
348 |
|
62 |
|
82 |
|
— |
— |
Real estate funds(2)(3)
|
31 |
|
56 |
|
20 |
|
20 |
|
— |
— |
Total |
$ |
404 |
|
$ |
408 |
|
$ |
82 |
|
$ |
102 |
|
— |
— |
|
|
(1) |
Private equity funds include funds that invest in infrastructure, emerging markets and venture capital. |
|
|
(2) |
With respect to the Company’s investments in private equity funds and real estate funds, distributions from each fund will be received as the underlying assets held by these funds are liquidated. It is estimated that the underlying assets of these funds will be liquidated over a period of several years as market conditions allow. Private equity and real estate funds do not allow redemption of investments by their investors. Investors are permitted to sell or transfer their investments, subject to the approval of the general partner or investment manager of these funds, which generally may not be unreasonably withheld. |
|
|
(3) |
Includes several real estate funds that invest primarily in commercial real estate in the U.S., Europe and Asia. |
14. LOANS
Citigroup loans are reported in two categories—consumer and corporate. These categories are classified primarily according to the segment and subsegment that manage the loans.
Consumer Loans
Consumer loans represent loans and leases managed primarily by GCB and Corporate/Other. The following table provides Citi’s consumer loans by loan type:
|
|
|
|
|
|
|
|
|
December 31, |
In millions of dollars |
2017 |
2016 |
In U.S. offices |
|
|
Mortgage and real estate(1)
|
$ |
65,467 |
|
$ |
72,957 |
|
Installment, revolving credit and other |
3,398 |
|
3,395 |
|
Cards |
139,006 |
|
132,654 |
|
Commercial and industrial |
7,840 |
|
7,159 |
|
|
$ |
215,711 |
|
$ |
216,165 |
|
In offices outside the U.S. |
|
|
Mortgage and real estate(1)
|
$ |
44,081 |
|
$ |
42,803 |
|
Installment, revolving credit and other |
26,556 |
|
24,887 |
|
Cards |
26,257 |
|
23,783 |
|
Commercial and industrial |
20,238 |
|
16,568 |
|
Lease financing |
76 |
|
81 |
|
|
$ |
117,208 |
|
$ |
108,122 |
|
Total consumer loans |
$ |
332,919 |
|
$ |
324,287 |
|
Net unearned income |
$ |
737 |
|
$ |
776 |
|
Consumer loans, net of unearned income |
$ |
333,656 |
|
$ |
325,063 |
|
|
|
(1)
|
Loans secured primarily by real estate. |
Citigroup has established a risk management process to monitor, evaluate and manage the principal risks associated with its consumer loan portfolio. Credit quality indicators that are actively monitored include delinquency status, consumer credit scores (FICO) and loan to value (LTV) ratios, each as discussed in more detail below.
Included in the loan table above are lending products whose terms may give rise to greater credit issues. Credit cards with below-market introductory interest rates and interest-only loans are examples of such products. These products are closely managed using credit techniques that are intended to mitigate their higher inherent risk.
During the years ended December 31, 2017 and 2016, the Company sold and/or reclassified to held-for-sale, $4.9 billion and $9.7 billion, respectively, of consumer loans.
Delinquency Status
Delinquency status is monitored and considered a key indicator of credit quality of consumer loans. Principally, the U.S. residential first mortgage loans use the Mortgage Bankers Association (MBA) method of reporting delinquencies, which considers a loan delinquent if a monthly payment has not been received by the end of the day immediately preceding the loan’s next due date. All other loans use a method of reporting delinquencies that considers a loan delinquent if a monthly payment has not been received by the close of business on the loan’s next due date.
As a general policy, residential first mortgages, home equity loans and installment loans are classified as non-accrual when loan payments are 90 days contractually past due. Credit cards and unsecured revolving loans generally accrue interest until payments are 180 days past due. Home equity loans in regulated bank entities are classified as non-accrual if the related residential first mortgage is 90 days or more past due. Mortgage loans, other than Federal Housing Administration (FHA)-insured loans, are classified as non-accrual within 60 days of notification that the borrower has filed for bankruptcy. Commercial market loans are placed on a cash (non-accrual) basis when it is determined, based on actual experience and a forward-looking assessment of the collectability of the loan in full, that the payment of interest or principal is doubtful or when interest or principal is 90 days past due.
The policy for re-aging modified U.S. consumer loans to current status varies by product. Generally, one of the conditions to qualify for these modifications is that a minimum number of payments (typically ranging from one to three) be made. Upon modification, the loan is re-aged to current status. However, re-aging practices for certain open-ended consumer loans, such as credit cards, are governed by Federal Financial Institutions Examination Council (FFIEC) guidelines. For open-ended consumer loans subject to FFIEC guidelines, one of the conditions for a loan to be re-aged to current status is that at least three consecutive minimum monthly payments, or the equivalent amount, must be received. In addition, under FFIEC guidelines, the number of times that such a loan can be re-aged is subject to limitations (generally once in 12 months and twice in five years). Furthermore, FHA and Department of Veterans Affairs (VA) loans are modified under those respective agencies’ guidelines and payments are not always required in order to re-age a modified loan to current.
Consumer Loan Delinquency and Non-Accrual Details at December 31, 2017
|
|
|
|
|
|
|
|
|
|
|
|
|
|
|
|
|
|
|
|
|
|
|
In millions of dollars |
Total
current(1)(2)
|
30–89 days
past due(3)
|
≥ 90 days
past due(3)
|
Past due
government
guaranteed(4)
|
Total
loans(2)
|
Total
non-accrual
|
90 days past due
and accruing
|
In North America offices |
|
|
|
|
|
|
|
Residential first mortgages(5)
|
$ |
47,366 |
|
$ |
505 |
|
$ |
280 |
|
$ |
1,225 |
|
$ |
49,376 |
|
$ |
665 |
|
$ |
941 |
|
Home equity loans(6)(7)
|
14,268 |
|
207 |
|
352 |
|
— |
|
14,827 |
|
750 |
|
— |
|
Credit cards |
136,588 |
|
1,528 |
|
1,613 |
|
— |
|
139,729 |
|
— |
|
1,596 |
|
Installment and other |
3,395 |
|
45 |
|
16 |
|
— |
|
3,456 |
|
22 |
|
1 |
|
Commercial market loans |
9,395 |
|
51 |
|
65 |
|
— |
|
9,511 |
|
213 |
|
15 |
|
Total |
$ |
211,012 |
|
$ |
2,336 |
|
$ |
2,326 |
|
$ |
1,225 |
|
$ |
216,899 |
|
$ |
1,650 |
|
$ |
2,553 |
|
In offices outside North America |
|
|
|
|
|
|
|
Residential first mortgages(5)
|
$ |
37,062 |
|
$ |
209 |
|
$ |
148 |
|
$ |
— |
|
$ |
37,419 |
|
$ |
400 |
|
$ |
— |
|
Credit cards |
24,934 |
|
427 |
|
366 |
|
— |
|
25,727 |
|
323 |
|
259 |
|
Installment and other |
25,634 |
|
275 |
|
123 |
|
— |
|
26,032 |
|
157 |
|
— |
|
Commercial market loans |
27,449 |
|
57 |
|
72 |
|
— |
|
27,578 |
|
160 |
|
— |
|
Total |
$ |
115,079 |
|
$ |
968 |
|
$ |
709 |
|
$ |
— |
|
$ |
116,756 |
|
$ |
1,040 |
|
$ |
259 |
|
Total GCB and Corporate/Other—consumer
|
$ |
326,091 |
|
$ |
3,304 |
|
$ |
3,035 |
|
$ |
1,225 |
|
$ |
333,655 |
|
$ |
2,690 |
|
$ |
2,812 |
|
Other(8)
|
1 |
|
— |
|
— |
|
— |
|
1 |
|
— |
|
— |
|
Total Citigroup |
$ |
326,092 |
|
$ |
3,304 |
|
$ |
3,035 |
|
$ |
1,225 |
|
$ |
333,656 |
|
$ |
2,690 |
|
$ |
2,812 |
|
|
|
(1) |
Loans less than 30 days past due are presented as current.
|
|
|
(2) |
Includes $25 million of residential first mortgages recorded at fair value.
|
|
|
(3) |
Excludes loans guaranteed by U.S. government-sponsored entities. |
|
|
(4) |
Consists of residential first mortgages that are guaranteed by U.S. government-sponsored entities that are 30–89 days past due of $0.2 billion and 90 days or more past due of $1.0 billion.
|
|
|
(5) |
Includes approximately $0.1 billion of residential first mortgage loans in process of foreclosure.
|
|
|
(6) |
Includes approximately $0.1 billion of home equity loans in process of foreclosure.
|
|
|
(7) |
Fixed-rate home equity loans and loans extended under home equity lines of credit, which are typically in junior lien positions. |
|
|
(8) |
Represents loans classified as consumer loans on the Consolidated Balance Sheet that are not included in GCB or Corporate/Other consumer credit metrics.
|
Consumer Loan Delinquency and Non-Accrual Details at December 31, 2016
|
|
|
|
|
|
|
|
|
|
|
|
|
|
|
|
|
|
|
|
|
|
|
In millions of dollars |
Total
current(1)(2)
|
30–89 days
past due(3)
|
≥ 90 days
past due(3)
|
Past due
government
guaranteed(4)
|
Total
loans(2)
|
Total
non-accrual
|
90 days past due
and accruing
|
In North America offices |
|
|
|
|
|
|
|
Residential first mortgages(5)
|
$ |
50,766 |
|
$ |
522 |
|
$ |
371 |
|
$ |
1,474 |
|
$ |
53,133 |
|
$ |
848 |
|
$ |
1,227 |
|
Home equity loans(6)(7)
|
18,767 |
|
249 |
|
438 |
|
— |
|
19,454 |
|
914 |
|
— |
|
Credit cards |
130,327 |
|
1,465 |
|
1,509 |
|
— |
|
133,301 |
|
— |
|
1,509 |
|
Installment and other |
4,486 |
|
106 |
|
38 |
|
— |
|
4,630 |
|
70 |
|
2 |
|
Commercial market loans |
8,876 |
|
23 |
|
74 |
|
— |
|
8,973 |
|
328 |
|
14 |
|
Total |
$ |
213,222 |
|
$ |
2,365 |
|
$ |
2,430 |
|
$ |
1,474 |
|
$ |
219,491 |
|
$ |
2,160 |
|
$ |
2,752 |
|
In offices outside North America |
|
|
|
|
|
|
|
Residential first mortgages(5)
|
$ |
35,862 |
|
$ |
206 |
|
$ |
135 |
|
$ |
— |
|
$ |
36,203 |
|
$ |
360 |
|
$ |
— |
|
Credit cards |
22,363 |
|
368 |
|
324 |
|
— |
|
23,055 |
|
258 |
|
239 |
|
Installment and other |
22,683 |
|
264 |
|
126 |
|
— |
|
23,073 |
|
163 |
|
— |
|
Commercial market loans |
23,054 |
|
72 |
|
112 |
|
— |
|
23,238 |
|
217 |
|
— |
|
Total |
$ |
103,962 |
|
$ |
910 |
|
$ |
697 |
|
$ |
— |
|
$ |
105,569 |
|
$ |
998 |
|
$ |
239 |
|
Total GCB and Corporate/Other—consumer
|
$ |
317,184 |
|
$ |
3,275 |
|
$ |
3,127 |
|
$ |
1,474 |
|
$ |
325,060 |
|
$ |
3,158 |
|
$ |
2,991 |
|
Other(9)
|
3 |
|
— |
|
— |
|
— |
|
3 |
|
— |
|
— |
|
Total Citigroup |
$ |
317,187 |
|
$ |
3,275 |
|
$ |
3,127 |
|
$ |
1,474 |
|
$ |
325,063 |
|
$ |
3,158 |
|
$ |
2,991 |
|
|
|
(1) |
Loans less than 30 days past due are presented as current.
|
|
|
(2) |
Includes $29 million of residential first mortgages recorded at fair value.
|
|
|
(3) |
Excludes loans guaranteed by U.S. government-sponsored entities. |
|
|
(4) |
Consists of residential first mortgages that are guaranteed by U.S. government-sponsored entities that are 30–89 days past due of $0.2 billion and 90 days or more past due of $1.3 billion.
|
|
|
(5) |
Includes approximately $0.1 billion of residential first mortgage loans in process of foreclosure.
|
|
|
(6) |
Includes approximately $0.1 billion of home equity loans in process of foreclosure.
|
|
|
(7) |
Fixed-rate home equity loans and loans extended under home equity lines of credit, which are typically in junior lien positions. |
|
|
(8) |
Represents loans classified as consumer loans on the Consolidated Balance Sheet that are not included in the Corporate/Other consumer credit metrics.
|
Consumer Credit Scores (FICO)
In the U.S., independent credit agencies rate an individual’s risk for assuming debt based on the individual’s credit history and assign every consumer a “FICO” (Fair Isaac Corporation) credit score. These scores are continually updated by the agencies based upon an individual’s credit actions (e.g., taking out a loan or missed or late payments).
The following tables provide details on the FICO scores for Citi’s U.S. consumer loan portfolio based on end-of-period receivables (commercial market loans are excluded from the table since they are business based and FICO scores are not a primary driver in their credit evaluation). FICO scores are updated monthly for substantially all of the portfolio or, otherwise, on a quarterly basis for the remaining portfolio.
|
|
|
|
|
|
|
|
|
|
|
FICO score distribution in U.S. portfolio(1)(2)
|
December 31, 2017 |
In millions of dollars |
Less than
620
|
≥ 620 but less
than 660
|
Equal to or
greater
than 660 |
Residential first mortgages |
$ |
2,100 |
|
$ |
1,932 |
|
$ |
42,265 |
|
Home equity loans |
1,379 |
|
1,081 |
|
11,976 |
|
Credit cards |
9,079 |
|
11,651 |
|
115,577 |
|
Installment and other |
276 |
|
250 |
|
2,485 |
|
Total |
$ |
12,834 |
|
$ |
14,914 |
|
$ |
172,303 |
|
|
|
|
|
|
|
|
|
|
|
|
FICO score distribution in U.S. portfolio(1)(2)
|
December 31, 2016 |
|
In millions of dollars
|
Less than
620
|
≥ 620 but less
than 660
|
Equal to or
greater
than 660
|
Residential first mortgages |
$ |
2,744 |
|
$ |
2,422 |
|
$ |
44,279 |
|
Home equity loans |
1,750 |
|
1,418 |
|
14,743 |
|
Credit cards |
8,310 |
|
11,320 |
|
110,522 |
|
Installment and other |
284 |
|
271 |
|
2,601 |
|
Total |
$ |
13,088 |
|
$ |
15,431 |
|
$ |
172,145 |
|
|
|
(1) |
Excludes loans guaranteed by U.S. government entities, loans subject to long-term standby commitments (LTSCs) with U.S. government-sponsored entities and loans recorded at fair value. |
|
|
(2) |
Excludes balances where FICO was not available. Such amounts are not material. |
Loan to Value (LTV) Ratios
LTV ratios (loan balance divided by appraised value) are calculated at origination and updated by applying market price data.
The following tables provide details on the LTV ratios for Citi’s U.S. consumer mortgage portfolios. LTV ratios are updated monthly using the most recent Core Logic Home Price Index data available for substantially all of the portfolio applied at the Metropolitan Statistical Area level, if available, or the state level if not. The remainder of the portfolio is updated in a similar manner using the Federal Housing Finance Agency indices.
|
|
|
|
|
|
|
|
|
|
|
LTV distribution in U.S. portfolio(1)(2)
|
December 31, 2017 |
In millions of dollars |
Less than or
equal to 80%
|
> 80% but less
than or equal to
100%
|
Greater
than
100%
|
Residential first mortgages |
$ |
43,626 |
|
$ |
2,578 |
|
$ |
247 |
|
Home equity loans |
11,403 |
|
2,147 |
|
800 |
|
Total |
$ |
55,029 |
|
$ |
4,725 |
|
$ |
1,047 |
|
|
|
|
|
|
|
|
|
|
|
|
LTV distribution in U.S. portfolio(1)(2)
|
December 31, 2016 |
In millions of dollars |
Less than or
equal to 80%
|
> 80% but less
than or equal to
100%
|
Greater
than
100%
|
Residential first mortgages |
$ |
45,849 |
|
$ |
3,467 |
|
$ |
324 |
|
Home equity loans |
12,869 |
|
3,653 |
|
1,305 |
|
Total |
$ |
58,718 |
|
$ |
7,120 |
|
$ |
1,629 |
|
|
|
(1) |
Excludes loans guaranteed by U.S. government entities, loans subject to LTSCs with U.S. government-sponsored entities and loans recorded at fair value. |
|
|
(2) |
Excludes balances where LTV was not available. Such amounts are not material. |
Impaired Consumer Loans
A loan is considered impaired when Citi believes it is probable that all amounts due according to the original contractual terms of the loan will not be collected. Impaired consumer loans include non-accrual commercial market loans, as well as smaller-balance homogeneous loans whose terms have been modified due to the borrower’s financial difficulties and where Citi has granted a concession to the borrower. These modifications may include interest rate reductions and/or principal forgiveness. Impaired consumer loans exclude smaller-balance homogeneous loans that have not been modified and are carried on a non-accrual basis.
The following tables present information about impaired consumer loans and interest income recognized on impaired consumer loans:
|
|
|
|
|
|
|
|
|
|
|
|
|
|
|
|
|
|
At and for the year ended December 31, 2017 |
In millions of dollars |
Recorded
investment(1)(2)
|
Unpaid
principal balance
|
Related
specific allowance(3)
|
Average
carrying value(4)
|
Interest income
recognized(5)
|
Mortgage and real estate |
|
|
|
|
|
Residential first mortgages |
$ |
2,877 |
|
$ |
3,121 |
|
$ |
278 |
|
$ |
3,155 |
|
$ |
119 |
|
Home equity loans |
1,151 |
|
1,590 |
|
216 |
|
1,181 |
|
28 |
|
Credit cards |
1,787 |
|
1,819 |
|
614 |
|
1,803 |
|
150 |
|
Installment and other |
|
|
|
|
|
Individual installment and other |
431 |
|
460 |
|
175 |
|
415 |
|
25 |
|
Commercial market loans |
334 |
|
541 |
|
51 |
|
429 |
|
20 |
|
Total |
$ |
6,580 |
|
$ |
7,531 |
|
$ |
1,334 |
|
$ |
6,983 |
|
$ |
342 |
|
|
|
(1) |
Recorded investment in a loan includes net deferred loan fees and costs, unamortized premium or discount and direct write-downs and includes accrued interest only on credit card loans. |
|
|
(2) |
$607 million of residential first mortgages, $370 million of home equity loans and $10 million of commercial market loans do not have a specific allowance.
|
(3) Included in the Allowance for loan losses.
(4) Average carrying value represents the average recorded investment ending balance for the last four quarters and does not include the related specific allowance.
(5) Includes amounts recognized on both an accrual and cash basis.
|
|
|
|
|
|
|
|
|
|
|
|
|
|
|
|
|
|
At and for the year ended December 31, 2016 |
In millions of dollars |
Recorded
investment(1)(2)
|
Unpaid
principal balance
|
Related
specific allowance(3)
|
Average
carrying
value(4)
|
Interest income
recognized(5)(6)
|
Mortgage and real estate |
|
|
|
|
|
Residential first mortgages |
$ |
3,786 |
|
$ |
4,157 |
|
$ |
540 |
|
$ |
4,632 |
|
$ |
170 |
|
Home equity loans |
1,298 |
|
1,824 |
|
189 |
|
1,326 |
|
35 |
|
Credit cards |
1,747 |
|
1,781 |
|
566 |
|
1,831 |
|
158 |
|
Installment and other |
|
|
|
|
|
Individual installment and other |
455 |
|
481 |
|
215 |
|
475 |
|
27 |
|
Commercial market loans |
513 |
|
744 |
|
98 |
|
538 |
|
12 |
|
Total |
$ |
7,799 |
|
$ |
8,987 |
|
$ |
1,608 |
|
$ |
8,802 |
|
$ |
402 |
|
|
|
(1) |
Recorded investment in a loan includes net deferred loan fees and costs, unamortized premium or discount and direct write-downs and includes accrued interest only on credit card loans. |
|
|
(2) |
$740 million of residential first mortgages, $406 million of home equity loans and $97 million of commercial market loans do not have a specific allowance.
|
|
|
(3) |
Included in the Allowance for loan losses.
|
|
|
(4) |
Average carrying value represents the average recorded investment ending balance for the last four quarters and does not include the related specific allowance.
|
(5) Includes amounts recognized on both an accrual and cash basis.
(6) Interest income recognized for the year ended December 31, 2015 was $728 million.
Consumer Troubled Debt Restructurings
|
|
|
|
|
|
|
|
|
|
|
|
|
|
|
|
|
|
|
At and for the year ended December 31, 2017 |
In millions of dollars except number of loans modified |
Number of
loans modified
|
Post-
modification
recorded
investment(1)(2)
|
Deferred
principal(3)
|
Contingent
principal
forgiveness(4)
|
Principal
forgiveness(5)
|
Average
interest rate
reduction
|
North America |
|
|
|
|
|
|
Residential first mortgages |
4,063 |
|
$ |
580 |
|
$ |
6 |
|
$ |
— |
|
$ |
2 |
|
1 |
% |
Home equity loans |
2,807 |
|
247 |
|
16 |
|
— |
|
1 |
|
1 |
|
Credit cards |
230,042 |
|
880 |
|
— |
|
— |
|
— |
|
17 |
|
Installment and other revolving |
1,088 |
|
8 |
|
— |
|
— |
|
— |
|
5 |
|
Commercial banking(6)
|
112 |
|
117 |
|
— |
|
— |
|
— |
|
— |
|
Total(8)
|
238,112 |
|
$ |
1,832 |
|
$ |
22 |
|
$ |
— |
|
$ |
3 |
|
|
International |
|
|
|
|
|
|
Residential first mortgages |
4,477 |
|
$ |
123 |
|
$ |
— |
|
$ |
— |
|
$ |
— |
|
— |
% |
Credit cards |
115,941 |
|
399 |
|
— |
|
— |
|
7 |
|
11 |
|
Installment and other revolving |
44,880 |
|
254 |
|
— |
|
— |
|
11 |
|
9 |
|
Commercial banking(6)
|
370 |
|
50 |
|
— |
|
— |
|
— |
|
— |
|
Total(8)
|
165,668 |
|
$ |
826 |
|
$ |
— |
|
$ |
— |
|
$ |
18 |
|
|
|
|
|
|
|
|
|
|
|
|
|
|
|
|
|
|
|
|
|
|
At and for the year ended December 31, 2016 |
In millions of dollars except number of loans modified |
Number of
loans modified
|
Post-
modification
recorded
investment(1)(7)
|
Deferred
principal(3)
|
Contingent
principal
forgiveness(4)
|
Principal
forgiveness(5)
|
Average
interest rate
reduction
|
North America |
|
|
|
|
|
|
Residential first mortgages |
5,023 |
|
$ |
726 |
|
$ |
6 |
|
$ |
— |
|
$ |
3 |
|
1 |
% |
Home equity loans |
4,100 |
|
200 |
|
6 |
|
— |
|
1 |
|
2 |
|
Credit cards |
196,004 |
|
762 |
|
— |
|
— |
|
— |
|
17 |
|
Installment and other revolving |
5,649 |
|
47 |
|
— |
|
— |
|
— |
|
14 |
|
Commercial banking(6)
|
132 |
|
91 |
|
— |
|
— |
|
— |
|
— |
|
Total(8)
|
210,908 |
|
$ |
1,826 |
|
$ |
12 |
|
$ |
— |
|
$ |
4 |
|
|
International |
|
|
|
|
|
|
Residential first mortgages |
2,722 |
|
$ |
80 |
|
$ |
— |
|
$ |
— |
|
$ |
— |
|
— |
% |
Credit cards |
137,466 |
|
385 |
|
— |
|
— |
|
9 |
|
12 |
|
Installment and other revolving |
60,094 |
|
276 |
|
— |
|
— |
|
7 |
|
7 |
|
Commercial banking(6)
|
162 |
|
109 |
|
— |
|
— |
|
— |
|
— |
|
Total(8)
|
200,444 |
|
$ |
850 |
|
$ |
— |
|
$ |
— |
|
$ |
16 |
|
|
|
|
(1) |
Post-modification balances include past due amounts that are capitalized at the modification date. |
|
|
(2) |
Post-modification balances in North America include $53 million of residential first mortgages and $21 million of home equity loans to borrowers who have gone through Chapter 7 bankruptcy in the year ended December 31, 2017. These amounts include $36 million of residential first mortgages and $18 million of home equity loans that were newly classified as TDRs during 2017, based on previously received OCC guidance.
|
|
|
(3) |
Represents portion of contractual loan principal that is non-interest bearing, but still due from the borrower. Such deferred principal is charged off at the time of permanent modification to the extent that the related loan balance exceeds the underlying collateral value. |
|
|
(4) |
Represents portion of contractual loan principal that is non-interest bearing and, depending upon borrower performance, eligible for forgiveness. |
|
|
(5) |
Represents portion of contractual loan principal that was forgiven at the time of permanent modification. |
(6) Commercial banking loans are generally borrower-specific modifications and incorporate changes in the amount and/or timing of principal and/or interest.
(7) Post-modification balances in North America include $74 million of residential first mortgages and $22 million of home equity loans to borrowers who have gone through Chapter 7 bankruptcy in the year ended December 31, 2016. These amounts include $48 million of residential first mortgages and $20 million of home equity loans that were newly classified as TDRs during 2016, based on previously received OCC guidance.
(8) The above tables reflect activity for loans outstanding as of the end of the reporting period that were considered TDRs.
The following table presents consumer TDRs that defaulted, for which the payment default occurred within one year of a permanent modification. Default is defined as 60 days past due, except for classifiably managed commercial banking loans, where default is defined as 90 days past due.
|
|
|
|
|
|
|
|
In millions of dollars |
2017 |
2016 |
North America |
|
|
Residential first mortgages |
$ |
253 |
|
$ |
229 |
|
Home equity loans |
46 |
|
25 |
|
Credit cards |
221 |
|
188 |
|
Installment and other revolving |
2 |
|
9 |
|
Commercial banking |
2 |
|
15 |
|
Total |
$ |
524 |
|
$ |
466 |
|
International |
|
|
Residential first mortgages |
$ |
11 |
|
$ |
11 |
|
Credit cards |
185 |
|
148 |
|
Installment and other revolving |
96 |
|
90 |
|
Commercial banking |
1 |
|
37 |
|
Total |
$ |
293 |
|
$ |
286 |
|
Corporate Loans
Corporate loans represent loans and leases managed by ICG. The following table presents information by corporate loan type:
|
|
|
|
|
|
|
|
In millions of dollars |
December 31,
2017 |
December 31,
2016 |
In U.S. offices |
|
|
Commercial and industrial |
$ |
51,319 |
|
$ |
49,586 |
|
Financial institutions |
39,128 |
|
35,517 |
|
Mortgage and real estate(1)
|
44,683 |
|
38,691 |
|
Installment, revolving credit and other |
33,181 |
|
34,501 |
|
Lease financing |
1,470 |
|
1,518 |
|
|
$ |
169,781 |
|
$ |
159,813 |
|
In offices outside the U.S. |
|
|
Commercial and industrial |
$ |
93,750 |
|
$ |
81,882 |
|
Financial institutions |
35,273 |
|
26,886 |
|
Mortgage and real estate(1)
|
7,309 |
|
5,363 |
|
Installment, revolving credit and other |
22,638 |
|
19,965 |
|
Lease financing |
190 |
|
251 |
|
Governments and official institutions |
5,200 |
|
5,850 |
|
|
$ |
164,360 |
|
$ |
140,197 |
|
Total corporate loans |
$ |
334,141 |
|
$ |
300,010 |
|
Net unearned income |
$ |
(763 |
) |
$ |
(704 |
) |
Corporate loans, net of unearned income |
$ |
333,378 |
|
$ |
299,306 |
|
|
|
(1) |
Loans secured primarily by real estate. |
The Company sold and/or reclassified to held-for-sale $1.0 billion and $4.2 billion of corporate loans during the years ended December 31, 2017 and 2016, respectively. The Company did not have significant purchases of corporate loans classified as held-for-investment for the years ended December 31, 2017 or 2016.
Delinquency Status
Citi generally does not manage corporate loans on a delinquency basis. Corporate loans are identified as impaired and placed on a cash (non-accrual) basis when it is determined, based on actual experience and a forward-looking assessment of the collectability of the loan in full, that the payment of interest or principal is doubtful or when interest or principal is 90 days past due, except when the loan is well collateralized and in the process of collection. Any interest accrued on impaired corporate loans and leases is reversed at 90 days and charged against current earnings, and interest is thereafter included in earnings only to the extent actually received in cash. When there is doubt regarding the ultimate collectability of principal, all cash receipts are thereafter applied to reduce the recorded investment in the loan. While corporate loans are generally managed based on their internally assigned risk rating (see further discussion below), the following tables present delinquency information by corporate loan type.
Corporate Loan Delinquency and Non-Accrual Details at December 31, 2017
|
|
|
|
|
|
|
|
|
|
|
|
|
|
|
|
|
|
|
|
In millions of dollars |
30–89 days
past due
and accruing(1)
|
≥ 90 days
past due and
accruing(1)
|
Total past due
and accruing
|
Total
non-accrual(2)
|
Total
current(3)
|
Total
loans (4)
|
Commercial and industrial |
$ |
249 |
|
$ |
13 |
|
$ |
262 |
|
$ |
1,506 |
|
$ |
139,554 |
|
$ |
141,322 |
|
Financial institutions |
93 |
|
15 |
|
108 |
|
92 |
|
73,557 |
|
73,757 |
|
Mortgage and real estate |
147 |
|
59 |
|
206 |
|
195 |
|
51,563 |
|
51,964 |
|
Leases |
68 |
|
8 |
|
76 |
|
46 |
|
1,533 |
|
1,655 |
|
Other |
70 |
|
13 |
|
83 |
|
103 |
|
60,145 |
|
60,331 |
|
Loans at fair value |
|
|
|
|
|
|
|
|
|
|
4,349 |
|
Total |
$ |
627 |
|
$ |
108 |
|
$ |
735 |
|
$ |
1,942 |
|
$ |
326,352 |
|
$ |
333,378 |
|
Corporate Loan Delinquency and Non-Accrual Details at December 31, 2016
|
|
|
|
|
|
|
|
|
|
|
|
|
|
|
|
|
|
|
|
In millions of dollars |
30–89 days
past due
and accruing(1)
|
≥ 90 days
past due and
accruing(1)
|
Total past due
and accruing
|
Total
non-accrual(2)
|
Total
current(3)
|
Total
loans (4)
|
Commercial and industrial |
$ |
143 |
|
$ |
52 |
|
$ |
195 |
|
$ |
1,909 |
|
$ |
127,012 |
|
$ |
129,116 |
|
Financial institutions |
119 |
|
2 |
|
121 |
|
185 |
|
61,254 |
|
61,560 |
|
Mortgage and real estate |
148 |
|
137 |
|
285 |
|
139 |
|
43,607 |
|
44,031 |
|
Leases |
27 |
|
8 |
|
35 |
|
56 |
|
1,678 |
|
1,769 |
|
Other |
349 |
|
12 |
|
361 |
|
132 |
|
58,880 |
|
59,373 |
|
Loans at fair value |
|
|
|
|
|
|
|
|
|
|
3,457 |
|
Total |
$ |
786 |
|
$ |
211 |
|
$ |
997 |
|
$ |
2,421 |
|
$ |
292,431 |
|
$ |
299,306 |
|
|
|
(1) |
Corporate loans that are 90 days past due are generally classified as non-accrual. Corporate loans are considered past due when principal or interest is contractually due but unpaid.
|
|
|
(2) |
Non-accrual loans generally include those loans that are ≥ 90 days past due or those loans for which Citi believes, based on actual experience and a forward-looking assessment of the collectability of the loan in full, that the payment of interest or principal is doubtful.
|
|
|
(3) |
Loans less than 30 days past due are presented as current.
|
|
|
(4) |
Total loans include loans at fair value, which are not included in the various delinquency columns. |
Citigroup has a risk management process to monitor, evaluate and manage the principal risks associated with its corporate loan portfolio. As part of its risk management process, Citi assigns numeric risk ratings to its corporate loan facilities based on quantitative and qualitative assessments of the obligor and facility. These risk ratings are reviewed at least annually or more often if material events related to the obligor or facility warrant. Factors considered in assigning the risk ratings include financial condition of the obligor, qualitative assessment of management and strategy, amount and sources of repayment, amount and type of collateral and guarantee arrangements, amount and type of any contingencies associated with the obligor and the obligor’s industry and geography.
The obligor risk ratings are defined by ranges of default probabilities. The facility risk ratings are defined by ranges of loss norms, which are the product of the probability of default and the loss given default. The investment grade rating categories are similar to the category BBB-/Baa3 and above as defined by S&P and Moody’s. Loans classified according to the bank regulatory definitions as special mention, substandard and doubtful will have risk ratings within the non-investment grade categories.
Corporate Loans Credit Quality Indicators
|
|
|
|
|
|
|
|
|
Recorded investment in loans(1)
|
In millions of dollars |
December 31, 2017 |
December 31,
2016 |
Investment grade(2)
|
|
|
Commercial and industrial |
$ |
101,313 |
|
$ |
87,201 |
|
Financial institutions |
60,404 |
|
50,597 |
|
Mortgage and real estate |
23,213 |
|
18,718 |
|
Leases |
1,090 |
|
1,303 |
|
Other |
56,306 |
|
52,828 |
|
Total investment grade |
$ |
242,326 |
|
$ |
210,647 |
|
Non-investment grade(2)
|
|
|
Accrual |
|
|
Commercial and industrial |
$ |
38,503 |
|
$ |
39,874 |
|
Financial institutions |
13,261 |
|
10,873 |
|
Mortgage and real estate |
2,881 |
|
1,821 |
|
Leases |
518 |
|
410 |
|
Other |
3,924 |
|
6,450 |
|
Non-accrual |
|
|
Commercial and industrial |
1,506 |
|
1,909 |
|
Financial institutions |
92 |
|
185 |
|
Mortgage and real estate |
195 |
|
139 |
|
Leases |
46 |
|
56 |
|
Other |
103 |
|
132 |
|
Total non-investment grade |
$ |
61,029 |
|
$ |
61,849 |
|
Private bank loans managed on a delinquency basis(2)
|
$ |
25,674 |
|
$ |
23,353 |
|
Loans at fair value |
4,349 |
|
3,457 |
|
Corporate loans, net of unearned income |
$ |
333,378 |
|
$ |
299,306 |
|
|
|
(1) |
Recorded investment in a loan includes net deferred loan fees and costs, unamortized premium or discount, less any direct write-downs. |
|
|
(2) |
Held-for-investment loans are accounted for on an amortized cost basis. |
Impaired collateral-dependent loans and leases, where repayment is expected to be provided solely by the sale of the underlying collateral and there are no other available and reliable sources of repayment, are written down to the lower of cost or collateral value, less cost to sell. Cash-basis loans are returned to an accrual status when all contractual principal and interest amounts are reasonably assured of repayment and there is a sustained period of repayment performance, generally six months, in accordance with the contractual terms of the loan.
The following tables present non-accrual loan information by corporate loan type and interest income recognized on non-accrual corporate loans:
Non-Accrual Corporate Loans
|
|
|
|
|
|
|
|
|
|
|
|
|
|
|
|
|
|
At and for the year ended December 31, 2017 |
In millions of dollars |
Recorded
investment(1)
|
Unpaid
principal balance
|
Related specific
allowance
|
Average
carrying value(2)
|
Interest income recognized(3)
|
Non-accrual corporate loans |
|
|
|
|
|
Commercial and industrial |
$ |
1,506 |
|
$ |
1,775 |
|
$ |
368 |
|
$ |
1,547 |
|
$ |
23 |
|
Financial institutions |
92 |
|
102 |
|
41 |
|
212 |
|
1 |
|
Mortgage and real estate |
195 |
|
324 |
|
11 |
|
183 |
|
10 |
|
Lease financing |
46 |
|
46 |
|
4 |
|
59 |
|
— |
|
Other |
103 |
|
212 |
|
2 |
|
108 |
|
1 |
|
Total non-accrual corporate loans |
$ |
1,942 |
|
$ |
2,459 |
|
$ |
426 |
|
$ |
2,109 |
|
$ |
35 |
|
|
|
|
|
|
|
|
|
|
|
|
|
|
|
|
|
|
|
At and for the year ended December 31, 2016 |
In millions of dollars |
Recorded
investment(1)
|
Unpaid
principal balance
|
Related specific
allowance
|
Average
carrying value(2)
|
Interest income recognized(3)
|
Non-accrual corporate loans |
|
|
|
|
|
Commercial and industrial |
$ |
1,909 |
|
$ |
2,259 |
|
$ |
362 |
|
$ |
1,919 |
|
$ |
25 |
|
Financial institutions |
185 |
|
192 |
|
16 |
|
183 |
|
3 |
|
Mortgage and real estate |
139 |
|
250 |
|
10 |
|
174 |
|
6 |
|
Lease financing |
56 |
|
56 |
|
4 |
|
44 |
|
— |
|
Other |
132 |
|
197 |
|
— |
|
87 |
|
6 |
|
Total non-accrual corporate loans |
$ |
2,421 |
|
$ |
2,954 |
|
$ |
392 |
|
$ |
2,407 |
|
$ |
40 |
|
|
|
|
|
|
|
|
|
|
|
|
|
|
|
|
December 31, 2017 |
December 31, 2016 |
In millions of dollars |
Recorded
investment(1)
|
Related specific
allowance
|
Recorded
investment(1)
|
Related specific
allowance
|
Non-accrual corporate loans with valuation allowances |
|
|
|
|
Commercial and industrial |
$ |
1,017 |
|
$ |
368 |
|
$ |
1,343 |
|
$ |
362 |
|
Financial institutions |
88 |
|
41 |
|
45 |
|
16 |
|
Mortgage and real estate |
51 |
|
11 |
|
41 |
|
10 |
|
Lease financing |
46 |
|
4 |
|
55 |
|
4 |
|
Other |
13 |
|
2 |
|
1 |
|
— |
|
Total non-accrual corporate loans with specific allowance |
$ |
1,215 |
|
$ |
426 |
|
$ |
1,485 |
|
$ |
392 |
|
Non-accrual corporate loans without specific allowance |
|
|
|
|
Commercial and industrial |
$ |
489 |
|
|
|
$ |
566 |
|
|
|
Financial institutions |
4 |
|
|
|
140 |
|
|
|
Mortgage and real estate |
144 |
|
|
|
98 |
|
|
|
Lease financing |
— |
|
|
|
1 |
|
|
|
Other |
90 |
|
|
|
131 |
|
|
|
Total non-accrual corporate loans without specific allowance |
$ |
727 |
|
N/A |
|
$ |
936 |
|
N/A |
|
|
|
(1) |
Recorded investment in a loan includes net deferred loan fees and costs, unamortized premium or discount, less any direct write-downs. |
|
|
(2) |
Average carrying value represents the average recorded investment balance and does not include related specific allowance. |
|
|
(3) |
Interest income recognized for the year ended December 31, 2015 was $11 million.
|
N/A Not applicable
Corporate Troubled Debt Restructurings
The following table presents corporate TDR activity at and for the year ended December 31, 2017:
|
|
|
|
|
|
|
|
|
|
|
|
|
|
In millions of dollars |
Carrying
Value
|
TDRs
involving changes
in the amount
and/or timing of
principal payments(1)
|
TDRs
involving changes
in the amount
and/or timing of
interest payments(2)
|
TDRs
involving changes
in the amount
and/or timing of
both principal and
interest payments
|
Commercial and industrial |
$ |
509 |
|
$ |
131 |
|
$ |
7 |
|
$ |
371 |
|
Financial institutions |
15 |
|
— |
|
— |
|
15 |
|
Mortgage and real estate |
36 |
|
— |
|
— |
|
36 |
|
Total |
$ |
560 |
|
$ |
131 |
|
$ |
7 |
|
$ |
422 |
|
The following table presents corporate TDR activity at and for the year ended December 31, 2016:
|
|
|
|
|
|
|
|
|
|
|
|
|
|
In millions of dollars |
Carrying
Value
|
TDRs
involving changes
in the amount
and/or timing of
principal payments(1)
|
TDRs
involving changes
in the amount
and/or timing of
interest payments(2)
|
TDRs
involving changes
in the amount
and/or timing of
both principal and
interest payments
|
Commercial and industrial |
$ |
338 |
|
$ |
176 |
|
$ |
34 |
|
$ |
128 |
|
Financial institutions |
10 |
|
10 |
|
— |
|
— |
|
Mortgage and real estate |
15 |
|
6 |
|
— |
|
9 |
|
Other |
142 |
|
— |
|
142 |
|
— |
|
Total |
$ |
505 |
|
$ |
192 |
|
$ |
176 |
|
$ |
137 |
|
|
|
(1) |
TDRs involving changes in the amount or timing of principal payments may involve principal forgiveness or deferral of periodic and/or final principal payments. Because forgiveness of principal is rare for corporate loans, modifications typically have little to no impact on the loans’ projected cash flows and thus little to no impact on the allowance established for the loans. Charge-offs for amounts deemed uncollectable may be recorded at the time of the restructuring or may have already been recorded in prior periods such that no charge-off is required at the time of the modification. |
|
|
(2) |
TDRs involving changes in the amount or timing of interest payments may involve a below-market interest rate. |
The following table presents total corporate loans modified in a TDR as well as those TDRs that defaulted and for which the payment default occurred within one year of a permanent modification. Default is defined as 60 days past due, except for classifiably managed commercial banking loans, where default is defined as 90 days past due.
|
|
|
|
|
|
|
|
|
|
|
|
|
|
In millions of dollars |
TDR balances at December 31, 2017 |
TDR loans in payment default during the year ended December 31, 2017 |
TDR balances at
December 31, 2016
|
TDR loans in payment default during the year ended December 31, 2016 |
Commercial and industrial |
$ |
617 |
|
$ |
72 |
|
$ |
408 |
|
$ |
7 |
|
Financial institutions |
48 |
|
— |
|
9 |
|
— |
|
Mortgage and real estate |
101 |
|
— |
|
87 |
|
8 |
|
Lease financing |
7 |
|
— |
|
— |
|
— |
|
Other |
45 |
|
— |
|
228 |
|
— |
|
Total(1)
|
$ |
818 |
|
$ |
72 |
|
$ |
732 |
|
$ |
15 |
|
|
|
(1) |
The above tables reflect activity for loans outstanding as of the end of the reporting period that were considered TDRs. |
15. ALLOWANCE FOR CREDIT LOSSES
|
|
|
|
|
|
|
|
|
|
|
In millions of dollars |
2017 |
2016 |
2015 |
Allowance for loan losses at beginning of period |
$ |
12,060 |
|
$ |
12,626 |
|
$ |
15,994 |
|
Gross credit losses |
(8,673 |
) |
(8,222 |
) |
(9,041 |
) |
Gross recoveries(1)
|
1,597 |
|
1,661 |
|
1,739 |
|
Net credit losses (NCLs) |
$ |
(7,076 |
) |
$ |
(6,561 |
) |
$ |
(7,302 |
) |
NCLs |
$ |
7,076 |
|
$ |
6,561 |
|
$ |
7,302 |
|
Net reserve builds (releases) |
544 |
|
340 |
|
139 |
|
Net specific reserve releases |
(117 |
) |
(152 |
) |
(333 |
) |
Total provision for loan losses |
$ |
7,503 |
|
$ |
6,749 |
|
$ |
7,108 |
|
Other, net (see table below) |
(132 |
) |
(754 |
) |
(3,174 |
) |
Allowance for loan losses at end of period |
$ |
12,355 |
|
$ |
12,060 |
|
$ |
12,626 |
|
Allowance for credit losses on unfunded lending commitments at beginning of period |
$ |
1,418 |
|
$ |
1,402 |
|
$ |
1,063 |
|
Provision (release) for unfunded lending commitments |
(161 |
) |
29 |
|
74 |
|
Other, net(2)
|
1 |
|
(13 |
) |
265 |
|
Allowance for credit losses on unfunded lending commitments at end of period(3)
|
$ |
1,258 |
|
$ |
1,418 |
|
$ |
1,402 |
|
Total allowance for loans, leases and unfunded lending commitments |
$ |
13,613 |
|
$ |
13,478 |
|
$ |
14,028 |
|
|
|
(1) |
Recoveries have been reduced by certain collection costs that are incurred only if collection efforts are successful. |
|
|
(2) |
2015 includes a reclassification of $271 million of Allowance for loan losses to Allowance for unfunded lending commitments, included in Other, net. This reclassification reflects the re-attribution of $271 million in Allowances for credit losses between the funded and unfunded portions of the corporate credit portfolios and does not reflect a change in the underlying credit performance of these portfolios.
|
|
|
(3) |
Represents additional credit loss reserves for unfunded lending commitments and letters of credit recorded in Other liabilities on the Consolidated Balance Sheet.
|
|
|
|
|
|
|
|
|
|
|
|
Other, net details: |
|
|
|
In millions of dollars |
2017 |
2016 |
2015 |
Sales or transfers of various consumer loan portfolios to held-for-sale |
|
|
|
Transfer of real estate loan portfolios |
$ |
(106 |
) |
$ |
(106 |
) |
$ |
(1,462 |
) |
Transfer of other loan portfolios |
(155 |
) |
(468 |
) |
(948 |
) |
Sales or transfers of various consumer loan portfolios to held-for-sale |
$ |
(261 |
) |
$ |
(574 |
) |
$ |
(2,410 |
) |
FX translation, consumer |
115 |
|
(199 |
) |
(474 |
) |
Other |
14 |
|
19 |
|
(290 |
) |
Other, net |
$ |
(132 |
) |
$ |
(754 |
) |
$ |
(3,174 |
) |
Allowance for Credit Losses and Investment in Loans at December 31, 2017
|
|
|
|
|
|
|
|
|
|
|
In millions of dollars |
Corporate |
Consumer |
Total |
Allowance for loan losses at beginning of period |
$ |
2,702 |
|
$ |
9,358 |
|
$ |
12,060 |
|
Charge-offs |
(491 |
) |
(8,182 |
) |
(8,673 |
) |
Recoveries |
112 |
|
1,485 |
|
1,597 |
|
Replenishment of net charge-offs |
379 |
|
6,697 |
|
7,076 |
|
Net reserve builds (releases) |
(267 |
) |
811 |
|
544 |
|
Net specific reserve builds (releases) |
28 |
|
(145 |
) |
(117 |
) |
Other |
23 |
|
(155 |
) |
(132 |
) |
Ending balance |
$ |
2,486 |
|
$ |
9,869 |
|
$ |
12,355 |
|
Allowance for loan losses |
|
|
|
|
|
|
Collectively evaluated in accordance with ASC 450 |
$ |
2,060 |
|
$ |
8,531 |
|
$ |
10,591 |
|
Individually evaluated in accordance with ASC 310-10-35 |
426 |
|
1,334 |
|
1,760 |
|
Purchased credit-impaired in accordance with ASC 310-30 |
— |
|
4 |
|
4 |
|
Total allowance for loan losses |
$ |
2,486 |
|
$ |
9,869 |
|
$ |
12,355 |
|
Loans, net of unearned income |
|
|
|
Collectively evaluated for impairment in accordance with ASC 450 |
$ |
327,142 |
|
$ |
326,884 |
|
$ |
654,026 |
|
Individually evaluated for impairment in accordance with ASC 310-10-35 |
1,887 |
|
6,580 |
|
8,467 |
|
Purchased credit-impaired in accordance with ASC 310-30 |
— |
|
167 |
|
167 |
|
Held at fair value |
4,349 |
|
25 |
|
4,374 |
|
Total loans, net of unearned income |
$ |
333,378 |
|
$ |
333,656 |
|
$ |
667,034 |
|
Allowance for Credit Losses and Investment in Loans at December 31, 2016
|
|
|
|
|
|
|
|
|
|
|
In millions of dollars |
Corporate |
Consumer |
Total |
Allowance for loan losses at beginning of period |
$ |
2,791 |
|
$ |
9,835 |
|
$ |
12,626 |
|
Charge-offs |
(580 |
) |
(7,642 |
) |
(8,222 |
) |
Recoveries |
67 |
|
1,594 |
|
1,661 |
|
Replenishment of net charge-offs |
513 |
|
6,048 |
|
6,561 |
|
Net reserve builds (releases) |
(85 |
) |
425 |
|
340 |
|
Net specific reserve builds (releases) |
— |
|
(152 |
) |
(152 |
) |
Other |
(4 |
) |
(750 |
) |
(754 |
) |
Ending balance |
$ |
2,702 |
|
$ |
9,358 |
|
$ |
12,060 |
|
Allowance for loan losses |
|
|
|
|
|
|
Collectively evaluated in accordance with ASC 450 |
$ |
2,310 |
|
$ |
7,744 |
|
$ |
10,054 |
|
Individually evaluated in accordance with ASC 310-10-35 |
392 |
|
1,608 |
|
2,000 |
|
Purchased credit-impaired in accordance with ASC 310-30 |
— |
|
6 |
|
6 |
|
Total allowance for loan losses |
$ |
2,702 |
|
$ |
9,358 |
|
$ |
12,060 |
|
Loans, net of unearned income |
|
|
|
Collectively evaluated for impairment in accordance with ASC 450 |
$ |
293,218 |
|
$ |
317,048 |
|
$ |
610,266 |
|
Individually evaluated for impairment in accordance with ASC 310-10-35 |
2,631 |
|
7,799 |
|
10,430 |
|
Purchased credit-impaired in accordance with ASC 310-30 |
— |
|
187 |
|
187 |
|
Held at fair value |
3,457 |
|
29 |
|
3,486 |
|
Total loans, net of unearned income |
$ |
299,306 |
|
$ |
325,063 |
|
$ |
624,369 |
|
Allowance for Credit Losses at December 31, 2015
|
|
|
|
|
|
|
|
|
|
|
In millions of dollars |
Corporate |
Consumer |
Total |
Allowance for loan losses at beginning of period |
$ |
2,447 |
|
$ |
13,547 |
|
$ |
15,994 |
|
Charge-offs |
(349 |
) |
(8,692 |
) |
(9,041 |
) |
Recoveries |
105 |
|
1,634 |
|
1,739 |
|
Replenishment of net charge-offs |
244 |
|
7,058 |
|
7,302 |
|
Net reserve builds (releases) |
550 |
|
(411 |
) |
139 |
|
Net specific reserve builds (releases) |
86 |
|
(419 |
) |
(333 |
) |
Other |
(292 |
) |
(2,882 |
) |
(3,174 |
) |
Ending balance |
$ |
2,791 |
|
$ |
9,835 |
|
$ |
12,626 |
|
16. GOODWILL AND INTANGIBLE ASSETS
Goodwill
The changes in Goodwill were as follows:
|
|
|
|
|
In millions of dollars |
|
Balance at December 31, 2014 |
$ |
23,592 |
|
Foreign exchange translation and other |
$ |
(1,000 |
) |
Divestitures(1)
|
(212 |
) |
Impairment of goodwill(2)
|
(31 |
) |
Balance at December 31, 2015 |
$ |
22,349 |
|
|
Foreign exchange translation and other
|
$ |
(613 |
) |
Divestitures(3)
|
(77 |
) |
Balance at December 31, 2016 |
$ |
21,659 |
|
Foreign exchange translation and other |
$ |
729 |
|
Divestitures(4)
|
(104 |
) |
Impairment of goodwill(5)
|
(28 |
) |
Balance at December 31, 2017 |
$ |
22,256 |
|
The changes in Goodwill by segment were as follows:
|
|
|
|
|
|
|
|
|
|
|
|
|
|
In millions of dollars |
Global Consumer Banking |
Institutional Clients Group |
Corporate/Other(6)
|
Total |
Balance at December 31, 2015(7)
|
$ |
12,704 |
|
$ |
9,545 |
|
$ |
100 |
|
$ |
22,349 |
|
Foreign exchange translation and other |
$ |
(174 |
) |
$ |
(447 |
) |
$ |
8 |
|
$ |
(613 |
) |
Divestitures(3)
|
— |
|
(13 |
) |
(64 |
) |
(77 |
) |
Balance at December 31, 2016 |
$ |
12,530 |
|
$ |
9,085 |
|
$ |
44 |
|
$ |
21,659 |
|
Foreign exchange translation and other |
$ |
286 |
|
$ |
443 |
|
$ |
— |
|
$ |
729 |
|
Divestitures(4)
|
(32 |
) |
(72 |
) |
— |
|
(104 |
) |
Impairment of goodwill(5)
|
— |
|
— |
|
(28 |
) |
(28 |
) |
Balance at December 31, 2017 |
$ |
12,784 |
|
$ |
9,456 |
|
$ |
16 |
|
$ |
22,256 |
|
|
|
(1) |
Primarily related to the sales of the Latin America Retirement Services and Japan cards businesses completed in 2015, and agreements to sell certain businesses in Citi Holdings as of December 31, 2015. See Note 2 to the Consolidated Financial Statements. |
|
|
(2) |
Goodwill impairment related to reporting units subsequently sold, including Citi Holdings—Consumer Finance South Korea of $16 million and Citi Holdings—Consumer Latin America of $15 million.
|
|
|
(3) |
Primarily related to the sale of the private equity services business completed in 2016 and agreements to sell Argentina and Brazil consumer operations as of December 31, 2016. |
|
|
(4) |
Primarily related to the sale of a fixed income analytics business and a fixed income index business completed in 2017 and an agreement to sell a Mexico asset management business as of December 31, 2017. See Note 2 to the Consolidated Financial Statements. |
|
|
(5) |
Goodwill impairment related to the mortgage servicing business upon transfer from North America GCB to Corporate/Other effective January 1, 2017.
|
|
|
(6) |
All Citi Holdings reporting units are presented in Corporate/Other. See Note 3 to the Consolidated Financial Statements.
|
|
|
(7) |
December 31, 2015 has been restated to reflect intersegment goodwill allocations that resulted from the reorganizations in 2016 and on January 1, 2017 including transfers of GCB businesses to ICG and to Corporate/Other. See Note 3 to the Consolidated Financial Statements.
|
Goodwill impairment testing is performed at the level below each business segment (referred to as a reporting unit). The Company performed its annual goodwill impairment test as of July 1, 2017. The fair values of the Company’s reporting units exceeded their carrying values by approximately 32% to 168% and no reporting unit is at risk of impairment, except for Citi Holdings—Consumer Latin America.
Interim impairment tests were performed for Citi Holdings—Consumer Latin America, which is reported as part of Corporate/Other, for all other quarters in 2017.
While there is no indication of impairment, each interim impairment test showed that the fair value of Citi Holdings—Consumer Latin America reporting unit, which has $16 million of goodwill, only marginally exceeded its carrying value. The fair value as a percentage of allocated book value as of December 31, 2017 was 111%. Subsequently, on January 31, 2018, Citi executed a definitive agreement to sell the reporting unit and allocated the entire goodwill to the sale, which is expected to result in a pre-tax gain upon closing.
Further, effective January 1, 2017, the mortgage servicing business in North America GCB was reorganized and is now reported as part of Corporate/Other. Goodwill was allocated to the transferred business based on its relative fair value to the legacy North America GCB reporting unit. An interim test was performed under both the legacy and current reporting unit structures, which resulted in full impairment of the $28 million of allocated goodwill upon transfer to Citi Holdings—REL, recorded in Operating expenses in 2017.
Intangible Assets
The components of intangible assets were as follows:
|
|
|
|
|
|
|
|
|
|
|
|
|
|
|
|
|
|
|
|
|
December 31, 2017 |
December 31, 2016 |
In millions of dollars |
Gross
carrying
amount
|
Accumulated
amortization
|
Net
carrying
amount
|
Gross
carrying
amount
|
Accumulated
amortization
|
Net
carrying
amount
|
Purchased credit card relationships |
$ |
5,375 |
|
$ |
3,836 |
|
$ |
1,539 |
|
$ |
8,215 |
|
$ |
6,549 |
|
$ |
1,666 |
|
Credit card contract related intangibles |
5,045 |
|
2,456 |
|
2,589 |
|
5,149 |
|
2,177 |
|
2,972 |
|
Core deposit intangibles |
639 |
|
628 |
|
11 |
|
801 |
|
771 |
|
30 |
|
Other customer relationships |
459 |
|
272 |
|
187 |
|
474 |
|
272 |
|
202 |
|
Present value of future profits |
32 |
|
28 |
|
4 |
|
31 |
|
27 |
|
4 |
|
Indefinite-lived intangible assets |
244 |
|
— |
|
244 |
|
210 |
|
— |
|
210 |
|
Other |
100 |
|
86 |
|
14 |
|
504 |
|
474 |
|
30 |
|
Intangible assets (excluding MSRs) |
$ |
11,894 |
|
$ |
7,306 |
|
$ |
4,588 |
|
$ |
15,384 |
|
$ |
10,270 |
|
$ |
5,114 |
|
Mortgage servicing rights (MSRs)(1)
|
558 |
|
— |
|
558 |
|
1,564 |
|
— |
|
1,564 |
|
Total intangible assets |
$ |
12,452 |
|
$ |
7,306 |
|
$ |
5,146 |
|
$ |
16,948 |
|
$ |
10,270 |
|
$ |
6,678 |
|
|
|
(1) |
In January 2017, Citi signed agreements to effectively exit its U.S. mortgage servicing operations by the end of 2018 and intensify its focus on loan originations. For additional information on these transactions, see Note 2 to the Consolidated Financial Statements. |
Intangible assets amortization expense was $603 million, $595 million and $625 million for 2017, 2016 and 2015, respectively. Intangible assets amortization expense is estimated to be $503 million in 2018, $479 million in 2019, $332 million in 2020, $314 million in 2021 and $866 million in 2022.
The changes in intangible assets were as follows:
|
|
|
|
|
|
|
|
|
|
|
|
|
|
|
|
|
|
|
|
|
Net carrying
amount at |
|
|
|
|
Net carrying
amount at
|
In millions of dollars |
December 31, 2016 |
Acquisitions/ divestitures |
Amortization |
Impairments |
FX translation and other |
December 31,
2017 |
Purchased credit card relationships |
$ |
1,666 |
|
$ |
20 |
|
$ |
(149 |
) |
$ |
— |
|
$ |
2 |
|
$ |
1,539 |
|
Credit card contract-related intangibles(1)
|
2,972 |
|
9 |
|
(393 |
) |
— |
|
1 |
|
2,589 |
|
Core deposit intangibles |
30 |
|
— |
|
(20 |
) |
— |
|
1 |
|
11 |
|
Other customer relationships |
202 |
|
— |
|
(24 |
) |
— |
|
9 |
|
187 |
|
Present value of future profits |
4 |
|
— |
|
— |
|
— |
|
— |
|
4 |
|
Indefinite-lived intangible assets |
210 |
|
— |
|
— |
|
— |
|
34 |
|
244 |
|
Other |
30 |
|
(14 |
) |
(17 |
) |
— |
|
15 |
|
14 |
|
Intangible assets (excluding MSRs) |
$ |
5,114 |
|
$ |
15 |
|
$ |
(603 |
) |
$ |
— |
|
$ |
62 |
|
$ |
4,588 |
|
Mortgage servicing rights (MSRs)(2)
|
1,564 |
|
|
|
|
|
558 |
|
Total intangible assets |
$ |
6,678 |
|
|
|
|
|
$ |
5,146 |
|
|
|
(1) |
Primarily reflects contract-related intangibles associated with the American Airlines, The Home Depot, Costco, Sears and AT&T credit card program agreements, which represent 97% of the aggregate net carrying amount as of December 31, 2017.
|
|
|
(2) |
For additional information on Citi’s MSRs, including the rollforward from 2016 to 2017, see Note 21 to the Consolidated Financial Statements.
|
17. DEBT
Short-Term Borrowings
|
|
|
|
|
|
|
|
|
|
|
|
|
December 31, |
|
2017 |
2016 |
In millions of dollars |
Balance |
Weighted average coupon |
Balance |
Weighted average coupon |
Commercial paper |
$ |
9,940 |
|
1.28 |
% |
$ |
9,989 |
|
0.79 |
% |
Other borrowings(1)
|
34,512 |
|
1.62 |
|
20,712 |
|
1.39 |
|
Total |
$ |
44,452 |
|
|
$ |
30,701 |
|
|
|
|
(1) |
Includes borrowings from the Federal Home Loan Banks and other market participants. At December 31, 2017 and December 31, 2016, collateralized short-term advances from the Federal Home Loan Banks were $23.8 billion and $12.0 billion, respectively.
|
Borrowings under bank lines of credit may be at interest rates based on LIBOR, CD rates, the prime rate or bids submitted by the banks. Citigroup pays commitment fees for its lines of credit.
Some of Citigroup’s non-bank subsidiaries have credit facilities with Citigroup’s subsidiary depository institutions, including Citibank. Borrowings under these facilities are secured in accordance with Section 23A of the Federal Reserve Act.
Citigroup Global Markets Holdings Inc. (CGMHI) has borrowing agreements consisting of facilities that CGMHI has been advised are available, but where no contractual lending obligation exists. These arrangements are reviewed on an ongoing basis to ensure flexibility in meeting CGMHI’s short-term requirements.
Long-Term Debt
|
|
|
|
|
|
|
|
|
|
|
|
|
|
Balances at
December 31,
|
In millions of dollars |
Weighted
average
coupon
|
Maturities |
2017 |
2016 |
Citigroup Inc.(1)
|
|
|
|
|
Senior debt |
4.15 |
% |
2018-2098 |
$ |
123,488 |
|
$ |
118,881 |
|
Subordinated debt(2)
|
4.48 |
|
2018-2046 |
26,963 |
|
26,758 |
|
|
Trust preferred
securities
|
6.90 |
|
2036-2067 |
1,712 |
|
1,694 |
|
Bank(3)
|
|
|
|
|
Senior debt |
2.06 |
|
2018-2049 |
65,856 |
|
49,454 |
|
Broker-dealer(4)
|
|
|
|
|
Senior debt |
3.44 |
|
2018-2057 |
18,666 |
|
9,387 |
|
Subordinated debt(2)
|
5.37 |
|
2021-2037 |
24 |
|
4 |
|
Total |
3.57 |
% |
|
$ |
236,709 |
|
$ |
206,178 |
|
Senior debt |
|
|
$ |
208,010 |
|
$ |
177,722 |
|
Subordinated debt(2)
|
|
|
26,987 |
|
26,762 |
|
|
Trust preferred
securities
|
|
|
1,712 |
|
1,694 |
|
Total |
|
|
$ |
236,709 |
|
$ |
206,178 |
|
|
|
(1) |
Represents the parent holding company. |
|
|
(2) |
Includes notes that are subordinated within certain countries, regions or subsidiaries. |
|
|
(3) |
Represents Citibank entities as well as other bank entities. At December 31, 2017 and December 31, 2016, collateralized long-term advances from the Federal Home Loan Banks were $19.3 billion and $21.6 billion, respectively.
|
|
|
(4) |
Represents broker-dealer and other non-bank subsidiaries that are consolidated into Citigroup Inc., the parent holding company. |
The Company issues both fixed- and variable-rate debt in a range of currencies. It uses derivative contracts, primarily interest rate swaps, to effectively convert a portion of its fixed-rate debt to variable-rate debt. The maturity structure of the derivatives generally corresponds to the maturity structure of the debt being hedged. In addition, the Company uses other derivative contracts to manage the foreign exchange impact of certain debt issuances. At December 31, 2017, the Company’s overall weighted average interest rate for long-term debt was 3.57% on a contractual basis and 2.70% including the effects of derivative contracts.
Aggregate annual maturities of long-term debt obligations (based on final maturity dates) including trust preferred securities are as follows:
|
|
|
|
|
|
|
|
|
|
|
|
|
|
|
|
|
|
|
|
|
|
|
In millions of dollars |
2018 |
|
2019 |
|
2020 |
|
2021 |
|
2022 |
|
Thereafter |
|
Total |
|
Citigroup Inc. |
$ |
20,050 |
|
$ |
16,656 |
|
$ |
9,565 |
|
$ |
15,499 |
|
$ |
9,627 |
|
$ |
80,766 |
|
$ |
152,163 |
|
Bank |
29,270 |
|
17,245 |
|
10,302 |
|
4,077 |
|
1,471 |
|
3,491 |
|
65,856 |
|
Broker-dealer |
4,158 |
|
2,388 |
|
3,321 |
|
1,443 |
|
1,266 |
|
6,114 |
|
18,690 |
|
Total |
$ |
53,478 |
|
$ |
36,289 |
|
$ |
23,188 |
|
$ |
21,019 |
|
$ |
12,364 |
|
$ |
90,371 |
|
$ |
236,709 |
|
The following table summarizes the Company’s outstanding trust preferred securities at December 31, 2017:
|
|
|
|
|
|
|
|
|
|
|
|
|
|
|
|
|
|
|
|
|
|
|
Junior subordinated debentures owned by trust |
Trust |
Issuance
date
|
Securities
issued
|
Liquidation
value(1)
|
Coupon
rate(2)
|
Common
shares
issued
to parent
|
Amount |
Maturity |
Redeemable
by issuer
beginning
|
In millions of dollars, except share amounts
|
|
|
|
|
|
|
|
|
|
Citigroup Capital III |
Dec. 1996 |
194,053 |
|
$ |
194 |
|
7.625 |
% |
6,003 |
|
$ |
200 |
|
Dec. 1, 2036 |
Not redeemable |
Citigroup Capital XIII |
Sept. 2010 |
89,840,000 |
|
2,246 |
|
3 mo LIBOR + 637 bps |
|
1,000 |
|
2,246 |
|
Oct. 30, 2040 |
Oct. 30, 2015 |
Citigroup Capital XVIII |
June 2007 |
99,901 |
|
135 |
|
3 mo LIBOR + 88.75 bps |
|
50 |
|
135 |
|
June 28, 2067 |
June 28, 2017 |
Total obligated |
|
|
|
$ |
2,575 |
|
|
|
$ |
2,581 |
|
|
|
Note: Distributions on the trust preferred securities and interest on the subordinated debentures are payable semiannually for Citigroup Capital III and Citigroup Capital XVIII and quarterly for Citigroup Capital XIII.
|
|
(1) |
Represents the notional value received by investors from the trusts at the time of issuance. |
|
|
(2) |
In each case, the coupon rate on the subordinated debentures is the same as that on the trust preferred securities. |
18. REGULATORY CAPITAL
Citigroup is subject to risk-based capital and leverage standards issued by the Federal Reserve Board, which constitute the U.S. Basel III rules. Citi’s U.S.-insured depository institution subsidiaries, including Citibank, are subject to similar standards issued by their respective primary federal bank regulatory agencies. These standards are used to evaluate capital adequacy and include the required minimums shown in the following table. The regulatory agencies are
required by law to take specific, prompt corrective actions with respect to institutions that do not meet minimum capital standards.
The following table sets forth for Citigroup and Citibank the regulatory capital tiers, total risk-weighted assets, quarterly adjusted average total assets, Total Leverage Exposure, risk-based capital ratios and leverage ratios in accordance with current regulatory standards (reflecting Basel III Transition Arrangements):
|
|
|
|
|
|
|
|
|
|
|
|
|
|
In millions of dollars, except ratios |
Stated
minimum
|
Citigroup |
Citibank |
|
Well-
capitalized
minimum
|
December 31, 2017 |
Well-
capitalized
minimum
|
December 31, 2017 |
Common Equity Tier 1 Capital |
|
|
|
|
$ |
147,891 |
|
|
|
$ |
124,733 |
|
Tier 1 Capital |
|
|
|
|
164,841 |
|
|
|
126,303 |
|
Total Capital (Tier 1 Capital + Tier 2 Capital)(1)
|
|
|
|
|
190,331 |
|
|
|
139,351 |
|
Total risk-weighted assets(2)
|
|
|
1,138,167 |
|
|
1,014,242 |
|
Quarterly adjusted average total assets(3)
|
|
|
1,869,206 |
|
|
1,401,615 |
|
Total Leverage Exposure(4)
|
|
|
2,433,371 |
|
|
1,901,069 |
|
Common Equity Tier 1 Capital ratio(5)
|
4.5 |
% |
N/A |
|
12.99 |
% |
6.5 |
% |
12.30 |
% |
Tier 1 Capital ratio(5)
|
6.0 |
|
6.0 |
% |
14.48 |
|
8.0 |
|
12.45 |
|
Total Capital ratio(5)
|
8.0 |
|
10.0 |
|
16.77 |
|
10.0 |
|
14.60 |
|
Tier 1 Leverage ratio |
4.0 |
|
N/A |
|
8.82 |
|
5.0 |
|
9.01 |
|
Supplementary Leverage ratio(6)
|
N/A |
|
N/A |
|
6.77 |
|
N/A |
|
6.64 |
|
|
|
(1) |
Reflected in the table above is Citigroup’s and Citibank’s Total Capital as derived under the Basel III Advanced Approaches framework. At December 31, 2017, Citigroup’s and Citibank’s Total Capital as derived under the Basel III Standardized Approach was $202 billion and $150 billion, respectively.
|
|
|
(2) |
Reflected in the table above are Citigroup’s and Citibank’s total risk-weighted assets as derived under the Basel III Standardized Approach. At December 31, 2017, Citigroup’s and Citibank’s total risk-weighted assets as derived under the Basel III Advanced Approaches were $1,135 billion and $955 billion, respectively.
|
|
|
(3) |
Tier 1 Leverage ratio denominator. |
|
|
(4) |
Supplementary Leverage ratio denominator. |
|
|
(5) |
As of December 31, 2017, Citigroup’s and Citibank’s reportable Common Equity Tier 1 Capital and Tier 1 Capital ratios were the lower derived under the Basel III Standardized Approach, whereas the reportable Total Capital ratios were the lower derived under the Basel III Advanced Approaches framework.
|
|
|
(6) |
Commencing on January 1, 2018, Citigroup and Citibank will be required to maintain a stated minimum Supplementary Leverage ratio of 3%, and Citibank will be required to maintain a Supplementary Leverage ratio of 6% to be considered “well capitalized.”
|
N/A Not applicable
As indicated in the table above, Citigroup and Citibank were “well capitalized” under the current federal bank regulatory agency definitions as of December 31, 2017.
Banking Subsidiaries—Constraints on Dividends
There are various legal limitations on the ability of Citigroup’s subsidiary depository institutions to extend credit, pay dividends, or otherwise supply funds to Citigroup and its non-bank subsidiaries. The approval of the Office of the Comptroller of the Currency is required if total dividends declared in any calendar year were to exceed amounts specified by the applicable agency’s regulations.
In determining the dividends, each subsidiary depository institution must also consider its effect on applicable risk-based capital and leverage ratio requirements, as well as policy statements of the federal bank regulatory agencies that indicate that banking organizations should generally pay dividends out of current operating earnings. Citigroup received $7.5 billion and $13.8 billion in dividends from Citibank during 2017 and 2016, respectively.
19. CHANGES IN ACCUMULATED OTHER COMPREHENSIVE INCOME (LOSS) (AOCI)
Changes in each component of Citigroup’s Accumulated other comprehensive income (loss):
|
|
|
|
|
|
|
|
|
|
|
|
|
|
|
|
|
|
|
|
In millions of dollars |
Net
unrealized
gains (losses)
on investment securities |
Debt valuation adjustment (DVA)(1)
|
Cash flow hedges(2)
|
Benefit plans(3)
|
Foreign
currency
translation
adjustment (CTA), net of hedges(4)
|
Accumulated
other
comprehensive income (loss) |
Balance, December 31, 2014 |
$ |
57 |
|
$ |
— |
|
$ |
(909 |
) |
$ |
(5,159 |
) |
$ |
(17,205 |
) |
$ |
(23,216 |
) |
Other comprehensive income before reclassifications |
(695 |
) |
— |
|
83 |
|
(143 |
) |
(5,465 |
) |
(6,220 |
) |
Increase (decrease) due to amounts reclassified from AOCI |
(269 |
) |
— |
|
209 |
|
186 |
|
(34 |
) |
92 |
|
Change, net of taxes |
$ |
(964 |
) |
$ |
— |
|
$ |
292 |
|
$ |
43 |
|
$ |
(5,499 |
) |
$ |
(6,128 |
) |
Balance, December 31, 2015 |
$ |
(907 |
) |
$ |
— |
|
$ |
(617 |
) |
$ |
(5,116 |
) |
$ |
(22,704 |
) |
$ |
(29,344 |
) |
Adjustment to opening balance, net of taxes(1)
|
$ |
— |
|
$ |
(15 |
) |
$ |
— |
|
$ |
— |
|
$ |
— |
|
$ |
(15 |
) |
Adjusted balance, beginning of period |
$ |
(907 |
) |
$ |
(15 |
) |
$ |
(617 |
) |
$ |
(5,116 |
) |
$ |
(22,704 |
) |
$ |
(29,359 |
) |
Other comprehensive income before reclassifications |
$ |
530 |
|
$ |
(335 |
) |
$ |
(88 |
) |
$ |
(208 |
) |
$ |
(2,802 |
) |
$ |
(2,903 |
) |
Increase (decrease) due to amounts reclassified from AOCI
|
(422 |
) |
(2 |
) |
145 |
|
160 |
|
— |
|
(119 |
) |
Change, net of taxes
|
$ |
108 |
|
$ |
(337 |
) |
$ |
57 |
|
$ |
(48 |
) |
$ |
(2,802 |
) |
$ |
(3,022 |
) |
Balance, December 31, 2016 |
$ |
(799 |
) |
$ |
(352 |
) |
$ |
(560 |
) |
$ |
(5,164 |
) |
$ |
(25,506 |
) |
$ |
(32,381 |
) |
Adjustment to opening balance, net of taxes (5)
|
$ |
504 |
|
$ |
— |
|
$ |
— |
|
$ |
— |
|
$ |
— |
|
$ |
504 |
|
Adjusted balance, beginning of period |
$ |
(295 |
) |
$ |
(352 |
) |
$ |
(560 |
) |
$ |
(5,164 |
) |
$ |
(25,506 |
) |
$ |
(31,877 |
) |
Impact of Tax Reform(6)
|
(223 |
) |
(139 |
) |
(113 |
) |
(1,020 |
) |
(1,809 |
) |
(3,304 |
) |
Other comprehensive income before reclassifications |
(186 |
) |
(426 |
) |
(111 |
) |
(158 |
) |
1,607 |
|
726 |
|
Increase (decrease) due to amounts reclassified from AOCI |
(454 |
) |
(4 |
) |
86 |
|
159 |
|
— |
|
(213 |
) |
Change, net of taxes
|
$ |
(863 |
) |
$ |
(569 |
) |
$ |
(138 |
) |
$ |
(1,019 |
) |
$ |
(202 |
) |
$ |
(2,791 |
) |
Balance at December 31, 2017 |
$ |
(1,158 |
) |
$ |
(921 |
) |
$ |
(698 |
) |
$ |
(6,183 |
) |
$ |
(25,708 |
) |
$ |
(34,668 |
) |
|
|
(1) |
Beginning in the first quarter of 2016, changes in DVA are reflected as a component of AOCI, pursuant to the adoption of only the provisions of ASU 2016-01 relating to the presentation of DVA on fair value option liabilities. See Note 1 to the Consolidated Financial Statements for further information regarding this change. |
|
|
(2) |
Primarily driven by Citi’s pay fixed/receive floating interest rate swap programs that hedge the floating rates on liabilities. |
|
|
(3) |
Primarily reflects adjustments based on the quarterly actuarial valuations of Citi’s significant pension and postretirement plans, annual actuarial valuations of all other plans and amortization of amounts previously recognized in Other comprehensive income. |
|
|
(4) |
Primarily reflects the movements in (by order of impact) the Euro, Mexican peso, Polish zloty and Korean won against the U.S. dollar and changes in related tax effects and hedges for the year ended December 31, 2017. Primarily reflects the movements in (by order of impact) the Mexican peso, Euro, British pound and Indian rupee against the U.S. dollar and changes in related tax effects and hedges for the year ended December 31, 2016. Primarily reflects the movements in (by order of impact) the Mexican peso, Brazilian real, Korean won and Euro against the U.S. dollar and changes in related tax effects and hedges for the year ended December 31, 2015.
|
|
|
(5) |
In the second quarter of 2017, Citi early adopted ASU No. 2017-08. Upon adoption, a cumulative effect adjustment was recorded to reduce retained earnings, effective January 1, 2017, for the incremental amortization of cumulative fair value hedge adjustments on callable state and municipal debt securities. See Note 1 to the Consolidated Financial Statements.
|
|
|
(6) |
In the fourth quarter of 2017, Citi adopted ASU 2018-02, which transferred these amounts from AOCI to Retained earnings. See Note 1 to the Consolidated Financial Statements.
|
The pretax and after-tax changes in each component of Accumulated other comprehensive income (loss) are as follows:
|
|
|
|
|
|
|
|
|
|
|
|
|
|
In millions of dollars |
Pretax |
Tax Effect |
Adoption of ASU 2018-02 (1)
|
After-tax |
Balance, December 31, 2014 |
$ |
(31,060 |
) |
$ |
7,844 |
|
$ |
— |
|
$ |
(23,216 |
) |
Change in net unrealized gains (losses) on investment securities |
(1,462 |
) |
498 |
|
— |
|
(964 |
) |
Cash flow hedges |
468 |
|
(176 |
) |
— |
|
292 |
|
Benefit plans |
19 |
|
24 |
|
— |
|
43 |
|
Foreign currency translation adjustment |
(6,405 |
) |
906 |
|
— |
|
(5,499 |
) |
Change |
$ |
(7,380 |
) |
$ |
1,252 |
|
$ |
— |
|
$ |
(6,128 |
) |
Balance, December 31, 2015 |
$ |
(38,440 |
) |
$ |
9,096 |
|
$ |
— |
|
$ |
(29,344 |
) |
Adjustment to opening balance(2)
|
(26 |
) |
11 |
|
— |
|
(15 |
) |
|
Adjusted balance, beginning of period
|
$ |
(38,466 |
) |
$ |
9,107 |
|
$ |
— |
|
$ |
(29,359 |
) |
Change in net unrealized gains (losses) on investment securities |
167 |
|
(59 |
) |
— |
|
108 |
|
Debt valuation adjustment (DVA) |
(538 |
) |
201 |
|
— |
|
(337 |
) |
Cash flow hedges |
84 |
|
(27 |
) |
— |
|
57 |
|
Benefit plans |
(78 |
) |
30 |
|
— |
|
(48 |
) |
Foreign currency translation adjustment |
(3,204 |
) |
402 |
|
— |
|
(2,802 |
) |
Change |
$ |
(3,569 |
) |
$ |
547 |
|
$ |
— |
|
$ |
(3,022 |
) |
Balance, December 31, 2016 |
$ |
(42,035 |
) |
$ |
9,654 |
|
$ |
— |
|
$ |
(32,381 |
) |
Adjustment to opening balance(3)
|
803 |
|
(299 |
) |
— |
|
504 |
|
Adjusted balance, beginning of period |
$ |
(41,232 |
) |
$ |
9,355 |
|
$ |
— |
|
$ |
(31,877 |
) |
Change in net unrealized gains (losses) on investment securities |
(1,088 |
) |
448 |
|
(223 |
) |
(863 |
) |
Debt valuation adjustment (DVA) |
(680 |
) |
250 |
|
(139 |
) |
(569 |
) |
Cash flow hedges |
(37 |
) |
12 |
|
(113 |
) |
(138 |
) |
Benefit plans |
14 |
|
(13 |
) |
(1,020 |
) |
(1,019 |
) |
Foreign currency translation adjustment |
1,795 |
|
(188 |
) |
(1,809 |
) |
(202 |
) |
Change |
$ |
4 |
|
$ |
509 |
|
$ |
(3,304 |
) |
$ |
(2,791 |
) |
Balance, December 31, 2017 |
$ |
(41,228 |
) |
$ |
9,864 |
|
$ |
(3,304 |
) |
$ |
(34,668 |
) |
|
|
(1) |
In the fourth quarter of 2017, Citi adopted ASU 2018-02, which transferred these amounts from AOCI to Retained earnings. See Note 1 to the Consolidated Financial Statements.
|
(2) Represents the $(15) million adjustment related to the initial adoption of ASU 2016-01. See Note 1 to the Consolidated Financial Statements.
|
|
(3) |
In the second quarter of 2017, Citi early adopted ASU 2017-08. Upon adoption, a cumulative effect adjustment was recorded to reduce retained earnings, effective January 1, 2017, for the incremental amortization of cumulative fair value hedge adjustments on callable state and municipal debt securities. See Note 1 to the Consolidated Financial Statements.
|
The Company recognized pretax gain (loss) related to amounts in AOCI reclassified in the Consolidated Statement of Income as follows:
|
|
|
|
|
|
|
|
|
|
|
|
Increase (decrease) in AOCI due to amounts reclassified to Consolidated Statement of Income |
|
Year ended December 31, |
In millions of dollars |
2017 |
2016 |
2015 |
Realized (gains) losses on sales of investments |
$ |
(778 |
) |
$ |
(948 |
) |
$ |
(682 |
) |
OTTI gross impairment losses |
63 |
|
288 |
|
265 |
|
Subtotal, pretax |
$ |
(715 |
) |
$ |
(660 |
) |
$ |
(417 |
) |
Tax effect |
261 |
|
238 |
|
148 |
|
Net realized (gains) losses on investment securities, after-tax(1)
|
$ |
(454 |
) |
$ |
(422 |
) |
$ |
(269 |
) |
Realized DVA (gains) losses on fair value option liabilities |
$ |
(7 |
) |
$ |
(3 |
) |
$ |
— |
|
Subtotal, pretax |
$ |
(7 |
) |
$ |
(3 |
) |
$ |
— |
|
Tax effect |
3 |
|
1 |
|
— |
|
Net realized debt valuation adjustment, after-tax |
$ |
(4 |
) |
$ |
(2 |
) |
$ |
— |
|
Interest rate contracts |
$ |
126 |
|
$ |
140 |
|
$ |
186 |
|
Foreign exchange contracts |
10 |
|
93 |
|
146 |
|
Subtotal, pretax |
$ |
136 |
|
$ |
233 |
|
$ |
332 |
|
Tax effect |
(50 |
) |
(88 |
) |
(123 |
) |
Amortization of cash flow hedges, after-tax(2)
|
$ |
86 |
|
$ |
145 |
|
$ |
209 |
|
Amortization of unrecognized |
|
|
|
Prior service cost (benefit) |
$ |
(42 |
) |
$ |
(40 |
) |
$ |
(40 |
) |
Net actuarial loss |
271 |
|
272 |
|
276 |
|
Curtailment/settlement impact(3)
|
17 |
|
18 |
|
57 |
|
Subtotal, pretax |
$ |
246 |
|
$ |
250 |
|
$ |
293 |
|
Tax effect |
(87 |
) |
(90 |
) |
(107 |
) |
Amortization of benefit plans, after-tax(3)
|
$ |
159 |
|
$ |
160 |
|
$ |
186 |
|
Foreign currency translation adjustment |
$ |
— |
|
$ |
— |
|
$ |
(53 |
) |
Tax effect |
— |
|
— |
|
19 |
|
Foreign currency translation adjustment |
$ |
— |
|
$ |
— |
|
$ |
(34 |
) |
Total amounts reclassified out of AOCI, pretax |
$ |
(340 |
) |
$ |
(180 |
) |
$ |
155 |
|
Total tax effect |
127 |
|
61 |
|
(63 |
) |
Total amounts reclassified out of AOCI, after-tax |
$ |
(213 |
) |
$ |
(119 |
) |
$ |
92 |
|
|
|
(1) |
The pretax amount is reclassified to Realized gains (losses) on sales of investments, net and Gross impairment losses in the Consolidated Statement of Income. See Note 13 to the Consolidated Financial Statements for additional details.
|
|
|
(2) |
See Note 22 to the Consolidated Financial Statements for additional details. |
|
|
(3) |
See Note 8 to the Consolidated Financial Statements for additional details.
|
The following table summarizes the Company’s preferred stock outstanding:
|
|
|
|
|
|
|
|
|
|
|
|
|
|
|
|
|
|
|
|
|
Redemption
price per depositary
share/preference share |
|
Carrying value
in millions of dollars
|
|
Issuance date |
Redeemable by issuer beginning |
Dividend
rate |
Number
of depositary
shares |
December 31,
2017 |
December 31,
2016 |
Series AA(1)
|
January 25, 2008 |
February 15, 2018 |
8.125 |
% |
$ |
25 |
|
3,870,330 |
|
$ |
97 |
|
$ |
97 |
|
Series E(2)
|
April 28, 2008 |
April 30, 2018 |
8.400 |
|
1,000 |
|
121,254 |
|
121 |
|
121 |
|
Series A(3)
|
October 29, 2012 |
January 30, 2023 |
5.950 |
|
1,000 |
|
1,500,000 |
|
1,500 |
|
1,500 |
|
Series B(4)
|
December 13, 2012 |
February 15, 2023 |
5.900 |
|
1,000 |
|
750,000 |
|
750 |
|
750 |
|
Series C(5)
|
March 26, 2013 |
April 22, 2018 |
5.800 |
|
25 |
|
23,000,000 |
|
575 |
|
575 |
|
Series D(6)
|
April 30, 2013 |
May 15, 2023 |
5.350 |
|
1,000 |
|
1,250,000 |
|
1,250 |
|
1,250 |
|
Series J(7)
|
September 19, 2013 |
September 30, 2023 |
7.125 |
|
25 |
|
38,000,000 |
|
950 |
|
950 |
|
Series K(8)
|
October 31, 2013 |
November 15, 2023 |
6.875 |
|
25 |
|
59,800,000 |
|
1,495 |
|
1,495 |
|
Series L(9)
|
February 12, 2014 |
February 12, 2019 |
6.875 |
|
25 |
|
19,200,000 |
|
480 |
|
480 |
|
Series M(10)
|
April 30, 2014 |
May 15, 2024 |
6.300 |
|
1,000 |
|
1,750,000 |
|
1,750 |
|
1,750 |
|
Series N(11)
|
October 29, 2014 |
November 15, 2019 |
5.800 |
|
1,000 |
|
1,500,000 |
|
1,500 |
|
1,500 |
|
Series O(12)
|
March 20, 2015 |
March 27, 2020 |
5.875 |
|
1,000 |
|
1,500,000 |
|
1,500 |
|
1,500 |
|
Series P(13)
|
April 24, 2015 |
May 15, 2025 |
5.950 |
|
1,000 |
|
2,000,000 |
|
2,000 |
|
2,000 |
|
Series Q(14)
|
August 12, 2015 |
August 15, 2020 |
5.950 |
|
1,000 |
|
1,250,000 |
|
1,250 |
|
1,250 |
|
Series R(15)
|
November 13, 2015 |
November 15, 2020 |
6.125 |
|
1,000 |
|
1,500,000 |
|
1,500 |
|
1,500 |
|
Series S(16)
|
February 2, 2016 |
February 12, 2021 |
6.300 |
|
25 |
|
41,400,000 |
|
1,035 |
|
1,035 |
|
Series T(17)
|
April 25, 2016 |
August 15, 2026 |
6.250 |
|
1,000 |
|
1,500,000 |
|
1,500 |
|
1,500 |
|
|
|
|
|
|
|
|
|
|
$ |
19,253 |
|
$ |
19,253 |
|
|
|
(1) |
Issued as depositary shares, each representing a 1/1,000th interest in a share of the corresponding series of non-cumulative perpetual preferred stock. Dividends are payable quarterly on February 15, May 15, August 15 and November 15, in each case when, as and if declared by the Citi Board of Directors.
|
|
|
(2) |
Issued as depositary shares, each representing a 1/25th interest in a share of the corresponding series of non-cumulative perpetual preferred stock. Dividends are payable semiannually on April 30 and October 30 at a fixed rate until April 30, 2018, thereafter payable quarterly on January 30, April 30, July 30 and October 30 at a floating rate, in each case when, as and if declared by the Citi Board of Directors.
|
|
|
(3) |
Issued as depositary shares, each representing a 1/25th interest in a share of the corresponding series of non-cumulative perpetual preferred stock. Dividends are payable semiannually on January 30 and July 30 at a fixed rate until January 30, 2023, thereafter payable quarterly on January 30, April 30, July 30 and October 30 at a floating rate, in each case when, as and if declared by the Citi Board of Directors.
|
|
|
(4) |
Issued as depositary shares, each representing a 1/25th interest in a share of the corresponding series of non-cumulative perpetual preferred stock. Dividends are payable semiannually on February 15 and August 15 at a fixed rate until February 15, 2023, thereafter payable quarterly on February 15, May 15, August 15 and November 15 at a floating rate, in each case when, as and if declared by the Citi Board of Directors.
|
|
|
(5) |
Issued as depositary shares, each representing a 1/1,000th interest in a share of the corresponding series of non-cumulative perpetual preferred stock. Dividends are payable quarterly on January 22, April 22, July 22 and October 22 when, as and if declared by the Citi Board of Directors.
|
|
|
(6) |
Issued as depositary shares, each representing a 1/25th interest in a share of the corresponding series of non-cumulative perpetual preferred stock. Dividends are payable semiannually on May 15 and November 15 at a fixed rate until May 15, 2023, thereafter payable quarterly on February 15, May 15, August 15 and November 15 at a floating rate, in each case when, as and if declared by the Citi Board of Directors.
|
|
|
(7) |
Issued as depositary shares, each representing a 1/1,000th interest in a share of the corresponding series of non-cumulative perpetual preferred stock. Dividends are payable quarterly on March 30, June 30, September 30 and December 30 at a fixed rate until September 30, 2023, thereafter payable quarterly on the same dates at a floating rate, in each case when, as and if declared by the Citi Board of Directors.
|
|
|
(8) |
Issued as depositary shares, each representing a 1/1,000th interest in a share of the corresponding series of non-cumulative perpetual preferred stock. Dividends are payable quarterly on February 15, May 15, August 15 and November 15 at a fixed rate until November 15, 2023, thereafter payable quarterly on the same dates at a floating rate, in each case when, as and if declared by the Citi Board of Directors.
|
|
|
(9) |
Issued as depositary shares, each representing a 1/1,000th interest in a share of the corresponding series of non-cumulative perpetual preferred stock. Dividends are payable quarterly on February 12, May 12, August 12 and November 12 at a fixed rate, in each case when, as and if declared by the Citi Board of Directors.
|
|
|
(10) |
Issued as depositary shares, each representing a 1/25th interest in a share of the corresponding series of non-cumulative perpetual preferred stock. Dividends are payable semiannually on May 15 and November 15 at a fixed rate until May 15, 2024, thereafter payable quarterly on February 15, May 15, August 15 and November 15 at a floating rate, in each case when, as and if declared by the Citi Board of Directors.
|
|
|
(11) |
Issued as depositary shares, each representing a 1/25th interest in a share of the corresponding series of non-cumulative perpetual preferred stock. Dividends are payable semiannually on May 15 and November 15 at a fixed rate until, but excluding, November 15, 2019, and thereafter payable quarterly on February 15, May 15, August 15 and November 15 at a floating rate, in each case when, as and if declared by the Citi Board of Directors.
|
|
|
(12) |
Issued as depositary shares, each representing a 1/25th interest in a share of the corresponding series of non-cumulative perpetual preferred stock. Dividends are payable semiannually on March 27 and September 27 at a fixed rate until, but excluding, March 27, 2020, and thereafter payable quarterly on March 27, June 27, September 27 and December 27 at a floating rate, in each case when, as and if declared by the Citi Board of Directors.
|
|
|
(13) |
Issued as depositary shares, each representing a 1/25th interest in a share of the corresponding series of non-cumulative perpetual preferred stock. Dividends are payable semiannually on May 15 and November 15 at a fixed rate until, but excluding, May 15, 2025, and thereafter payable quarterly on February 15, May 15, August 15 and November 15 at a floating rate, in each case when, as and if declared by the Citi Board of Directors.
|
|
|
(14) |
Issued as depositary shares, each representing a 1/25th interest in a share of the corresponding series of non-cumulative perpetual preferred stock. Dividends are payable semiannually on February 15 and August 15 at a fixed rate until, but excluding, August 15, 2020, and thereafter payable quarterly on February 15, May 15, August 15 and November 15 at a floating rate, in each case when, as and if declared by the Citi Board of Directors.
|
|
|
(15) |
Issued as depositary shares, each representing a 1/25th interest in a share of the corresponding series of non-cumulative perpetual preferred stock. Dividends are payable semiannually on May 15 and November 15 at a fixed rate until, but excluding, November 15, 2020, and thereafter payable quarterly on February 15, May 15, August 15 and November 15 at a floating rate, in each case when, as and if declared by the Citi Board of Directors.
|
|
|
(16) |
Issued as depositary shares, each representing a 1/1,000th interest in a share of the corresponding series of non-cumulative perpetual preferred stock. Dividends are payable quarterly on February 12, May 12, August 12 and November 12 at a fixed rate, in each case when, as and if declared by the Citi Board of Directors.
|
|
|
(17) |
Issued as depositary shares, each representing a 1/25th interest in a share of the corresponding series of non-cumulative perpetual preferred stock. Dividends are payable semiannually on February 15 and August 15 at a fixed rate until August 15, 2026, thereafter payable quarterly on February 15, May 15, August 15 and November 15 at a floating rate, in each case when, as and if declared by the Citi Board of Directors.
|
During 2017, Citi distributed $1,213 million in dividends on its outstanding preferred stock. Based on its preferred stock outstanding as of December 31, 2017 and the planned redemption of Series AA on February 15, 2018, Citi estimates it will distribute preferred dividends of approximately $1,179 million during 2018, assuming such dividends are declared by the Citi Board of Directors.
21. SECURITIZATIONS AND VARIABLE INTEREST ENTITIES
Uses of Special Purpose Entities
A special purpose entity (SPE) is an entity designed to fulfill a specific limited need of the company that organized it. The principal uses of SPEs by Citi are to obtain liquidity and favorable capital treatment by securitizing certain financial assets, to assist clients in securitizing their financial assets and to create investment products for clients. SPEs may be organized in various legal forms, including trusts, partnerships or corporations. In a securitization, through the SPE’s issuance of debt and equity instruments, certificates, commercial paper or other notes of indebtedness, the company transferring assets to the SPE converts all (or a portion) of those assets into cash before they would have been realized in the normal course of business. These issuances are recorded on the balance sheet of the SPE, which may or may not be consolidated onto the balance sheet of the company that organized the SPE.
Investors usually have recourse only to the assets in the SPE, but may also benefit from other credit enhancements, such as a collateral account, a line of credit or a liquidity facility, such as a liquidity put option or asset purchase agreement. Because of these enhancements, the SPE issuances typically obtain a more favorable credit rating than the transferor could obtain for its own debt issuances. This results in less expensive financing costs than unsecured debt. The SPE may also enter into derivative contracts in order to convert the yield or currency of the underlying assets to match the needs of the SPE investors or to limit or change the credit risk of the SPE. Citigroup may be the provider of certain credit enhancements as well as the counterparty to any related derivative contracts.
Most of Citigroup’s SPEs are variable interest entities (VIEs), as described below.
Variable Interest Entities
VIEs are entities that have either a total equity investment that is insufficient to permit the entity to finance its activities without additional subordinated financial support or whose equity investors lack the characteristics of a controlling financial interest (i.e., ability to make significant decisions through voting rights or similar rights and a right to receive the expected residual returns of the entity or an obligation to absorb the expected losses of the entity). Investors that finance the VIE through debt or equity interests or other counterparties providing other forms of support, such as guarantees, certain fee arrangements or certain types of derivative contracts, are variable interest holders in the entity.
The variable interest holder, if any, that has a controlling financial interest in a VIE is deemed to be the primary beneficiary and must consolidate the VIE. Citigroup would be deemed to have a controlling financial interest and be the primary beneficiary if it has both of the following characteristics:
|
|
• |
power to direct the activities of the VIE that most significantly impact the entity’s economic performance; and |
|
|
• |
an obligation to absorb losses of the entity that could potentially be significant to the VIE, or a right to receive benefits from the entity that could potentially be significant to the VIE. |
The Company must evaluate each VIE to understand the purpose and design of the entity, the role the Company had in the entity’s design and its involvement in the VIE’s ongoing activities. The Company then must evaluate which activities most significantly impact the economic performance of the VIE and who has the power to direct such activities.
For those VIEs where the Company determines that it has the power to direct the activities that most significantly impact the VIE’s economic performance, the Company must then evaluate its economic interests, if any, and determine whether it could absorb losses or receive benefits that could potentially be significant to the VIE. When evaluating whether the Company has an obligation to absorb losses that could potentially be significant, it considers the maximum exposure to such loss without consideration of probability. Such obligations could be in various forms, including, but not limited to, debt and equity investments, guarantees, liquidity agreements and certain derivative contracts.
In various other transactions, the Company may (i) act as a derivative counterparty (for example, interest rate swap, cross-currency swap or purchaser of credit protection under a credit default swap or total return swap where the Company pays the total return on certain assets to the SPE), (ii) act as underwriter or placement agent, (iii) provide administrative, trustee or other services or (iv) make a market in debt securities or other instruments issued by VIEs. The Company generally considers such involvement, by itself, not to be variable interests and thus not an indicator of power or potentially significant benefits or losses.
Citigroup’s involvement with consolidated and unconsolidated VIEs with which the Company holds significant variable interests or has continuing involvement through servicing a majority of the assets in a VIE is presented below:
|
|
|
|
|
|
|
|
|
|
|
|
|
|
|
|
|
|
|
|
|
|
|
|
|
|
|
As of December 31, 2017 |
|
|
|
|
|
Maximum exposure to loss in significant unconsolidated VIEs(1)
|
|
|
|
|
Funded exposures(2)
|
Unfunded exposures |
|
In millions of dollars |
Total
involvement
with SPE
assets
|
Consolidated
VIE/SPE assets
|
Significant
unconsolidated
VIE assets(3)
|
Debt
investments
|
Equity
investments
|
Funding
commitments
|
Guarantees
and
derivatives
|
Total |
Credit card securitizations |
$ |
50,795 |
|
$ |
50,795 |
|
$ |
— |
|
$ |
— |
|
$ |
— |
|
$ |
— |
|
$ |
— |
|
$ |
— |
|
Mortgage securitizations(4)
|
|
|
|
|
|
|
|
|
U.S. agency-sponsored(5)
|
116,610 |
|
— |
|
116,610 |
|
2,647 |
|
— |
|
— |
|
74 |
|
2,721 |
|
Non-agency-sponsored |
22,251 |
|
2,035 |
|
20,216 |
|
330 |
|
— |
|
— |
|
1 |
|
331 |
|
Citi-administered asset-backed commercial paper conduits (ABCP) |
19,282 |
|
19,282 |
|
— |
|
— |
|
— |
|
— |
|
— |
|
— |
|
Collateralized loan obligations (CLOs) |
20,588 |
|
— |
|
20,588 |
|
5,956 |
|
— |
|
— |
|
9 |
|
5,965 |
|
Asset-based financing |
60,472 |
|
633 |
|
59,839 |
|
19,478 |
|
583 |
|
5,878 |
|
— |
|
25,939 |
|
Municipal securities tender option bond trusts (TOBs) |
6,925 |
|
2,166 |
|
4,759 |
|
138 |
|
— |
|
3,035 |
|
— |
|
3,173 |
|
Municipal investments |
19,119 |
|
7 |
|
19,112 |
|
2,709 |
|
3,640 |
|
2,344 |
|
— |
|
8,693 |
|
Client intermediation |
958 |
|
824 |
|
134 |
|
32 |
|
— |
|
— |
|
9 |
|
41 |
|
Investment funds |
1,892 |
|
616 |
|
1,276 |
|
14 |
|
7 |
|
13 |
|
— |
|
34 |
|
Other |
677 |
|
36 |
|
641 |
|
27 |
|
9 |
|
34 |
|
47 |
|
117 |
|
Total |
$ |
319,569 |
|
$ |
76,394 |
|
$ |
243,175 |
|
$ |
31,331 |
|
$ |
4,239 |
|
$ |
11,304 |
|
$ |
140 |
|
$ |
47,014 |
|
|
|
|
|
|
|
|
|
|
|
|
|
|
|
|
|
|
|
|
|
|
|
|
|
|
|
|
As of December 31, 2016 |
|
|
|
|
|
Maximum exposure to loss in significant unconsolidated VIEs(1)
|
|
|
|
|
Funded exposures(2)
|
Unfunded exposures |
|
In millions of dollars |
Total
involvement
with SPE
assets
|
Consolidated
VIE/SPE assets
|
Significant
unconsolidated
VIE assets(3)
|
Debt
investments
|
Equity
investments
|
Funding
commitments
|
Guarantees
and
derivatives
|
Total |
Credit card securitizations |
$ |
50,171 |
|
$ |
50,171 |
|
$ |
— |
|
$ |
— |
|
$ |
— |
|
$ |
— |
|
$ |
— |
|
$ |
— |
|
Mortgage securitizations(4)
|
|
|
|
|
|
|
|
|
U.S. agency-sponsored |
214,458 |
|
— |
|
214,458 |
|
3,852 |
|
— |
|
— |
|
78 |
|
3,930 |
|
Non-agency-sponsored |
15,965 |
|
1,092 |
|
14,873 |
|
312 |
|
35 |
|
— |
|
1 |
|
348 |
|
Citi-administered asset-backed commercial paper conduits (ABCP) |
19,693 |
|
19,693 |
|
— |
|
— |
|
— |
|
— |
|
— |
|
— |
|
Collateralized loan obligations (CLOs) |
18,886 |
|
— |
|
18,886 |
|
5,128 |
|
— |
|
— |
|
62 |
|
5,190 |
|
Asset-based financing |
53,168 |
|
733 |
|
52,435 |
|
16,553 |
|
475 |
|
4,915 |
|
— |
|
21,943 |
|
Municipal securities tender option bond trusts (TOBs) |
7,070 |
|
2,843 |
|
4,227 |
|
40 |
|
— |
|
2,842 |
|
— |
|
2,882 |
|
Municipal investments |
17,679 |
|
14 |
|
17,665 |
|
2,441 |
|
3,578 |
|
2,580 |
|
— |
|
8,599 |
|
Client intermediation |
515 |
|
371 |
|
144 |
|
49 |
|
— |
|
— |
|
3 |
|
52 |
|
Investment funds |
2,788 |
|
767 |
|
2,021 |
|
32 |
|
120 |
|
27 |
|
3 |
|
182 |
|
Other |
1,429 |
|
607 |
|
822 |
|
116 |
|
11 |
|
58 |
|
43 |
|
228 |
|
Total |
$ |
401,822 |
|
$ |
76,291 |
|
$ |
325,531 |
|
$ |
28,523 |
|
$ |
4,219 |
|
$ |
10,422 |
|
$ |
190 |
|
$ |
43,354 |
|
|
|
(1) |
The definition of maximum exposure to loss is included in the text that follows this table. |
|
|
(2) |
Included on Citigroup’s December 31, 2017 and 2016 Consolidated Balance Sheet.
|
|
|
(3) |
A significant unconsolidated VIE is an entity in which the Company has any variable interest or continuing involvement considered to be significant, regardless of the likelihood of loss. |
|
|
(4) |
Citigroup mortgage securitizations also include agency and non-agency (private-label) re-securitization activities. These SPEs are not consolidated. See “Re-securitizations” below for further discussion. |
|
|
(5) |
See Note 2 to the Consolidated Financial Statements for more information on the exit of the U.S. mortgage servicing operations and sale of MSRs. |
The previous tables do not include the following:
|
|
• |
certain venture capital investments made by some of the Company’s private equity subsidiaries, as the Company accounts for these investments in accordance with the Investment Company Audit Guide (codified in ASC Topic 946); |
|
|
• |
certain investment funds for which the Company provides investment management services and personal estate trusts for which the Company provides administrative, trustee and/or investment management services; |
|
|
• |
certain VIEs structured by third parties in which the Company holds securities in inventory, as these investments are made on arm’s-length terms; |
|
|
• |
certain positions in mortgage-backed and asset-backed securities held by the Company, which are classified as Trading account assets or Investments, in which the Company has no other involvement with the related securitization entity deemed to be significant (for more information on these positions, see Notes 13 and 24 to the Consolidated Financial Statements);
|
|
|
• |
certain representations and warranties exposures in legacy ICG-sponsored mortgage-backed and asset-backed securitizations, in which the Company has no variable interest or continuing involvement as servicer. The outstanding balance of mortgage loans securitized during 2005 to 2008 in which the Company has no variable interest or continuing involvement as servicer was approximately $9 billion and $10 billion at December 31, 2017 and 2016, respectively;
|
|
|
• |
certain representations and warranties exposures in Citigroup residential mortgage securitizations, in which the original mortgage loan balances are no longer outstanding; and |
|
|
• |
VIEs such as trust preferred securities trusts used in connection with the Company’s funding activities. The Company does not have a variable interest in these trusts. |
The asset balances for consolidated VIEs represent the carrying amounts of the assets consolidated by the Company. The carrying amount may represent the amortized cost or the current fair value of the assets depending on the legal form of the asset (e.g., loan or security) and the Company’s standard accounting policies for the asset type and line of business.
The asset balances for unconsolidated VIEs in which the Company has significant involvement represent the most current information available to the Company. In most cases, the asset balances represent an amortized cost basis without regard to impairments, unless fair value information is readily available to the Company.
The maximum funded exposure represents the balance sheet carrying amount of the Company’s investment in the VIE. It reflects the initial amount of cash invested in the VIE adjusted for any accrued interest and cash principal payments received. The carrying amount may also be adjusted for increases or declines in fair value or any impairment in value recognized in earnings. The maximum exposure of unfunded positions represents the remaining undrawn committed amount, including liquidity and credit facilities provided by the Company or the notional amount of a derivative instrument considered to be a variable interest. In certain transactions, the Company has entered into derivative instruments or other arrangements that are not considered variable interests in the VIE (e.g., interest rate swaps, cross-currency swaps or where the Company is the purchaser of credit protection under a credit default swap or total return swap where the Company pays the total return on certain assets to the SPE). Receivables under such arrangements are not included in the maximum exposure amounts.
Funding Commitments for Significant Unconsolidated VIEs—Liquidity Facilities and Loan Commitments
The following table presents the notional amount of liquidity facilities and loan commitments that are classified as funding commitments in the VIE tables above:
|
|
|
|
|
|
|
|
|
|
|
|
|
|
|
December 31, 2017 |
December 31, 2016 |
In millions of dollars |
Liquidity
facilities
|
Loan/equity
commitments
|
Liquidity
facilities
|
Loan/equity
commitments
|
Asset-based financing |
$ |
— |
|
$ |
5,878 |
|
$ |
5 |
|
$ |
4,910 |
|
Municipal securities tender option bond trusts (TOBs) |
3,035 |
|
— |
|
2,842 |
|
— |
|
Municipal investments |
— |
|
2,344 |
|
— |
|
2,580 |
|
Investment funds |
— |
|
13 |
|
— |
|
27 |
|
Other |
— |
|
34 |
|
— |
|
58 |
|
Total funding commitments |
$ |
3,035 |
|
$ |
8,269 |
|
$ |
2,847 |
|
$ |
7,575 |
|
Consolidated VIEs
The Company engages in on-balance sheet securitizations, which are securitizations that do not qualify for sales treatment; thus, the assets remain on the Citi’s Consolidated Balance Sheet, and any proceeds received are recognized as secured liabilities. The consolidated VIEs represent hundreds of separate entities with which the Company is involved. In general, the third-party investors in the obligations of consolidated VIEs have legal recourse only to the assets of the respective VIEs and do not have such recourse to the Company, except where Citi has provided a guarantee to the investors or is the counterparty to certain derivative
transactions involving the VIE. Thus, Citigroup’s maximum legal exposure to loss related to consolidated VIEs is significantly less than the carrying value of the consolidated VIE assets due to outstanding third-party financing. Intercompany assets and liabilities are excluded from Citi’s Consolidated Balance Sheet. All VIE assets are restricted from being sold or pledged as collateral. The cash flows from these assets are the only source used to pay down the associated liabilities, which are non-recourse to Citi’s general assets. See the Consolidated Balance Sheet for more information about these Consolidated VIE assets and liabilities.
Significant Interests in Unconsolidated VIEs—Balance Sheet Classification
The following table presents the carrying amounts and classification of significant variable interests in unconsolidated VIEs:
|
|
|
|
|
|
|
|
In billions of dollars |
December 31, 2017 |
December 31, 2016 |
Cash |
$ |
— |
|
$ |
0.1 |
|
Trading account assets |
8.5 |
|
8.0 |
|
Investments |
4.4 |
|
4.4 |
|
Total loans, net of allowance |
22.2 |
|
18.8 |
|
Other |
0.5 |
|
1.5 |
|
Total assets |
$ |
35.6 |
|
$ |
32.8 |
|
Credit Card Securitizations
The Company securitizes credit card receivables through trusts established to purchase the receivables. Citigroup transfers receivables into the trusts on a non-recourse basis. Credit card securitizations are revolving securitizations; as customers pay their credit card balances, the cash proceeds are used to purchase new receivables and replenish the receivables in the trust.
Substantially all of Citigroup’s credit card securitization activity is through two trusts—Citibank Credit Card Master Trust (Master Trust) and Citibank Omni Master Trust (Omni Trust), with the substantial majority through the Master Trust. These trusts are consolidated entities because, as servicer,
Citigroup has the power to direct the activities that most significantly impact the economic performance of the trusts. Citigroup holds a seller’s interest and certain securities issued by the trusts, which could result in exposure to potentially significant losses or benefits from the trusts. Accordingly, the transferred credit card receivables remain on Citi’s Consolidated Balance Sheet with no gain or loss recognized. The debt issued by the trusts to third parties is included on Citi’s Consolidated Balance Sheet.
Citi utilizes securitizations as one of the sources of funding for its business in North America. The following table reflects amounts related to the Company’s securitized credit card receivables:
|
|
|
|
|
|
|
|
In billions of dollars |
December 31, 2017 |
December 31, 2016 |
Ownership interests in principal amount of trust credit card receivables |
Sold to investors via trust-issued securities |
$ |
28.8 |
|
$ |
22.7 |
|
Retained by Citigroup as trust-issued securities |
7.6 |
|
7.4 |
|
Retained by Citigroup via non-certificated interests |
14.4 |
|
20.6 |
|
Total |
$ |
50.8 |
|
$ |
50.7 |
|
The following table summarizes selected cash flow information related to Citigroup’s credit card securitizations:
|
|
|
|
|
|
|
|
|
|
|
In billions of dollars |
2017 |
2016 |
2015 |
Proceeds from new securitizations |
$ |
11.1 |
|
$ |
3.3 |
|
$ |
— |
|
Pay down of maturing notes |
(5.0 |
) |
(10.3 |
) |
(7.4 |
) |
Managed Loans
After securitization of credit card receivables, the Company continues to maintain credit card customer account relationships and provides servicing for receivables transferred to the trusts. As a result, the Company considers the securitized credit card receivables to be part of the business it manages. As Citigroup consolidates the credit card trusts, all managed securitized card receivables are on-balance sheet.
Funding, Liquidity Facilities and Subordinated Interests
As noted above, Citigroup securitizes credit card receivables through two securitization trusts—Master Trust and Omni Trust. The liabilities of the trusts are included on the Consolidated Balance Sheet, excluding those retained by Citigroup.
The Master Trust issues fixed- and floating-rate term notes. Some of the term notes may be issued to multi-seller commercial paper conduits. The weighted average maturity of
the term notes issued by the Master Trust was 2.6 years as of December 31, 2017 and 2016.
Master Trust Liabilities (at Par Value)
|
|
|
|
|
|
|
|
In billions of dollars |
Dec. 31, 2017 |
Dec. 31, 2016 |
Term notes issued to third parties |
$ |
27.8 |
|
$ |
21.7 |
|
Term notes retained by Citigroup affiliates |
5.7 |
|
5.5 |
|
Total Master Trust liabilities |
$ |
33.5 |
|
$ |
27.2 |
|
The Omni Trust issues fixed- and floating-rate term notes, some of which are purchased by multi-seller commercial paper conduits. The weighted average maturity of the third-party term notes issued by the Omni Trust was 1.9 years as of December 31, 2017 and 2016.
Omni Trust Liabilities (at Par Value)
|
|
|
|
|
|
|
|
In billions of dollars |
Dec. 31, 2017 |
Dec. 31, 2016 |
Term notes issued to third parties |
$ |
1.0 |
|
$ |
1.0 |
|
Term notes retained by Citigroup affiliates |
1.9 |
|
1.9 |
|
Total Omni Trust liabilities |
$ |
2.9 |
|
$ |
2.9 |
|
Mortgage Securitizations
Citigroup provides a wide range of mortgage loan products to a diverse customer base. Once originated, the Company often securitizes these loans through the use of VIEs. These VIEs are funded through the issuance of trust certificates backed solely by the transferred assets. These certificates have the same life as the transferred assets. In addition to providing a source of liquidity and less expensive funding, securitizing these assets also reduces Citi’s credit exposure to the borrowers. These mortgage loan securitizations are primarily non-recourse, thereby effectively transferring the risk of future credit losses to the purchasers of the securities issued by the trust. However, Citi’s U.S. consumer mortgage business generally retains the servicing rights and in certain instances retains investment securities, interest-only strips and residual interests in future cash flows from the trusts and also provides servicing for a limited number of ICG securitizations.
The Company securitizes mortgage loans generally through either a government-sponsored agency, such as Ginnie Mae, Fannie Mae or Freddie Mac (U.S. agency-sponsored mortgages), or private-label (non-agency-sponsored mortgages) securitization. Citi is not the primary beneficiary of its U.S. agency-sponsored mortgage securitizations because
Citigroup does not have the power to direct the activities of the VIE that most significantly impact the entity’s economic performance. Therefore, Citi does not consolidate these U.S. agency-sponsored mortgage securitizations. Substantially all of the consumer loans sold or securitized through non-consolidated trusts by Citigroup are U.S. prime residential mortgage loans. Retained interests in non-consolidated mortgage securitization trusts are classified as Trading account assets, except for MSRs, which are included in Mortgage servicing rights on Citigroup’s Consolidated Balance Sheet.
Citigroup does not consolidate certain non-agency-sponsored mortgage securitizations because Citi is either not the servicer with the power to direct the significant activities of the entity or Citi is the servicer, but the servicing relationship is deemed to be a fiduciary relationship; therefore, Citi is not deemed to be the primary beneficiary of the entity.
In certain instances, the Company has (i) the power to direct the activities and (ii) the obligation to either absorb losses or the right to receive benefits that could be potentially significant to its non-agency-sponsored mortgage securitizations and, therefore, is the primary beneficiary and, thus, consolidates the VIE.
The following table summarizes selected cash flow information related to Citigroup mortgage securitizations:
|
|
|
|
|
|
|
|
|
|
|
|
|
|
|
|
|
|
|
|
|
2017 |
2016 |
2015 |
In billions of dollars |
U.S. agency-
sponsored
mortgages |
Non-agency-
sponsored
mortgages |
U.S. agency-
sponsored
mortgages |
Non-agency-
sponsored
mortgages |
U.S. agency-
sponsored
mortgages |
Non-agency-
sponsored
mortgages |
Proceeds from new securitizations(1)
|
$ |
33.9 |
|
$ |
7.9 |
|
$ |
41.3 |
|
$ |
11.8 |
|
$ |
35.0 |
|
$ |
12.1 |
|
Contractual servicing fees received |
0.2 |
|
— |
|
0.4 |
|
— |
|
0.5 |
|
— |
|
Cash flows received on retained interests and other net cash flows |
— |
|
— |
|
0.1 |
|
— |
|
0.1 |
|
— |
|
(1) The proceeds from new securitizations in 2016 and 2015 include $0.5 billion and $0.7 billion, respectively, related to personal loan securitizations.
Agency and non-agency securitization gains for the year ended December 31, 2017 were $73 million and $77 million, respectively.
Agency and non-agency securitization gains for the year ended December 31, 2016 were $105 million and $107 million, respectively, and $149 million and $41 million, respectively, for the year ended December 31, 2015.
Key assumptions used in measuring the fair value of retained interests at the date of sale or securitization of mortgage receivables were as follows:
|
|
|
|
|
|
|
|
|
December 31, 2017 |
|
|
Non-agency-sponsored mortgages(1)
|
|
U.S. agency-
sponsored mortgages
|
Senior
interests
|
Subordinated
interests
|
Discount rate |
1.8% to 19.9% |
|
— |
|
— |
|
Weighted average discount rate |
8.6 |
% |
— |
|
— |
|
Constant prepayment rate |
3.8% to 31.6% |
|
— |
|
— |
|
Weighted average constant prepayment rate |
9.4 |
% |
— |
|
— |
|
Anticipated net credit losses(2)
|
NM |
|
— |
|
— |
|
Weighted average anticipated net credit losses |
NM |
|
— |
|
— |
|
Weighted average life |
2.5 to 20.7 years |
|
— |
|
— |
|
|
|
|
|
|
|
|
|
|
December 31, 2016 |
|
|
Non-agency-sponsored mortgages(1)
|
|
U.S. agency-
sponsored mortgages |
Senior
interests |
Subordinated
interests |
Discount rate |
0.8% to 13.7% |
|
— |
|
— |
|
Weighted average discount rate |
9.9 |
% |
— |
|
— |
|
Constant prepayment rate |
3.8% to 30.9% |
|
— |
|
— |
|
Weighted average constant prepayment rate |
11.1 |
% |
— |
|
— |
|
Anticipated net credit losses(2)
|
NM |
|
— |
|
— |
|
Weighted average anticipated net credit losses |
NM |
|
— |
|
— |
|
Weighted average life |
0.5 to 17.5 years |
|
— |
|
— |
|
|
|
(1) |
Disclosure of non-agency-sponsored mortgages as senior and subordinated interests is indicative of the interests’ position in the capital structure of the securitization. |
|
|
(2) |
Anticipated net credit losses represent estimated loss severity associated with defaulted mortgage loans underlying the mortgage securitizations disclosed above. Anticipated net credit losses, in this instance, do not represent total credit losses incurred to date, nor do they represent credit losses expected on retained interests in mortgage securitizations. |
|
|
NM |
Anticipated net credit losses are not meaningful due to U.S. agency guarantees. |
The interests retained by Citi range from highly rated and/or senior in the capital structure to unrated and/or residual interests.
The key assumptions used to value retained interests, and the sensitivity of the fair value to adverse changes of 10% and 20% in each of the key assumptions, are set forth in the tables
below. The negative effect of each change is calculated independently, holding all other assumptions constant. Because the key assumptions may not be independent, the net effect of simultaneous adverse changes in the key assumptions may be less than the sum of the individual effects shown below.
|
|
|
|
|
|
|
|
|
December 31, 2017 |
|
|
Non-agency-sponsored mortgages(1)
|
|
U.S. agency-
sponsored mortgages
|
Senior
interests
|
Subordinated
interests
|
Discount rate |
1.8% to 84.2% |
|
5.8% to 100.0% |
|
2.8% to 35.1% |
|
Weighted average discount rate |
7.1 |
% |
5.8 |
% |
9.0 |
% |
Constant prepayment rate |
6.9% to 27.8% |
|
8.9% to 15.5% |
|
8.6% to 13.1% |
|
Weighted average constant prepayment rate |
11.6 |
% |
8.9 |
% |
10.6 |
% |
Anticipated net credit losses(2)
|
NM |
|
0.4% to 46.9% |
|
35.1% to 52.1% |
|
Weighted average anticipated net credit losses |
NM |
|
46.9 |
% |
44.9 |
% |
Weighted average life |
0.1 to 27.8 years |
|
4.8 to 5.3 years |
|
0.2 to 18.6 years |
|
|
|
|
|
|
|
|
|
|
December 31, 2016 |
|
|
Non-agency-sponsored mortgages(1)
|
|
U.S. agency-
sponsored mortgages
|
Senior
interests
|
Subordinated
interests
|
Discount rate |
0.7% to 28.2% |
|
0.0% to 8.1% |
|
5.1% to 26.4% |
|
Weighted average discount rate |
9.0 |
% |
2.1 |
% |
13.1 |
% |
Constant prepayment rate |
6.8% to 22.8% |
|
4.2% to 14.7% |
|
0.5% to 37.5% |
|
Weighted average constant prepayment rate |
10.2 |
% |
11.0 |
% |
10.8 |
% |
Anticipated net credit losses(2)
|
NM |
|
0.5% to 85.6% |
|
8.0% to 63.7% |
|
Weighted average anticipated net credit losses |
NM |
|
31.4 |
% |
48.3 |
% |
Weighted average life |
0.2 to 28.8 years |
|
5.0 to 8.5 years |
|
1.2 to 12.1 years |
|
|
|
(1) |
Disclosure of non-agency-sponsored mortgages as senior and subordinated interests is indicative of the interests’ position in the capital structure of the securitization. |
|
|
(2) |
Anticipated net credit losses represent estimated loss severity associated with defaulted mortgage loans underlying the mortgage securitizations disclosed above. Anticipated net credit losses, in this instance, do not represent total credit losses incurred to date, nor do they represent credit losses expected on retained interests in mortgage securitizations. |
|
|
NM |
Anticipated net credit losses are not meaningful due to U.S. agency guarantees. |
|
|
|
|
|
|
|
|
|
|
|
|
December 31, 2017 |
|
|
Non-agency-sponsored mortgages |
In millions of dollars |
U.S. agency-
sponsored mortgages
|
Senior
interests
|
Subordinated
interests
|
Carrying value of retained interests(1)
|
$ |
1,634 |
|
$ |
214 |
|
$ |
139 |
|
Discount rates |
|
|
|
Adverse change of 10% |
$ |
(44 |
) |
$ |
(2 |
) |
$ |
(3 |
) |
Adverse change of 20% |
(85 |
) |
(4 |
) |
(5 |
) |
Constant prepayment rate |
|
|
|
Adverse change of 10% |
(41 |
) |
(1 |
) |
(1 |
) |
Adverse change of 20% |
(84 |
) |
(1 |
) |
(2 |
) |
Anticipated net credit losses |
|
|
|
Adverse change of 10% |
NM |
|
(3 |
) |
— |
|
Adverse change of 20% |
NM |
|
(7 |
) |
— |
|
|
|
|
|
|
|
|
|
|
|
|
|
December 31, 2016 |
|
|
Non-agency-sponsored mortgages |
In millions of dollars |
U.S. agency-
sponsored mortgages
|
Senior
interests
|
Subordinated
interests
|
Carrying value of retained interests(1)
|
$ |
2,258 |
|
$ |
26 |
|
$ |
161 |
|
Discount rates |
|
|
|
Adverse change of 10% |
$ |
(71 |
) |
$ |
(7 |
) |
$ |
(8 |
) |
Adverse change of 20% |
(138 |
) |
(14 |
) |
(16 |
) |
Constant prepayment rate |
|
|
|
Adverse change of 10% |
(80 |
) |
(2 |
) |
(4 |
) |
Adverse change of 20% |
(160 |
) |
(3 |
) |
(8 |
) |
Anticipated net credit losses |
|
|
|
Adverse change of 10% |
NM |
|
(7 |
) |
(1 |
) |
Adverse change of 20% |
NM |
|
(14 |
) |
(2 |
) |
|
|
(1) |
Disclosure of non-agency-sponsored mortgages as senior and subordinated interests is indicative of the interests’ position in the capital structure of the securitization. |
|
|
NM |
Anticipated net credit losses are not meaningful due to U.S. agency guarantees. |
Mortgage Servicing Rights
In connection with the securitization of mortgage loans, Citi’s U.S. consumer mortgage business generally retains the servicing rights, which entitle the Company to a future stream of cash flows based on the outstanding principal balances of the loans and the contractual servicing fee. Failure to service the loans in accordance with contractual requirements may lead to a termination of the servicing rights and the loss of future servicing fees.
These transactions create an intangible asset referred to as mortgage servicing rights (MSRs), which are recorded at fair value on Citi’s Consolidated Balance Sheet. The fair value of Citi’s capitalized MSRs was $558 million and $1.6 billion at December 31, 2017 and 2016, respectively. The MSRs correspond to principal loan balances of $66 billion and $168 billion as of December 31, 2017 and 2016, respectively. The following table summarizes the changes in capitalized MSRs:
|
|
|
|
|
|
|
|
In millions of dollars |
2017 |
2016 |
Balance, beginning of year |
$ |
1,564 |
|
$ |
1,781 |
|
Originations |
96 |
|
152 |
|
Changes in fair value of MSRs due to changes in inputs and assumptions |
65 |
|
(36 |
) |
Other changes(1)
|
(110 |
) |
(313 |
) |
Sale of MSRs(2)
|
(1,057 |
) |
(20 |
) |
Balance, as of December 31 |
$ |
558 |
|
$ |
1,564 |
|
|
|
(1) |
Represents changes due to customer payments and passage of time. |
|
|
(2) |
See Note 2 to the Consolidated Financial Statements for more information on the exit of the U.S. mortgage servicing operations and sale of MSRs. 2016 amount includes sales of credit-challenged MSRs for which Citi paid the new servicer. |
The fair value of the MSRs is primarily affected by changes in prepayments of mortgages that result from shifts in mortgage interest rates. Specifically, higher interest rates tend to lead to declining prepayments, which causes the fair value of the MSRs to increase. In managing this risk, Citigroup economically hedges a significant portion of the value of its MSRs through the use of interest rate derivative contracts, forward purchase and sale commitments of mortgage-backed securities and purchased securities all classified as Trading account assets. The Company receives fees during the course of servicing previously securitized mortgages. The amounts of these fees were as follows:
|
|
|
|
|
|
|
|
|
|
|
In millions of dollars |
2017 |
2016 |
2015 |
Servicing fees |
$ |
276 |
|
$ |
484 |
|
$ |
552 |
|
Late fees |
10 |
|
14 |
|
16 |
|
Ancillary fees |
13 |
|
17 |
|
31 |
|
Total MSR fees |
$ |
299 |
|
$ |
515 |
|
$ |
599 |
|
In the Consolidated Statement of Income these fees are primarily classified as Commissions and fees, and changes in MSR fair values are classified as Other revenue.
Citi signed agreements during the first quarter of 2017 to effectively exit its direct U.S. mortgage servicing operations by the end of 2018 to intensify focus on originations. The exit of the mortgage servicing operations included the sale of mortgage servicing rights and execution of a subservicing agreement for the remaining Citi-owned loans and certain other mortgage servicing rights. As part of this transaction, Citi is also transferring certain employees. See Note 2 to the Consolidated Financial Statements for more information on the exit of the U.S. mortgage servicing operations and sale of MSRs.
Re-securitizations
Citigroup engages in re-securitization transactions in which debt securities are transferred to a VIE in exchange for new beneficial interests. Citi did not transfer non-agency (private-label) securities to re-securitization entities during the years ended December 31, 2017 and 2016. These securities are backed by either residential or commercial mortgages and are often structured on behalf of clients.
As of December 31, 2017, the fair value of Citi-retained interests in private-label re-securitization transactions structured by Citi totaled approximately $79 million (all related to re-securitization transactions executed prior to 2016), which has been recorded in Trading account assets. Of this amount, substantially all was related to subordinated beneficial interests. As of December 31, 2016, the fair value of Citi-retained interests in private-label re-securitization transactions structured by Citi totaled approximately $126 million (all related to re-securitization transactions executed prior to 2016). Of this amount, substantially all was related to subordinated beneficial interests. The original par value of private-label re-securitization transactions in which Citi holds a retained interest as of December 31, 2017 and 2016 was approximately $887 million and $1.3 billion, respectively.
The Company also re-securitizes U.S. government-agency guaranteed mortgage-backed (agency) securities. During the years ended December 31, 2017 and 2016, Citi transferred
agency securities with a fair value of approximately $26.6 billion and $26.5 billion, respectively, to re-securitization entities.
As of December 31, 2017, the fair value of Citi-retained interests in agency re-securitization transactions structured by Citi totaled approximately $2.1 billion (including $854 million related to re-securitization transactions executed in 2017) compared to $2.3 billion as of December 31, 2016 (including $741 million related to re-securitization transactions executed in 2016), which is recorded in Trading account assets. The original fair value of agency re-securitization transactions in which Citi holds a retained interest as of December 31, 2017 and 2016 was approximately $68.3 billion and $71.8 billion, respectively.
As of December 31, 2017 and 2016, the Company did not consolidate any private-label or agency re-securitization entities.
Citi-Administered Asset-Backed Commercial Paper Conduits
The Company is active in the asset-backed commercial paper conduit business as administrator of several multi-seller commercial paper conduits and also as a service provider to single-seller and other commercial paper conduits sponsored by third parties.
Citi’s multi-seller commercial paper conduits are designed to provide the Company’s clients access to low-cost funding in the commercial paper markets. The conduits purchase assets from or provide financing facilities to clients and are funded by issuing commercial paper to third-party investors. The conduits generally do not purchase assets originated by Citi. The funding of the conduits is facilitated by the liquidity support and credit enhancements provided by the Company.
As administrator to Citi’s conduits, the Company is generally responsible for selecting and structuring assets purchased or financed by the conduits, making decisions regarding the funding of the conduits, including determining the tenor and other features of the commercial paper issued, monitoring the quality and performance of the conduits’ assets and facilitating the operations and cash flows of the conduits. In return, the Company earns structuring fees from customers for individual transactions and earns an administration fee from the conduit, which is equal to the income from the client program and liquidity fees of the conduit after payment of conduit expenses. This administration fee is fairly stable, since most risks and rewards of the underlying assets are passed back to the clients. Once the asset pricing is negotiated, most ongoing income, costs and fees are relatively stable as a percentage of the conduit’s size.
The conduits administered by Citi do not generally invest in liquid securities that are formally rated by third parties. The assets are privately negotiated and structured transactions that are generally designed to be held by the conduit, rather than actively traded and sold. The yield earned by the conduit on each asset is generally tied to the rate on the commercial paper issued by the conduit, thus passing interest rate risk to the client. Each asset purchased by the conduit is structured with transaction-specific credit enhancement features provided by the third-party client seller, including over-collateralization, cash and excess spread collateral accounts, direct recourse or third-party guarantees. These credit enhancements are sized
with the objective of approximating a credit rating of A or above, based on Citi’s internal risk ratings. At December 31, 2017 and 2016, the conduits had approximately $19.3 billion and $19.7 billion of purchased assets outstanding, respectively, and had incremental funding commitments with clients of approximately $14.5 billion and $12.8 billion, respectively.
Substantially all of the funding of the conduits is in the form of short-term commercial paper. At December 31, 2017 and 2016, the weighted average remaining lives of the commercial paper issued by the conduits were approximately 51 and 55 days, respectively.
The primary credit enhancement provided to the conduit investors is in the form of transaction-specific credit enhancements described above. In addition to the transaction-specific credit enhancements, the conduits, other than the government guaranteed loan conduit, have obtained a letter of credit from the Company, which is equal to at least 8% to 10% of the conduit’s assets with a minimum of $200 million. The letters of credit provided by the Company to the conduits total approximately $1.7 billion and $1.8 billion as of December 31, 2017 and 2016, respectively. The net result across multi-seller conduits administered by the Company is that, in the event defaulted assets exceed the transaction-specific credit enhancements described above, any losses in each conduit are allocated first to the Company and then to the commercial paper investors.
Citigroup also provides the conduits with two forms of liquidity agreements that are used to provide funding to the conduits in the event of a market disruption, among other events. Each asset of the conduits is supported by a transaction-specific liquidity facility in the form of an asset purchase agreement (APA). Under the APA, the Company has generally agreed to purchase non-defaulted eligible receivables from the conduit at par. The APA is not designed to provide credit support to the conduit, as it generally does not permit the purchase of defaulted or impaired assets. Any funding under the APA will likely subject the underlying conduit clients to increased interest costs. In addition, the Company provides the conduits with program-wide liquidity in the form of short-term lending commitments. Under these commitments, the Company has agreed to lend to the conduits in the event of a short-term disruption in the commercial paper market, subject to specified conditions. The Company receives fees for providing both types of liquidity agreements and considers these fees to be on fair market terms.
Finally, Citi is one of several named dealers in the commercial paper issued by the conduits and earns a market-based fee for providing such services. Along with third-party dealers, the Company makes a market in the commercial paper and may from time to time fund commercial paper pending sale to a third party. On specific dates with less liquidity in the market, the Company may hold in inventory commercial paper issued by conduits administered by the Company, as well as conduits administered by third parties. Separately, in the normal course of business, Citi purchases commercial paper, including commercial paper issued by Citigroup's conduits. At December 31, 2017 and 2016, the Company owned $9.3 billion and $9.7 billion, respectively, of the commercial paper issued by its administered conduits. The Company's purchases
were not driven by market illiquidity and, other than the amounts required to be held pursuant to credit risk retention rules, the Company is not obligated under any agreement to purchase the commercial paper issued by the conduits.
The asset-backed commercial paper conduits are consolidated by Citi. The Company has determined that, through its roles as administrator and liquidity provider, it has the power to direct the activities that most significantly impact the entities’ economic performance. These powers include its ability to structure and approve the assets purchased by the conduits, its ongoing surveillance and credit mitigation activities, its ability to sell or repurchase assets out of the conduits and its liability management. In addition, as a result of all the Company’s involvement described above, it was concluded that Citi has an economic interest that could potentially be significant. However, the assets and liabilities of the conduits are separate and apart from those of Citigroup. No assets of any conduit are available to satisfy the creditors of Citigroup or any of its other subsidiaries.
Collateralized Loan Obligations
A collateralized loan obligation (CLO) is a VIE that purchases a portfolio of assets consisting primarily of non-investment grade corporate loans. CLOs issue multiple tranches of debt and equity to investors to fund the asset purchases and pay upfront expenses associated with forming the CLO. A third-party asset manager is contracted by the CLO to purchase the underlying assets from the open market and monitor the credit risk associated with those assets. Over the term of a CLO, the asset manager directs purchases and sales of assets in a manner consistent with the CLO’s asset management agreement and indenture. In general, the CLO asset manager will have the power to direct the activities of the entity that most significantly impact the economic performance of the CLO. Investors in a CLO, through their ownership of debt and/or equity in it, can also direct certain activities of the CLO, including removing its asset manager under limited circumstances, optionally redeeming the notes, voting on amendments to the CLO’s operating documents and other activities. A CLO has a finite life, typically 12 years.
Citi serves as a structuring and placement agent with respect to the CLOs. Typically, the debt and equity of the CLOs are sold to third-party investors. On occasion, certain Citi entities may purchase some portion of a CLO’s liabilities for investment purposes. In addition, Citi may purchase, typically in the secondary market, certain securities issued by the CLOs to support its market making activities.
The Company does not generally have the power to direct the activities that most significantly impact the economic performance of the CLOs, as this power is generally held by a third-party asset manager of the CLO. As such, those CLOs are not consolidated.
The following table summarizes selected cash flow information related to Citigroup CLOs:
|
|
|
|
|
|
|
|
|
|
|
In billions of dollars |
2017 |
2016 |
2015 |
Proceeds from new securitizations |
$ |
3.5 |
|
$ |
5.0 |
|
$ |
5.9 |
|
Cash flows received on retained interests and other net cash flows |
0.1 |
|
— |
|
— |
|
The key assumptions used to value retained interests in CLOs, and the sensitivity of the fair value to adverse changes of 10% and 20%, are set forth in the tables below:
|
|
|
|
|
Dec. 31, 2017 |
Dec. 31, 2016 |
Discount rate |
1.1% to 1.6% |
1.3% to 1.7% |
|
|
|
|
|
|
|
|
In millions of dollars |
Dec. 31, 2017 |
Dec. 31, 2016 |
Carrying value of retained interests |
$ |
3,607 |
|
$ |
4,261 |
|
Discount rates |
|
|
Adverse change of 10% |
$ |
(24 |
) |
$ |
(30 |
) |
Adverse change of 20% |
(47 |
) |
(62 |
) |
Asset-Based Financing
The Company provides loans and other forms of financing to VIEs that hold assets. Those loans are subject to the same credit approvals as all other loans originated or purchased by the Company. Financings in the form of debt securities or derivatives are, in most circumstances, reported in Trading account assets and accounted for at fair value through earnings. The Company generally does not have the power to direct the activities that most significantly impact these VIEs’ economic performance; thus, it does not consolidate them.
The primary types of Citi’s asset-based financings, total assets of the unconsolidated VIEs with significant involvement and Citi’s maximum exposure to loss are shown below. For Citi to realize the maximum loss, the VIE (borrower) would have to default with no recovery from the assets held by the VIE.
|
|
|
|
|
|
|
|
|
December 31, 2017 |
In millions of dollars |
Total
unconsolidated
VIE assets
|
Maximum
exposure to
unconsolidated VIEs
|
Type |
|
|
Commercial and other real estate |
$ |
15,370 |
|
$ |
5,445 |
|
Corporate loans |
4,725 |
|
3,587 |
|
Hedge funds and equities |
542 |
|
58 |
|
Airplanes, ships and other assets |
39,202 |
|
16,849 |
|
Total |
$ |
59,839 |
|
$ |
25,939 |
|
|
|
|
|
|
|
|
|
|
December 31, 2016 |
In millions of dollars |
Total
unconsolidated
VIE assets
|
Maximum
exposure to
unconsolidated VIEs
|
Type |
|
|
Commercial and other real estate |
$ |
8,784 |
|
$ |
2,368 |
|
Corporate loans |
4,051 |
|
2,684 |
|
Hedge funds and equities |
370 |
|
54 |
|
Airplanes, ships and other assets |
39,230 |
|
16,837 |
|
Total |
$ |
52,435 |
|
$ |
21,943 |
|
Municipal Securities Tender Option Bond (TOB) Trusts
Municipal TOB trusts may hold fixed- or floating-rate, taxable or tax-exempt securities issued by state and local governments and municipalities. TOB trusts are typically structured as single-issuer entities whose assets are purchased from either the Company or from other investors in the municipal securities market. TOB trusts finance the purchase of their municipal assets by issuing two classes of certificates: long-dated, floating rate certificates (“Floaters”) that are putable pursuant to a liquidity facility and residual interest certificates (“Residuals”). The Floaters are purchased by third-party investors, typically tax-exempt money market funds. The Residuals are purchased by the original owner of the municipal securities that are being financed.
From the Citigroup’s perspective, there are two types of TOB trusts: customer and non-customer. Customer TOB trusts are those trusts utilized by customers of the Company to finance their municipal securities investments. The Residuals issued by these trusts are purchased by the customer being financed. Non-customer TOB trusts are used by the Company to finance its own municipal securities investments; the Residuals issued by non-customer TOB trusts are purchased by the Company.
With respect to both customer and non-customer TOB trusts, Citi may provide remarketing agent services. If Floaters are optionally tendered and the Company, in its role as remarketing agent, is unable to find a new investor to purchase the optionally tendered Floaters within a specified period of time, Citigroup may, but is not obligated to, purchase the tendered Floaters into its own inventory. The level of the Company’s inventory of such Floaters fluctuates.
For certain customer TOB trusts, Citi may also serve as a voluntary advance provider. In this capacity, the Company may, but is not obligated to, make loan advances to customer TOB trusts to purchase optionally tendered Floaters that have not otherwise been successfully remarketed to new investors. Such loans are secured by pledged Floaters. As of December 31, 2017, Citi had no outstanding voluntary advances to customer TOB trusts.
For certain non-customer trusts, the Company also provides credit enhancement. At December 31, 2017 and 2016, approximately $62 million and $82 million, respectively, of the municipal bonds owned by non-customer TOB trusts were subject to a credit guarantee provided by the Company.
Citigroup also provides liquidity services to many customer and non-customer trusts. If a trust is unwound early due to an event other than a credit event on the underlying municipal bonds, the underlying municipal bonds are sold out of the trust and bond sale proceeds are used to redeem the outstanding trust certificates. If this results in a shortfall between the bond sale proceeds and the redemption price of the tendered Floaters, the Company, pursuant to the liquidity agreement, would be obligated to make a payment to the trust to satisfy that shortfall. For certain customer TOB trusts, Citigroup has also executed a reimbursement agreement with the holder of the Residual, pursuant to which the Residual holder is obligated to reimburse the Company for any payment the Company makes under the liquidity arrangement. These reimbursement agreements may be subject to daily margining
based on changes in the market value of the underlying municipal bonds. In cases where a third party provides liquidity to a non-customer TOB trust, a similar reimbursement arrangement may be executed, whereby the Company (or a consolidated subsidiary of the Company), as Residual holder, would absorb any losses incurred by the liquidity provider.
For certain other non-customer TOB trusts, Citi serves as tender option provider. The tender option provider arrangement allows Floater holders to put their interests directly to the Company at any time, subject to the requisite notice period requirements, at a price of par.
At December 31, 2017 and 2016, liquidity agreements provided with respect to customer TOB trusts totaled $3.2 billion and $2.9 billion, respectively, of which $2.0 billion and $2.1 billion, respectively, were offset by reimbursement agreements. For the remaining exposure related to TOB transactions, where the residual owned by the customer was at least 25% of the bond value at the inception of the transaction, no reimbursement agreement was executed.
Citi considers both customer and non-customer TOB trusts to be VIEs. Customer TOB trusts are not consolidated by the Company, as the power to direct the activities that most significantly impact the trust’s economic performance rests with the customer Residual holder, which may unilaterally cause the sale of the trust’s bonds.
Non-customer TOB trusts generally are consolidated because the Company holds the Residual interest and thus has the unilateral power to cause the sale of the trust’s bonds.
The Company also provides other liquidity agreements or letters of credit to customer-sponsored municipal investment funds, which are not variable interest entities, and municipality-related issuers that totaled $6.1 billion and $7.4 billion as of December 31, 2017 and 2016, respectively. These liquidity agreements and letters of credit are offset by reimbursement agreements with various term-out provisions.
Municipal Investments
Municipal investment transactions include debt and equity interests in partnerships that finance the construction and rehabilitation of low-income housing, facilitate lending in new or underserved markets or finance the construction or operation of renewable municipal energy facilities. Citi generally invests in these partnerships as a limited partner and earns a return primarily through the receipt of tax credits and grants earned from the investments made by the partnership. The Company may also provide construction loans or permanent loans for the development or operation of real estate properties held by partnerships. These entities are generally considered VIEs. The power to direct the activities of these entities is typically held by the general partner. Accordingly, these entities are not consolidated by Citigroup.
Client Intermediation
Client intermediation transactions represent a range of transactions designed to provide investors with specified returns based on the returns of an underlying security, referenced asset or index. These transactions include credit-linked notes and equity-linked notes. In these transactions, the VIE typically obtains exposure to the underlying security, referenced asset or index through a derivative instrument, such as a total-return swap or a credit-default swap. In turn, the VIE issues notes to investors that pay a return based on the specified underlying security, referenced asset or index. The VIE invests the proceeds in a financial asset or a guaranteed insurance contract that serves as collateral for the derivative contract over the term of the transaction. The Company’s involvement in these transactions includes being the counterparty to the VIE’s derivative instruments and investing in a portion of the notes issued by the VIE. In certain transactions, the investor’s maximum risk of loss is limited and the Company absorbs risk of loss above a specified level. Citi does not have the power to direct the activities of the VIEs that most significantly impact their economic performance and thus it does not consolidate them.
Citi’s maximum risk of loss in these transactions is defined as the amount invested in notes issued by the VIE and the notional amount of any risk of loss absorbed by Citi through a separate instrument issued by the VIE. The derivative instrument held by the Company may generate a receivable from the VIE (for example, where the Company purchases credit protection from the VIE in connection with the VIE’s issuance of a credit-linked note), which is collateralized by the assets owned by the VIE. These derivative instruments are not considered variable interests and any associated receivables are not included in the calculation of maximum exposure to the VIE.
The proceeds from new securitizations related to Citi’s client intermediation transactions for the years ended December 31, 2017 and 2016 totaled approximately $1.1 billion and $2.3 billion, respectively.
Investment Funds
The Company is the investment manager for certain investment funds and retirement funds that invest in various asset classes including private equity, hedge funds, real estate, fixed income and infrastructure. Citigroup earns a management fee, which is a percentage of capital under management, and may earn performance fees. In addition, for some of these funds the Company has an ownership interest in the investment funds. Citi has also established a number of investment funds as opportunities for qualified employees to invest in private equity investments. The Company acts as investment manager for these funds and may provide employees with financing on both recourse and non-recourse bases for a portion of the employees’ investment commitments.
22. DERIVATIVES ACTIVITIES
In the ordinary course of business, Citigroup enters into various types of derivative transactions, which include:
|
|
• |
Futures and forward contracts, which are commitments to buy or sell at a future date a financial instrument, commodity or currency at a contracted price and may be settled in cash or through delivery of an item readily convertible to cash.
|
|
|
• |
Swap contracts, which are commitments to settle in cash at a future date or dates that may range from a few days to a number of years, based on differentials between specified indices or financial instruments, as applied to a notional principal amount.
|
|
|
• |
Option contracts, which give the purchaser, for a premium, the right, but not the obligation, to buy or sell within a specified time a financial instrument, commodity or currency at a contracted price that may also be settled in cash, based on differentials between specified indices or prices.
|
Swaps, forwards and some option contracts are over-the-counter (OTC) derivatives that are bilaterally negotiated with counterparties and settled with those counterparties, except for swap contracts that are novated and "cleared" through central counterparties (CCPs). Futures contracts and other option contracts are standardized contracts that are traded on an exchange with a CCP as the counterparty from the inception of the transaction. Citigroup enters into derivative contracts relating to interest rate, foreign currency, commodity and other market/credit risks for the following reasons:
|
|
• |
Trading Purposes: Citigroup trades derivatives as an active market maker. Citigroup offers its customers derivatives in connection with their risk management actions to transfer, modify or reduce their interest rate, foreign exchange and other market/credit risks or for their own trading purposes. Citigroup also manages its derivative risk positions through offsetting trade activities, controls focused on price verification and daily reporting of positions to senior managers.
|
|
|
• |
Hedging: Citigroup uses derivatives in connection with its own risk management activities to hedge certain risks or reposition the risk profile of the Company. Hedging may be accomplished by applying hedge accounting in accordance with ASC 815, Derivatives and Hedging, or by an economic hedge. For example, Citigroup issues fixed-rate long-term debt and then enters into a receive-fixed, pay-variable-rate interest rate swap with the same tenor and notional amount to synthetically convert the interest payments to a net variable-rate basis. This strategy is the most common form of an interest rate hedge, as it minimizes net interest cost in certain yield curve environments. Derivatives are also used to manage market risks inherent in specific groups of on-balance sheet assets and liabilities, including AFS securities, commodities and borrowings, as well as other interest-sensitive assets and liabilities. In addition, foreign exchange contracts are used to hedge non-U.S.-dollar-
|
denominated debt, foreign currency-denominated AFS securities and net investment exposures.
Derivatives may expose Citigroup to market, credit or liquidity risks in excess of the amounts recorded on the Consolidated Balance Sheet. Market risk on a derivative product is the exposure created by potential fluctuations in interest rates, market prices, foreign exchange rates and other factors and is a function of the type of product, the volume of transactions, the tenor and terms of the agreement and the underlying volatility. Credit risk is the exposure to loss in the event of nonperformance by the other party to satisfy a derivative liability where the value of any collateral held by Citi is not adequate to cover such losses. The recognition in earnings of unrealized gains on derivative transactions is subject to management’s assessment of the probability of counterparty default. Liquidity risk is the potential exposure that arises when the size of a derivative position may affect the ability to monetize the position in a reasonable period of time and at a reasonable cost in periods of high volatility and financial stress.
Derivative transactions are customarily documented under industry standard master netting agreements, which provide that following an event of default, the non-defaulting party may promptly terminate all transactions between the parties and determine the net amount due to be paid to, or by, the defaulting party. Events of default include (i) failure to make a payment on a derivatives transaction that remains uncured following applicable notice and grace periods, (ii) breach of agreement that remains uncured after applicable notice and grace periods, (iii) breach of a representation, (iv) cross default, either to third-party debt or to other derivative transactions entered into between the parties, or, in some cases, their affiliates, (v) the occurrence of a merger or consolidation which results in a party’s becoming a materially weaker credit and (vi) the cessation or repudiation of any applicable guarantee or other credit support document. Obligations under master netting agreements are often secured by collateral posted under an industry standard credit support annex to the master netting agreement. An event of default may also occur under a credit support annex if a party fails to make a collateral delivery that remains uncured following applicable notice and grace periods.
The netting and collateral rights incorporated in the master netting agreements are considered to be legally enforceable if a supportive legal opinion has been obtained from counsel of recognized standing that provides (i) the requisite level of certainty regarding enforceability, and (ii) that the exercise of rights by the non-defaulting party to terminate and close-out transactions on a net basis under these agreements will not be stayed or avoided under applicable law upon an event of default, including bankruptcy, insolvency or similar proceeding.
A legal opinion may not be sought for certain jurisdictions where local law is silent or unclear as to the enforceability of such rights or where adverse case law or conflicting regulation may cast doubt on the enforceability of such rights. In some jurisdictions and for some counterparty types, the insolvency law may not provide the requisite level of certainty. For
example, this may be the case for certain sovereigns, municipalities, central banks and U.S. pension plans.
Exposure to credit risk on derivatives is affected by market volatility, which may impair the ability of counterparties to satisfy their obligations to the Company. Credit limits are established and closely monitored for customers engaged in derivatives transactions. Citi considers the level of legal certainty regarding enforceability of its offsetting rights under master netting agreements and credit support annexes to be an important factor in its risk management process. Specifically, Citi generally transacts much lower volumes of derivatives under master netting agreements where Citi does not have the requisite level of legal certainty regarding enforceability, because such derivatives consume greater amounts of single counterparty credit limits than those executed under enforceable master netting agreements.
Cash collateral and security collateral in the form of G10 government debt securities are often posted by a party to a master netting agreement to secure the net open exposure of the other party; the receiving party is free to commingle/rehypothecate such collateral in the ordinary course of its business. Nonstandard collateral such as corporate bonds, municipal bonds, U.S. agency securities and/or MBS may also be pledged as collateral for derivative transactions. Security collateral posted to open and maintain a master netting agreement with a counterparty, in the form of cash and/or securities, may from time to time be segregated in an account at a third-party custodian pursuant to a tri-party account control agreement.
Information pertaining to Citigroup’s derivative activities, based on notional amounts, is presented in the table below. Derivative notional amounts are reference amounts from which contractual payments are derived and do not represent a complete and accurate measure of Citi’s exposure to derivative transactions. Rather, Citi’s derivative exposure arises primarily from market fluctuations (i.e., market risk), counterparty failure (i.e., credit risk) and/or periods of high volatility or financial stress (i.e., liquidity risk), as well as any market valuation adjustments that may be required on the
transactions. Moreover, notional amounts do not reflect the netting of offsetting trades. For example, if Citi enters into a receive-fixed interest rate swap with $100 million notional, and offsets this risk with an identical but opposite pay-fixed position with a different counterparty, $200 million in derivative notionals is reported, although these offsetting positions may result in de minimis overall market risk. Aggregate derivative notional amounts can fluctuate from period to period in the normal course of business based on Citi’s market share, levels of client activity and other factors.
Derivative Notionals
|
|
|
|
|
|
|
|
|
|
|
|
|
|
|
|
|
|
|
|
|
Hedging instruments under
ASC 815(1)(2)
|
Other derivative instruments |
|
|
|
Trading derivatives |
Management hedges(3)
|
In millions of dollars |
December 31,
2017 |
December 31,
2016 |
December 31,
2017 |
December 31,
2016 |
December 31,
2017 |
December 31,
2016 |
Interest rate contracts |
|
|
|
|
|
|
Swaps |
$ |
189,779 |
|
$ |
151,331 |
|
$ |
18,718,224 |
|
$ |
19,145,250 |
|
$ |
35,995 |
|
$ |
47,324 |
|
Futures and forwards |
— |
|
97 |
|
6,447,886 |
|
6,864,276 |
|
12,653 |
|
30,834 |
|
Written options |
— |
|
— |
|
3,513,759 |
|
2,921,070 |
|
2,372 |
|
4,759 |
|
Purchased options |
— |
|
— |
|
3,230,915 |
|
2,768,528 |
|
3,110 |
|
7,320 |
|
Total interest rate contract notionals |
$ |
189,779 |
|
$ |
151,428 |
|
$ |
31,910,784 |
|
$ |
31,699,124 |
|
$ |
54,130 |
|
$ |
90,237 |
|
Foreign exchange contracts |
|
|
|
|
|
|
Swaps |
$ |
37,162 |
|
$ |
19,042 |
|
$ |
5,538,231 |
|
$ |
5,492,145 |
|
$ |
38,126 |
|
$ |
22,676 |
|
Futures, forwards and spot |
33,103 |
|
56,964 |
|
3,080,361 |
|
3,251,132 |
|
17,339 |
|
3,419 |
|
Written options |
3,951 |
|
— |
|
1,127,728 |
|
1,194,325 |
|
— |
|
— |
|
Purchased options |
6,427 |
|
— |
|
1,148,686 |
|
1,215,961 |
|
— |
|
— |
|
Total foreign exchange contract notionals |
$ |
80,643 |
|
$ |
76,006 |
|
$ |
10,895,006 |
|
$ |
11,153,563 |
|
$ |
55,465 |
|
$ |
26,095 |
|
Equity contracts |
|
|
|
|
|
|
Swaps |
$ |
— |
|
$ |
— |
|
$ |
215,834 |
|
$ |
192,366 |
|
$ |
— |
|
$ |
— |
|
Futures and forwards |
— |
|
— |
|
72,616 |
|
37,557 |
|
— |
|
— |
|
Written options |
— |
|
— |
|
389,961 |
|
304,579 |
|
— |
|
— |
|
Purchased options |
— |
|
— |
|
328,154 |
|
266,070 |
|
— |
|
— |
|
Total equity contract notionals |
$ |
— |
|
$ |
— |
|
$ |
1,006,565 |
|
$ |
800,572 |
|
$ |
— |
|
$ |
— |
|
Commodity and other contracts |
|
|
|
|
|
|
Swaps |
$ |
— |
|
$ |
— |
|
$ |
82,039 |
|
$ |
70,774 |
|
$ |
— |
|
$ |
— |
|
Futures and forwards |
23 |
|
182 |
|
153,248 |
|
142,530 |
|
— |
|
— |
|
Written options |
— |
|
— |
|
62,045 |
|
74,627 |
|
— |
|
— |
|
Purchased options |
— |
|
— |
|
60,526 |
|
69,629 |
|
— |
|
— |
|
Total commodity and other contract notionals |
$ |
23 |
|
$ |
182 |
|
$ |
357,858 |
|
$ |
357,560 |
|
$ |
— |
|
$ |
— |
|
Credit derivatives(4)
|
|
|
|
|
|
|
Protection sold |
$ |
— |
|
$ |
— |
|
$ |
735,142 |
|
$ |
859,420 |
|
$ |
— |
|
$ |
— |
|
Protection purchased |
— |
|
— |
|
766,565 |
|
883,003 |
|
11,148 |
|
19,470 |
|
Total credit derivatives |
$ |
— |
|
$ |
— |
|
$ |
1,501,707 |
|
$ |
1,742,423 |
|
$ |
11,148 |
|
$ |
19,470 |
|
Total derivative notionals |
$ |
270,445 |
|
$ |
227,616 |
|
$ |
45,671,920 |
|
$ |
45,753,242 |
|
$ |
120,743 |
|
$ |
135,802 |
|
|
|
(1) |
The notional amounts presented in this table do not include hedge accounting relationships under ASC 815 where Citigroup is hedging the foreign currency risk of a net investment in a foreign operation by issuing a foreign currency-denominated debt instrument. The notional amount of such debt was $63 million and $1,825 million at December 31, 2017 and December 31, 2016, respectively.
|
|
|
(2) |
Derivatives in hedge accounting relationships accounted for under ASC Topic 815 are recorded in either Other assets/Other liabilities or Trading account assets/Trading account liabilities on the Consolidated Balance Sheet.
|
|
|
(3) |
Management hedges represent derivative instruments used to mitigate certain economic risks, but for which hedge accounting is not applied. These derivatives are recorded in either Other assets/Other liabilities or Trading account assets/Trading account liabilities on the Consolidated Balance Sheet.
|
|
|
(4) |
Credit derivatives are arrangements designed to allow one party (protection buyer) to transfer the credit risk of a “reference asset” to another party (protection seller). These arrangements allow a protection seller to assume the credit risk associated with the reference asset without directly purchasing that asset. The |
Company enters into credit derivative positions for purposes such as risk management, yield enhancement, reduction of credit concentrations and diversification of overall risk.
The following tables present the gross and net fair values of the Company’s derivative transactions and the related offsetting amounts as of December 31, 2017 and December 31, 2016. Gross positive fair values are offset against gross negative fair values by counterparty pursuant to enforceable master netting agreements. Under ASC 815-10-45, payables and receivables in respect of cash collateral received from or paid to a given counterparty pursuant to a credit support annex are included in the offsetting amount if a legal opinion supporting the enforceability of netting and collateral rights has been obtained. GAAP does not permit similar offsetting for security collateral.
In addition, the table for December 31, 2017 reflects rule changes adopted by clearing organizations that require or
allow entities to elect to treat derivative assets, liabilities and the related variation margin as settlement of the related derivative fair values for legal and accounting purposes, as opposed to presenting gross derivative assets and liabilities
that are subject to collateral, whereby the counterparties would record a related collateral payable or receivable. As a result, the table for December 31, 2017 reflects a reduction of approximately $100 billion of derivative assets and derivative liabilities that previously would have been reported on a gross basis, but are now settled and not subject to collateral. The table for December 31, 2016 presents derivative assets and liabilities as gross amounts subject to variation margin collateral that were netted under enforceable master netting agreements. Therefore, the net presentation of the affected items on the consolidated balance sheet is consistent for all periods. The tables also present amounts that are not permitted to be offset, such as security collateral or cash collateral posted at third-party custodians, but which would be eligible for offsetting to the extent an event of default occurred and a legal opinion supporting enforceability of the netting and collateral rights has been obtained.
Derivative Mark-to-Market (MTM) Receivables/Payables
|
|
|
|
|
|
|
|
|
|
|
|
|
|
In millions of dollars at December 31, 2017 |
Derivatives classified
in Trading account
assets/liabilities(1)(2)(3)
|
Derivatives classified
in Other
assets/liabilities(2)(3)
|
Derivatives instruments designated as ASC 815 hedges |
Assets |
Liabilities |
Assets |
Liabilities |
Over-the-counter |
$ |
644 |
|
$ |
121 |
|
$ |
1,325 |
|
$ |
13 |
|
Cleared |
71 |
|
24 |
|
39 |
|
68 |
|
Interest rate contracts |
$ |
715 |
|
$ |
145 |
|
$ |
1,364 |
|
$ |
81 |
|
Over-the-counter |
$ |
885 |
|
$ |
1,064 |
|
$ |
258 |
|
$ |
86 |
|
Foreign exchange contracts |
$ |
885 |
|
$ |
1,064 |
|
$ |
258 |
|
$ |
86 |
|
Total derivative instruments designated as ASC 815 hedges |
$ |
1,600 |
|
$ |
1,209 |
|
$ |
1,622 |
|
$ |
167 |
|
Derivatives instruments not designated as ASC 815 hedges |
|
|
|
|
Over-the-counter |
$ |
195,648 |
|
$ |
173,921 |
|
$ |
29 |
|
$ |
16 |
|
Cleared |
7,051 |
|
10,268 |
|
78 |
|
113 |
|
Exchange traded |
102 |
|
95 |
|
— |
|
— |
|
Interest rate contracts |
$ |
202,801 |
|
$ |
184,284 |
|
$ |
107 |
|
$ |
129 |
|
Over-the-counter |
$ |
118,611 |
|
$ |
116,962 |
|
$ |
481 |
|
$ |
511 |
|
Cleared |
1,690 |
|
2,028 |
|
— |
|
— |
|
Exchange traded |
34 |
|
121 |
|
— |
|
— |
|
Foreign exchange contracts |
$ |
120,335 |
|
$ |
119,111 |
|
$ |
481 |
|
$ |
511 |
|
Over-the-counter |
$ |
17,221 |
|
$ |
21,201 |
|
$ |
— |
|
$ |
— |
|
Cleared |
21 |
|
25 |
|
— |
|
— |
|
Exchange traded |
9,736 |
|
10,147 |
|
— |
|
— |
|
Equity contracts |
$ |
26,978 |
|
$ |
31,373 |
|
$ |
— |
|
$ |
— |
|
Over-the-counter |
$ |
13,499 |
|
$ |
16,362 |
|
$ |
— |
|
$ |
— |
|
Exchange traded |
604 |
|
665 |
|
— |
|
— |
|
Commodity and other contracts |
$ |
14,103 |
|
$ |
17,027 |
|
$ |
— |
|
$ |
— |
|
Over-the-counter |
$ |
12,954 |
|
$ |
12,895 |
|
$ |
18 |
|
$ |
63 |
|
Cleared |
7,530 |
|
8,327 |
|
32 |
|
248 |
|
Credit derivatives |
$ |
20,484 |
|
$ |
21,222 |
|
$ |
50 |
|
$ |
311 |
|
Total derivatives instruments not designated as ASC 815 hedges |
$ |
384,701 |
|
$ |
373,017 |
|
$ |
638 |
|
$ |
951 |
|
Total derivatives |
$ |
386,301 |
|
$ |
374,226 |
|
$ |
2,260 |
|
$ |
1,118 |
|
Cash collateral paid/received(4)(5)
|
$ |
7,541 |
|
$ |
14,296 |
|
$ |
— |
|
$ |
12 |
|
Less: Netting agreements(6)
|
(306,401 |
) |
(306,401 |
) |
— |
|
— |
|
Less: Netting cash collateral received/paid(7)
|
(37,506 |
) |
(35,659 |
) |
(1,026 |
) |
(7 |
) |
Net receivables/payables included on the Consolidated Balance Sheet(8)
|
$ |
49,935 |
|
$ |
46,462 |
|
$ |
1,234 |
|
$ |
1,123 |
|
Additional amounts subject to an enforceable master netting agreement, but not offset on the Consolidated Balance Sheet |
|
|
|
|
Less: Cash collateral received/paid |
$ |
(872 |
) |
$ |
(121 |
) |
$ |
— |
|
$ |
— |
|
Less: Non-cash collateral received/paid |
(12,453 |
) |
(6,929 |
) |
(286 |
) |
— |
|
Total net receivables/payables(8)
|
$ |
36,610 |
|
$ |
39,412 |
|
$ |
948 |
|
$ |
1,123 |
|
|
|
(1) |
The trading derivatives fair values are presented in Note 24 to the Consolidated Financial Statements. |
|
|
(2) |
Derivative mark-to-market receivables/payables related to management hedges are recorded in either Other assets/Other liabilities or Trading account assets/Trading account liabilities.
|
|
|
(3) |
Over-the-counter (OTC) derivatives are derivatives executed and settled bilaterally with counterparties without the use of an organized exchange or central clearing house. Cleared derivatives include derivatives executed bilaterally with a counterparty in the OTC market, but then novated to a central clearing house, whereby the central clearing house becomes the counterparty to both of the original counterparties. Exchange traded derivatives include derivatives executed directly on an organized exchange that provides pre-trade price transparency. |
|
|
(4) |
For the trading account assets/liabilities, reflects the net amount of the $43,200 million and $51,801 million of gross cash collateral paid and received, respectively. Of the gross cash collateral paid, $35,659 million was used to offset trading derivative liabilities and, of the gross cash collateral received, $37,506 million was used to offset trading derivative assets.
|
|
|
(5) |
For cash collateral paid with respect to non-trading derivative assets, reflects the net amount of $7 million of gross cash collateral paid, of which $7 million is netted against non-trading derivative positions within Other liabilities. For cash collateral received with respect to non-trading derivative liabilities, reflects the net amount of $1,038 million of gross cash collateral received, of which $1,026 million is netted against OTC non-trading derivative positions within Other assets.
|
|
|
(6) |
Represents the netting of derivative receivable and payable balances with the same counterparty under enforceable netting agreements. Approximately $283 billion, $14 billion and $9 billion of the netting against trading account asset/liability balances is attributable to each of the OTC, cleared and exchange traded derivatives, respectively.
|
|
|
(7) |
Represents the netting of cash collateral paid and received by counterparty under enforceable credit support agreements. Substantially all cash collateral received and paid is netted against OTC derivative assets and liabilities, respectively. |
|
|
(8) |
The net receivables/payables include approximately $6 billion of derivative asset and $8 billion of derivative liability fair values not subject to enforceable master netting agreements, respectively.
|
|
|
|
|
|
|
|
|
|
|
|
|
|
|
In millions of dollars at December 31, 2016 |
Derivatives classified in Trading
account assets/liabilities(1)(2)(3)
|
Derivatives classified in Other assets/liabilities(2)(3)
|
Derivatives instruments designated as ASC 815 hedges |
Assets |
Liabilities |
Assets |
Liabilities |
Over-the-counter |
$ |
716 |
|
$ |
171 |
|
$ |
1,927 |
|
$ |
22 |
|
Cleared |
3,530 |
|
2,154 |
|
47 |
|
82 |
|
Interest rate contracts |
$ |
4,246 |
|
$ |
2,325 |
|
$ |
1,974 |
|
$ |
104 |
|
Over-the-counter |
$ |
2,494 |
|
$ |
393 |
|
$ |
747 |
|
$ |
645 |
|
Foreign exchange contracts |
$ |
2,494 |
|
$ |
393 |
|
$ |
747 |
|
$ |
645 |
|
Total derivative instruments designated as ASC 815 hedges |
$ |
6,740 |
|
$ |
2,718 |
|
$ |
2,721 |
|
$ |
749 |
|
Derivatives instruments not designated as ASC 815 hedges |
|
|
|
|
Over-the-counter |
$ |
244,072 |
|
$ |
221,534 |
|
$ |
225 |
|
$ |
5 |
|
Cleared |
120,920 |
|
130,855 |
|
240 |
|
349 |
|
Exchange traded |
87 |
|
47 |
|
— |
|
— |
|
Interest rate contracts |
$ |
365,079 |
|
$ |
352,436 |
|
$ |
465 |
|
$ |
354 |
|
Over-the-counter |
$ |
182,659 |
|
$ |
186,867 |
|
$ |
— |
|
$ |
60 |
|
Cleared |
482 |
|
470 |
|
— |
|
— |
|
Exchange traded |
27 |
|
31 |
|
— |
|
— |
|
Foreign exchange contracts |
$ |
183,168 |
|
$ |
187,368 |
|
$ |
— |
|
$ |
60 |
|
Over-the-counter |
$ |
15,625 |
|
$ |
19,119 |
|
$ |
— |
|
$ |
— |
|
Cleared |
1 |
|
21 |
|
— |
|
— |
|
Exchange traded |
8,484 |
|
7,376 |
|
— |
|
— |
|
Equity contracts |
$ |
24,110 |
|
$ |
26,516 |
|
$ |
— |
|
$ |
— |
|
Over-the-counter |
$ |
13,046 |
|
$ |
14,234 |
|
$ |
— |
|
$ |
— |
|
Exchange traded |
719 |
|
798 |
|
— |
|
— |
|
Commodity and other contracts |
$ |
13,765 |
|
$ |
15,032 |
|
$ |
— |
|
$ |
— |
|
Over-the-counter |
$ |
19,033 |
|
$ |
19,563 |
|
$ |
159 |
|
$ |
78 |
|
Cleared |
5,582 |
|
5,874 |
|
47 |
|
310 |
|
Credit derivatives |
$ |
24,615 |
|
$ |
25,437 |
|
$ |
206 |
|
$ |
388 |
|
Total derivatives instruments not designated as ASC 815 hedges |
$ |
610,737 |
|
$ |
606,789 |
|
$ |
671 |
|
$ |
802 |
|
Total derivatives |
$ |
617,477 |
|
$ |
609,507 |
|
$ |
3,392 |
|
$ |
1,551 |
|
Cash collateral paid/received(4)(5)
|
$ |
11,188 |
|
$ |
15,731 |
|
$ |
8 |
|
$ |
1 |
|
Less: Netting agreements(6)
|
(519,000 |
) |
(519,000 |
) |
— |
|
— |
|
Less: Netting cash collateral received/paid(7)
|
(45,912 |
) |
(49,811 |
) |
(1,345 |
) |
(53 |
) |
Net receivables/payables included on the Consolidated Balance Sheet(8)
|
$ |
63,753 |
|
$ |
56,427 |
|
$ |
2,055 |
|
$ |
1,499 |
|
Additional amounts subject to an enforceable master netting agreement, but not offset on the Consolidated Balance Sheet |
|
|
|
|
Less: Cash collateral received/paid |
$ |
(819 |
) |
$ |
(19 |
) |
$ |
— |
|
$ |
— |
|
Less: Non-cash collateral received/paid |
(11,767 |
) |
(5,883 |
) |
(530 |
) |
— |
|
Total net receivables/payables(8)
|
$ |
51,167 |
|
$ |
50,525 |
|
$ |
1,525 |
|
$ |
1,499 |
|
|
|
(1) |
The trading derivatives fair values are presented in Note 24 to the Consolidated Financial Statements. |
|
|
(2) |
Derivative mark-to-market receivables/payables related to management hedges are recorded in either Other assets/Other liabilities or Trading account assets/Trading account liabilities.
|
|
|
(3) |
Over-the-counter (OTC) derivatives include derivatives executed and settled bilaterally with counterparties without the use of an organized exchange or central clearing house. Cleared derivatives include derivatives executed bilaterally with a counterparty in the OTC market, but then novated to a central clearing house, whereby the central clearing house becomes the counterparty to both of the original counterparties. Exchange traded derivatives include derivatives executed directly on an organized exchange that provides pre-trade price transparency. |
|
|
(4) |
For the trading account assets/liabilities, reflects the net amount of the $60,999 million and $61,643 million of gross cash collateral paid and received, respectively. Of the gross cash collateral paid, $49,811 million was used to offset derivative liabilities and, of the gross cash collateral received, $45,912 million was used to offset derivative assets.
|
|
|
(5) |
For cash collateral paid with respect to non-trading derivative assets, reflects the net amount of $61 million of the gross cash collateral paid, of which $53 million is netted against non-trading derivative positions within Other liabilities. For cash collateral received with respect to non-trading derivative liabilities, reflects the net amount of $1,346 million of gross cash collateral received of which $1,345 million is netted against non-trading derivative positions within Other assets.
|
|
|
(6) |
Represents the netting of derivative receivable and payable balances with the same counterparty under enforceable netting agreements. Approximately $383 billion, $128 billion and $8 billion of the netting against trading account asset/liability balances is attributable to each of the OTC, cleared and exchange traded derivatives, respectively.
|
|
|
(7) |
Represents the netting of cash collateral paid and received by counterparty under enforceable credit support agreements. Substantially all cash collateral received and paid is netted against OTC derivative assets and liabilities, respectively. |
|
|
(8) |
The net receivables/payables include approximately $7 billion of derivative asset and $9 billion of liability fair values not subject to enforceable master netting agreements, respectively.
|
For the years ended December 31, 2017, 2016 and 2015, the amounts recognized in Principal transactions in the Consolidated Statement of Income related to derivatives not designated in a qualifying hedging relationship, as well as the underlying non-derivative instruments, are presented in Note 6 to the Consolidated Financial Statements. Citigroup presents this disclosure by business classification, showing derivative gains and losses related to its trading activities together with gains and losses related to non-derivative instruments within the same trading portfolios, as this represents the way these portfolios are risk managed.
The amounts recognized in Other revenue in the Consolidated Statement of Income related to derivatives not designated in a qualifying hedging relationship are shown below. The table below does not include any offsetting gains/losses on the economically hedged items to the extent such amounts are also recorded in Other revenue.
|
|
|
|
|
|
|
|
|
|
|
|
Gains (losses) included in
Other revenue
|
In millions of dollars |
2017 |
2016 |
2015 |
Interest rate contracts |
$ |
(54 |
) |
$ |
(81 |
) |
$ |
117 |
|
Foreign exchange |
244 |
|
12 |
|
(39 |
) |
Credit derivatives |
(494 |
) |
(1,009 |
) |
476 |
|
Total |
$ |
(304 |
) |
$ |
(1,078 |
) |
$ |
554 |
|
Accounting for Derivative Hedging
Citigroup accounts for its hedging activities in accordance with ASC 815, Derivatives and Hedging. As a general rule, hedge accounting is permitted where the Company is exposed to a particular risk, such as interest rate or foreign exchange risk, that causes changes in the fair value of an asset or liability or variability in the expected future cash flows of an existing asset, liability or a forecasted transaction that may affect earnings.
Derivative contracts hedging the risks associated with changes in fair value are referred to as fair value hedges, while contracts hedging the variability of expected future cash flows are cash flow hedges. Hedges that utilize derivatives or debt instruments to manage the foreign exchange risk associated with equity investments in non-U.S.-dollar-functional-currency foreign subsidiaries (net investment in a foreign operation) are net investment hedges.
To qualify as an accounting hedge under the hedge accounting rules (versus an economic hedge where hedge accounting is not applied), a hedging relationship must be highly effective in offsetting the risk designated as being
hedged. The hedge relationship must be formally documented at inception, detailing the particular risk management objective and strategy for the hedge. This includes the item and risk(s) being hedged, the hedging instrument being used and how effectiveness will be assessed. The effectiveness of these hedging relationships is evaluated at hedge inception and on an ongoing basis both on a retrospective and prospective basis, typically using quantitative measures of correlation, with hedge ineffectiveness measured and recorded in current earnings. Hedge effectiveness assessment methodologies are performed in a similar manner for similar hedges, and are used consistently throughout the hedging relationships. The assessment of effectiveness may exclude changes in the value of the hedged item that are unrelated to the risks being hedged and the changes in fair value of the derivative associated with time value. These excluded items are recognized in current earnings for the hedging derivative, while changes in the value of a hedged item that are not related to the hedged risk are not recorded.
Discontinued Hedge Accounting
A hedging instrument must be highly effective in accomplishing the hedge objective of offsetting either changes in the fair value or cash flows of the hedged item for the risk being hedged. Management may voluntarily de-designate an accounting hedge at any time, but if a hedge relationship is not highly effective, it no longer qualifies for hedge accounting and must be de-designated. Subsequent changes in the fair value of the derivative are recognized in Other revenue or Principal transactions, similar to trading derivatives, with no offset recorded related to the hedged item.
For fair value hedges, any changes in the fair value of the hedged item remain as part of the basis of the asset or liability and are ultimately realized as an element of the yield on the item. For cash flow hedges, changes in fair value of the end-user derivative remain in Accumulated other comprehensive income (loss) (AOCI) and are included in the earnings of future periods when the forecasted hedged cash flows impact earnings. However, if it becomes probable that some or all of the hedged forecasted transactions will not occur, any amounts that remain in AOCI related to these transactions must be immediately reflected in Other revenue.
The foregoing criteria are applied on a decentralized basis, consistent with the level at which market risk is managed, but are subject to various limits and controls. The underlying asset, liability or forecasted transaction may be an individual item or a portfolio of similar items.
Fair Value Hedges
Hedging of Benchmark Interest Rate Risk
Citigroup’s fair value hedges are primarily hedges of fixed-rate long-term debt or assets, such as available-for-sale securities.
Citigroup hedges exposure to changes in the fair value of outstanding fixed-rate issued debt. These hedges are designated as fair value hedges of the benchmark interest rate risk associated with the currency of the hedged liability. The fixed cash flows of the hedged items are typically converted to benchmark variable-rate cash flows by entering into receive-fixed, pay-variable interest rate swaps. By designating an interest rate swap contract as a hedging instrument and electing to apply ASC 815 fair value hedge accounting, the carrying value of the debt is adjusted to reflect the impact of changes in the benchmark interest rate, with such changes in value recorded in Other revenue. The related interest rate swap is recorded on the balance sheet at fair value, with changes in fair value also reflected in Other revenue. These amounts are expected to, and generally do, offset. Any net amount, representing hedge ineffectiveness, is automatically reflected in current earnings. These fair value hedge relationships use either regression or dollar-offset ratio analysis to assess whether the hedging relationships are highly effective at inception and on an ongoing basis.
Citigroup also hedges its exposure to changes in the fair value of fixed-rate available for sale debt securities due to changes in benchmark interest rates. The hedging instruments are typically receive-variable, pay-fixed interest rate swaps. These fair value hedging relationships use either regression or dollar-offset ratio analysis to assess whether the hedging relationships are highly effective at inception and on an ongoing basis.
Hedging of Foreign Exchange Risk
Citigroup hedges the change in fair value attributable to foreign exchange rate movements in available-for-sale securities that are denominated in currencies other than the functional currency of the entity holding the securities, which may be within or outside the U.S. The hedging instrument may be a cross currency swap or a forward foreign exchange contract. When a forward foreign exchange contract is used as the hedging instrument, the portion of the change in the fair value of the hedged available-for-sale security attributable to foreign exchange risk (i.e., spot rates) is reported in earnings, and not AOCI, which offsets the change in the fair value of the forward contract that is also reflected in earnings. Citigroup considers the premium associated with forward contracts (i.e., the differential between spot and contractual forward rates) as the cost of hedging; this amount is excluded from the assessment of hedge effectiveness and reflected directly in earnings over the life of the hedge.
Hedging of Commodity Price Risk
Citigroup hedges the change in fair value attributable to spot price movements in physical commodities inventory. The hedging instrument is a futures contract to sell the underlying commodity. In this hedge, the change in the value of the hedged inventory is reflected in earnings, which offsets the change in the fair value of the futures contract that is also reflected in earnings. Although the change in the fair value of the hedging instrument recorded in earnings includes changes in forward rates, Citigroup excludes the differential between the spot and the contractual forward rates under the futures contract from the assessment of hedge effectiveness. Since the assessment is based on changes in fair value attributable to change in spot prices on both the physical commodity and the futures contract, the amount of hedge ineffectiveness is not significant.
The following table summarizes the gains (losses) on the Company’s fair value hedges:
|
|
|
|
|
|
|
|
|
|
|
|
Gains (losses) on fair value hedges(1)
|
|
Year ended December 31, |
In millions of dollars |
2017 |
2016 |
2015 |
Gain (loss) on the derivatives in designated and qualifying fair value hedges |
|
|
|
Interest rate contracts |
$ |
(891 |
) |
$ |
(753 |
) |
$ |
(847 |
) |
Foreign exchange contracts |
(824 |
) |
(1,415 |
) |
1,315 |
|
Commodity contracts |
(17 |
) |
182 |
|
41 |
|
Total gain (loss) on the derivatives in designated and qualifying fair value hedges |
$ |
(1,732 |
) |
$ |
(1,986 |
) |
$ |
509 |
|
Gain (loss) on the hedged item in designated and qualifying fair value hedges |
|
|
|
Interest rate hedges |
$ |
853 |
|
$ |
668 |
|
$ |
792 |
|
Foreign exchange hedges |
969 |
|
1,573 |
|
(1,258 |
) |
Commodity hedges |
18 |
|
(210 |
) |
(35 |
) |
Total gain (loss) on the hedged item in designated and qualifying fair value hedges |
$ |
1,840 |
|
$ |
2,031 |
|
$ |
(501 |
) |
Hedge ineffectiveness recognized in earnings on designated and qualifying fair value hedges |
|
|
|
Interest rate hedges |
$ |
(31 |
) |
$ |
(84 |
) |
$ |
(47 |
) |
Foreign exchange hedges |
49 |
|
4 |
|
(23 |
) |
Total hedge ineffectiveness recognized in earnings on designated and qualifying fair value hedges |
$ |
18 |
|
$ |
(80 |
) |
$ |
(70 |
) |
Net gain (loss) excluded from assessment of the effectiveness of fair value hedges |
|
|
|
Interest rate contracts |
$ |
(7 |
) |
$ |
(1 |
) |
$ |
(8 |
) |
Foreign exchange contracts(2)
|
96 |
|
154 |
|
80 |
|
Commodity hedges(2)
|
1 |
|
(28 |
) |
6 |
|
Total net gain (loss) excluded from assessment of the effectiveness of fair value hedges |
$ |
90 |
|
$ |
125 |
|
$ |
78 |
|
|
|
(1) |
Amounts are included in Other revenue or Principal Transactions in the Consolidated Statement of Income. The accrued interest income on fair value hedges is recorded in Net interest revenue and is excluded from this table.
|
|
|
(2) |
Amounts relate to the premium associated with forward contracts (differential between spot and contractual forward rates). These amounts are excluded from the assessment of hedge effectiveness and are reflected directly in earnings. |
Cash Flow Hedges
Hedging of Benchmark Interest Rate Risk
Citigroup hedges the variability of forecasted cash flows associated with floating-rate assets/liabilities and other forecasted transactions. Variable cash flows from those liabilities are synthetically converted to fixed-rate cash flows by entering into receive-variable, pay-fixed interest rate swaps and receive-variable, pay-fixed forward-starting interest rate swaps. Variable cash flows associated with certain assets are synthetically converted to fixed-rate cash flows by entering into receive-fixed, pay-variable interest rate swaps. These cash flow hedging relationships use either regression analysis or dollar-offset ratio analysis to assess whether the hedging relationships are highly effective at inception and on an ongoing basis. When the variable interest rates associated with hedged items do not qualify as benchmark interest rates, Citigroup designates the risk being hedged as the risk of overall variability in the hedged cash flows. Because efforts are made to match the terms of the derivatives to those of the hedged forecasted cash flows as closely as possible, the amount of hedge ineffectiveness is not significant.
For cash flow hedges in which derivatives hedge the variability of forecasted cash flows related to recognized assets, liabilities or forecasted transactions, the accounting treatment depends on the effectiveness of the hedge. To the extent that these derivatives are effective in offsetting the variability of the forecasted hedged cash flows, the effective portion of the changes in the derivatives’ fair values will not
be included in current earnings, but will be reported in AOCI. These changes in fair value will be included in the earnings of future periods when the hedged cash flows impact earnings. To the extent that these derivatives are not fully effective, changes in their fair values are immediately included in Other revenue. Citigroup’s cash flow hedges primarily include hedges of floating-rate assets or liabilities which may include loans as well as forecasted transactions.
Hedging of Foreign Exchange Risk
Citigroup locks in the functional currency equivalent cash flows of long-term debt and short-term borrowings that are denominated in currencies other than the functional currency of the issuing entity. Depending on risk management objectives, these types of hedges are designated either as cash flow hedges of foreign exchange risk only or cash flow hedges of both foreign exchange risk and interest rate risk, and the hedging instruments are foreign exchange cross-currency swaps and forward contracts. These cash flow hedge relationships use dollar-offset ratio analysis to determine whether the hedging relationships are highly effective at inception and on an ongoing basis.
The amount of hedge ineffectiveness on the cash flow hedges recognized in earnings for the years ended December 31, 2017, 2016 and 2015 is not significant. The pretax change in AOCI from cash flow hedges is presented in the table below:
|
|
|
|
|
|
|
|
|
|
|
|
Year ended December 31, |
In millions of dollars |
2017 |
2016 |
2015 |
Effective portion of cash flow hedges included in AOCI |
|
|
|
Interest rate contracts |
$ |
(165 |
) |
$ |
(219 |
) |
$ |
357 |
|
Foreign exchange contracts |
(8 |
) |
69 |
|
(220 |
) |
Total effective portion of cash flow hedges included in AOCI |
$ |
(173 |
) |
$ |
(150 |
) |
$ |
137 |
|
Effective portion of cash flow hedges reclassified from AOCI to earnings |
|
|
|
Interest rate contracts |
$ |
(126 |
) |
$ |
(140 |
) |
$ |
(186 |
) |
Foreign exchange contracts |
(10 |
) |
(93 |
) |
(146 |
) |
Total effective portion of cash flow hedges reclassified from AOCI to earnings(1)
|
$ |
(136 |
) |
$ |
(233 |
) |
$ |
(332 |
) |
|
|
(1) |
Included primarily in Other revenue and Net interest revenue in the Consolidated Statement of Income.
|
For cash flow hedges, the changes in the fair value of the hedging derivative remain in AOCI on the Consolidated Balance Sheet and will be included in the earnings of future periods to offset the variability of the hedged cash flows when such cash flows affect earnings. The net gain associated with cash flow hedges expected to be reclassified from AOCI within 12 months of December 31, 2017 is approximately $0.4 billion. The maximum length of time over which forecasted cash flows are hedged is 10 years.
The after-tax impact of cash flow hedges on AOCI is shown in Note 19 to the Consolidated Financial Statements.
Net Investment Hedges
Consistent with ASC 830-20, Foreign Currency Matters—Foreign Currency Transactions, ASC 815 allows the hedging of the foreign currency risk of a net investment in a foreign operation. Citigroup uses foreign currency forwards, cross-currency swaps, options and foreign currency-denominated debt instruments to manage the foreign exchange risk associated with Citigroup’s equity investments in several non-U.S.-dollar-functional-currency foreign subsidiaries. Citigroup records the change in the carrying amount of these investments in the Foreign currency translation adjustment account within AOCI. Simultaneously, the effective portion of the hedge of this exposure is also recorded in the Foreign currency translation adjustment account and any ineffective portion is immediately recorded in earnings.
For derivatives designated as net investment hedges, Citigroup follows the forward-rate method outlined in ASC 815-35-35. According to that method, all changes in fair value, including changes related to the forward-rate component of the foreign currency forward contracts and the time value of foreign currency options, are recorded in the Foreign currency translation adjustment account within AOCI.
For foreign currency-denominated debt instruments that are designated as hedges of net investments, the translation gain or loss that is recorded in the Foreign currency translation adjustment account is based on the spot exchange rate between the functional currency of the respective subsidiary and the U.S. dollar, which is the functional currency of Citigroup. To the extent the notional amount of the hedging instrument exactly matches the hedged net investment and the underlying exchange rate of the derivative hedging instrument relates to the exchange rate between the functional currency of the net investment and Citigroup’s functional currency (or, in the case of a non-derivative debt instrument, such instrument is denominated in the functional currency of the net investment), no ineffectiveness is recorded in earnings.
The pretax gain (loss) recorded in the Foreign currency translation adjustment account within AOCI, related to the effective portion of the net investment hedges, is $2,528 million, $(220) million and $2,475 million for the years ended December 31, 2017, 2016 and 2015, respectively.
Economic Hedges
Citigroup often uses economic hedges when hedge accounting would be too complex or operationally burdensome. End-user derivatives that are economic hedges are carried at fair value, with changes in value included in either Principal transactions or Other revenue.
For asset/liability management hedging, fixed-rate long-term debt is recorded at amortized cost under GAAP.
For other hedges that either do not meet the ASC 815 hedging criteria or for which management decides not to apply ASC 815 hedge accounting, the derivative is recorded at fair value on the balance sheet with the associated changes in fair value recorded in earnings, while the debt continues to be carried at amortized cost. Therefore, current earnings are affected by the interest rate shifts and other factors that cause a change in the swap’s value, but for which no offsetting change in value is recorded on the debt.
Citigroup may alternatively elect to account for the debt at fair value under the fair value option. Once the irrevocable election is made upon issuance of the debt, the full change in fair value of the debt is reported in earnings. The changes in fair value of the related interest rate swap are also reflected in earnings, which provides a natural offset to the debt’s fair value change. To the extent the two amounts differ because the full change in the fair value of the debt includes risks not offset by the interest rate swap, the difference is automatically captured in current earnings.
Additional economic hedges include hedges of the credit risk component of commercial loans and loan commitments. Citigroup periodically evaluates its hedging strategies in other areas and may designate either an accounting hedge or an economic hedge after considering the relative costs and benefits. Economic hedges are also employed when the hedged item itself is marked to market through current earnings, such as hedges of commitments to originate one- to four-family mortgage loans to be held for sale and MSRs.
Credit Derivatives
Citi is a market maker and trades a range of credit derivatives. Through these contracts, Citi either purchases or writes protection on either a single name or a portfolio of reference credits. Citi also uses credit derivatives to help mitigate credit risk in its corporate and consumer loan portfolios and other cash positions and to facilitate client transactions.
Citi monitors its counterparty credit risk in credit derivative contracts. As of both December 31, 2017 and December 31, 2016, approximately 98% of the gross receivables are from counterparties with which Citi maintains collateral agreements. A majority of Citi’s top 15 counterparties (by receivable balance owed to Citi) are banks, financial institutions or other dealers. Contracts with these counterparties do not include ratings-based termination events. However, counterparty ratings downgrades may have an incremental effect by lowering the threshold at which Citi may call for additional collateral.
The range of credit derivatives entered into includes credit default swaps, total return swaps, credit options and credit-linked notes.
A credit default swap is a contract in which, for a fee, a protection seller agrees to reimburse a protection buyer for any losses that occur due to a predefined credit event on a reference entity. These credit events are defined by the terms of the derivative contract and the reference credit and are generally limited to the market standard of failure to pay on indebtedness and bankruptcy of the reference credit and, in a more limited range of transactions, debt restructuring. Credit derivative transactions that reference emerging market entities also typically include additional credit events to cover the acceleration of indebtedness and the risk of repudiation or a payment moratorium. In certain transactions, protection may be provided on a portfolio of reference entities or asset-backed securities. If there is no credit event, as defined by the specific derivative contract, then the protection seller makes no payments to the protection buyer and receives only the contractually specified fee. However, if a credit event occurs as defined in the specific derivative contract sold, the
protection seller will be required to make a payment to the protection buyer. Under certain contracts, the seller of protection may not be required to make a payment until a specified amount of losses has occurred with respect to the portfolio and/or may only be required to pay for losses up to a specified amount.
A total return swap typically transfers the total economic performance of a reference asset, which includes all associated cash flows, as well as capital appreciation or depreciation. The protection buyer receives a floating rate of interest and any depreciation on the reference asset from the protection seller and, in return, the protection seller receives the cash flows associated with the reference asset plus any appreciation. Thus, according to the total return swap agreement, the protection seller will be obligated to make a payment any time the floating interest rate payment plus any depreciation of the reference asset exceeds the cash flows associated with the underlying asset. A total return swap may terminate upon a default of the reference asset or a credit event with respect to the reference entity subject to the provisions of the related total return swap agreement between the protection seller and the protection buyer.
A credit option is a credit derivative that allows investors to trade or hedge changes in the credit quality of a reference entity. For example, in a credit spread option, the option writer assumes the obligation to purchase or sell credit protection on the reference entity at a specified “strike” spread level. The option purchaser buys the right to sell credit default protection on the reference entity to, or purchase it from, the option writer at the strike spread level. The payments on credit spread options depend either on a particular credit spread or the price of the underlying credit-sensitive asset or other reference entity. The options usually terminate if a credit event occurs with respect to the underlying reference entity.
A credit-linked note is a form of credit derivative structured as a debt security with an embedded credit default swap. The purchaser of the note effectively provides credit protection to the issuer by agreeing to receive a return that could be negatively affected by credit events on the underlying reference credit. If the reference entity defaults, the note may be cash settled or physically settled by delivery of a debt security of the reference entity. Thus, the maximum amount of the note purchaser’s exposure is the amount paid for the credit-linked note.
The following tables summarize the key characteristics of Citi’s credit derivatives portfolio by counterparty and derivative form:
|
|
|
|
|
|
|
|
|
|
|
|
|
|
|
Fair values |
Notionals |
In millions of dollars at December 31, 2017 |
Receivable(1)
|
Payable(2)
|
Protection
purchased |
Protection
sold |
By industry/counterparty |
|
|
|
|
Banks |
$ |
7,471 |
|
$ |
6,669 |
|
$ |
264,414 |
|
$ |
273,711 |
|
Broker-dealers |
2,325 |
|
2,285 |
|
73,273 |
|
83,229 |
|
Non-financial |
70 |
|
91 |
|
1,288 |
|
1,140 |
|
Insurance and other financial institutions |
10,668 |
|
12,488 |
|
438,738 |
|
377,062 |
|
Total by industry/counterparty |
$ |
20,534 |
|
$ |
21,533 |
|
$ |
777,713 |
|
$ |
735,142 |
|
By instrument |
|
|
|
|
Credit default swaps and options |
$ |
20,251 |
|
$ |
20,554 |
|
$ |
754,114 |
|
$ |
724,228 |
|
Total return swaps and other |
283 |
|
979 |
|
23,599 |
|
10,914 |
|
Total by instrument |
$ |
20,534 |
|
$ |
21,533 |
|
$ |
777,713 |
|
$ |
735,142 |
|
By rating |
|
|
|
|
Investment grade |
$ |
10,473 |
|
$ |
10,616 |
|
$ |
588,324 |
|
$ |
557,987 |
|
Non-investment grade |
10,061 |
|
10,917 |
|
189,389 |
|
177,155 |
|
Total by rating |
$ |
20,534 |
|
$ |
21,533 |
|
$ |
777,713 |
|
$ |
735,142 |
|
By maturity |
|
|
|
|
Within 1 year |
$ |
2,477 |
|
$ |
2,914 |
|
$ |
231,878 |
|
$ |
218,097 |
|
From 1 to 5 years |
16,098 |
|
16,435 |
|
498,606 |
|
476,345 |
|
After 5 years |
1,959 |
|
2,184 |
|
47,229 |
|
40,700 |
|
Total by maturity |
$ |
20,534 |
|
$ |
21,533 |
|
$ |
777,713 |
|
$ |
735,142 |
|
|
|
(1) |
The fair value amount receivable is composed of $3,195 million under protection purchased and $17,339 million under protection sold.
|
|
|
(2) |
The fair value amount payable is composed of $3,147 million under protection purchased and $18,386 million under protection sold.
|
|
|
|
|
|
|
|
|
|
|
|
|
|
|
|
Fair values |
Notionals |
In millions of dollars at December 31, 2016 |
Receivable(1)
|
Payable(2)
|
Protection
purchased |
Protection
sold |
By industry/counterparty |
|
|
|
|
Banks |
$ |
11,895 |
|
$ |
10,930 |
|
$ |
407,992 |
|
$ |
414,720 |
|
Broker-dealers |
3,536 |
|
3,952 |
|
115,013 |
|
119,810 |
|
Non-financial |
82 |
|
99 |
|
4,014 |
|
2,061 |
|
Insurance and other financial institutions |
9,308 |
|
10,844 |
|
375,454 |
|
322,829 |
|
Total by industry/counterparty |
$ |
24,821 |
|
$ |
25,825 |
|
$ |
902,473 |
|
$ |
859,420 |
|
By instrument |
|
|
|
|
Credit default swaps and options |
$ |
24,502 |
|
$ |
24,631 |
|
$ |
883,719 |
|
$ |
852,900 |
|
Total return swaps and other |
319 |
|
1,194 |
|
18,754 |
|
6,520 |
|
Total by instrument |
$ |
24,821 |
|
$ |
25,825 |
|
$ |
902,473 |
|
$ |
859,420 |
|
By rating |
|
|
|
|
Investment grade |
$ |
9,605 |
|
$ |
9,995 |
|
$ |
675,138 |
|
$ |
648,247 |
|
Non-investment grade |
15,216 |
|
15,830 |
|
227,335 |
|
211,173 |
|
Total by rating |
$ |
24,821 |
|
$ |
25,825 |
|
$ |
902,473 |
|
$ |
859,420 |
|
By maturity |
|
|
|
|
Within 1 year |
$ |
4,113 |
|
$ |
4,841 |
|
$ |
293,059 |
|
$ |
287,262 |
|
From 1 to 5 years |
17,735 |
|
17,986 |
|
551,155 |
|
523,371 |
|
After 5 years |
2,973 |
|
2,998 |
|
58,259 |
|
48,787 |
|
Total by maturity |
$ |
24,821 |
|
$ |
25,825 |
|
$ |
902,473 |
|
$ |
859,420 |
|
|
|
(1) |
The fair value amount receivable is composed of $9,077 million under protection purchased and $15,744 million under protection sold.
|
|
|
(2) |
The fair value amount payable is composed of $17,110 million under protection purchased and $8,715 million under protection sold.
|
Fair values included in the above tables are prior to application of any netting agreements and cash collateral. For notional amounts, Citi generally has a mismatch between the total notional amounts of protection purchased and sold, and it may hold the reference assets directly rather than entering into offsetting credit derivative contracts as and when desired. The open risk exposures from credit derivative contracts are largely matched after certain cash positions in reference assets are considered and after notional amounts are adjusted, either to a duration-based equivalent basis or to reflect the level of subordination in tranched structures. The ratings of the credit derivatives portfolio presented in the tables and used to evaluate payment/performance risk are based on the assigned internal or external ratings of the reference asset or entity. Where external ratings are used, investment-grade ratings are considered to be ‘Baa/BBB’ and above, while anything below is considered non-investment grade. Citi’s internal ratings are in line with the related external rating system.
Citigroup evaluates the payment/performance risk of the credit derivatives for which it stands as a protection seller based on the credit rating assigned to the underlying reference credit. Credit derivatives written on an underlying non-investment grade reference credit represent greater payment risk to the Company. The non-investment grade category in the table above also includes credit derivatives where the underlying reference entity has been downgraded subsequent to the inception of the derivative.
The maximum potential amount of future payments under credit derivative contracts presented in the table above is based on the notional value of the derivatives. The Company believes that the notional amount for credit protection sold is not representative of the actual loss exposure based on historical experience. This amount has not been reduced by the value of the reference assets and the related cash flows. In accordance with most credit derivative contracts, should a credit event occur, the Company usually is liable for the difference between the protection sold and the value of the reference assets. Furthermore, the notional amount for credit protection sold has not been reduced for any cash collateral paid to a given counterparty, as such payments would be calculated after netting all derivative exposures, including any credit derivatives with that counterparty in accordance with a related master netting agreement. Due to such netting processes, determining the amount of collateral that corresponds to credit derivative exposures alone is not possible. The Company actively monitors open credit-risk exposures and manages this exposure by using a variety of strategies, including purchased credit derivatives, cash collateral or direct holdings of the referenced assets. This risk mitigation activity is not captured in the table above.
Credit Risk-Related Contingent Features in Derivatives
Certain derivative instruments contain provisions that require the Company to either post additional collateral or immediately settle any outstanding liability balances upon the occurrence of a specified event related to the credit risk of the Company. These events, which are defined by the existing derivative contracts, are primarily downgrades in the credit ratings of the Company and its affiliates. The fair value (excluding CVA) of all derivative instruments with credit-risk-related contingent features that were in a net liability position at both December 31, 2017 and December 31, 2016 was $29 billion and $26 billion, respectively. The Company posted $28 billion and $26 billion as collateral for this exposure in the normal course of business as of December 31, 2017 and December 31, 2016, respectively.
A downgrade could trigger additional collateral or cash settlement requirements for the Company and certain affiliates. In the event that Citigroup and Citibank were downgraded a single notch by all three major rating agencies as of December 31, 2017, the Company could be required to post an additional $0.9 billion as either collateral or settlement of the derivative transactions. Additionally, the Company could be required to segregate with third-party custodians collateral previously received from existing derivative counterparties in the amount of $0.3 billion upon the single notch downgrade, resulting in aggregate cash obligations and collateral requirements of approximately $1.2 billion.
Derivatives Accompanied by Financial Asset Transfers
The Company executes total return swaps that provide it with synthetic exposure to substantially all of the economic return of the securities or other financial assets referenced in the contract. In certain cases, the derivative transaction is accompanied by the Company’s transfer of the referenced financial asset to the derivative counterparty, most typically in response to the derivative counterparty’s desire to hedge, in whole or in part, its synthetic exposure under the derivative contract by holding the referenced asset in funded form. In certain jurisdictions these transactions qualify as sales, resulting in derecognition of the securities transferred (see Note 1 to the Consolidated Financial Statements for further discussion of the related sale conditions for transfers of financial assets). For a significant portion of the transactions, the Company has also executed another total return swap where the Company passes on substantially all of the economic return of the referenced securities to a different third party seeking the exposure. In those cases, the Company is not exposed, on a net basis, to changes in the economic return of the referenced securities.
These transactions generally involve the transfer of the Company’s liquid government bonds, convertible bonds or publicly traded corporate equity securities from the trading portfolio and are executed with third-party financial institutions. The accompanying derivatives are typically total return swaps. The derivatives are cash settled and subject to ongoing margin requirements.
When the conditions for sale accounting are met, the Company reports the transfer of the referenced financial asset as a sale and separately reports the accompanying derivative
transaction. These transactions generally do not result in a gain or loss on the sale of the security, because the transferred security was held at fair value in the Company’s trading portfolio. For transfers of financial assets accounted for by the Company as a sale, where the Company has retained substantially all of the economic exposure to the transferred asset through a total return swap executed in contemplation of the initial sale, with the same counterparty and still outstanding as of December 31, 2017 and December 31, 2016, both the asset carrying amounts derecognized and gross cash proceeds received as of the date of derecognition were $3.0 billion and $1.0 billion, respectively. At December 31, 2017, the fair value of these previously derecognized assets was $3.1 billion and the fair value of the total return swaps was $89 million, recorded as gross derivative assets, and $15 million recorded as gross derivative liabilities. At December 31, 2016, the fair value of these previously derecognized assets was $1.0 billion and the fair value of the total return swaps was $32 million, recorded as gross derivative assets, and $23 million, recorded as gross derivative liabilities. The balances for the total return swaps are on a gross basis, before the application of counterparty and cash collateral netting, and are included primarily as equity derivatives in the tabular disclosures in this Note.
23. CONCENTRATIONS OF CREDIT RISK
Concentrations of credit risk exist when changes in economic, industry or geographic factors similarly affect groups of counterparties whose aggregate credit exposure is material in relation to Citigroup’s total credit exposure. Although Citigroup’s portfolio of financial instruments is broadly diversified along industry, product and geographic lines, material transactions are completed with other financial institutions, particularly in the securities trading, derivatives and foreign exchange businesses.
In connection with the Company’s efforts to maintain a diversified portfolio, the Company limits its exposure to any one geographic region, country or individual creditor and monitors this exposure on a continuous basis. At December 31, 2017, Citigroup’s most significant concentration of credit risk was with the U.S. government and its agencies. The Company’s exposure, which primarily results from trading assets and investments issued by the U.S. government and its agencies, amounted to $227.8 billion and $228.5 billion at December 31, 2017 and 2016, respectively. The German and Japanese governments and their agencies, which are rated investment grade by both Moody’s and S&P, were the next largest exposures. The Company’s exposure to Germany amounted to $38.3 billion and $26.7 billion at December 31, 2017 and 2016, respectively, and was composed of investment securities, loans and trading assets. The Company’s exposure to Japan amounted to $25.8 billion and $27.3 billion at December 31, 2017 and 2016, respectively, and was composed of investment securities, loans and trading assets.
The Company’s exposure to states and municipalities amounted to $30.6 billion and $30.7 billion at December 31, 2017 and 2016, respectively, and was composed of trading assets, investment securities, derivatives and lending activities.
24. FAIR VALUE MEASUREMENT
ASC 820-10, Fair Value Measurement, defines fair value, establishes a consistent framework for measuring fair value and requires disclosures about fair value measurements. Fair value is defined as the price that would be received to sell an asset or paid to transfer a liability in an orderly transaction between market participants at the measurement date. Among other things, the standard requires the Company to maximize the use of observable inputs and minimize the use of unobservable inputs when measuring fair value.
Under ASC 820-10, the probability of default of a counterparty is factored into the valuation of derivative and other positions as well as the impact of Citigroup’s own credit risk on derivatives and other liabilities measured at fair value.
Fair Value Hierarchy
ASC 820-10 specifies a hierarchy of inputs based on whether the inputs are observable or unobservable. Observable inputs are developed using market data and reflect market participant assumptions, while unobservable inputs reflect the Company’s market assumptions. These two types of inputs have created the following fair value hierarchy:
|
|
• |
Level 1: Quoted prices for identical instruments in active markets.
|
|
|
• |
Level 2: Quoted prices for similar instruments in active markets; quoted prices for identical or similar instruments in markets that are not active; and model-derived valuations in which all significant inputs and significant value drivers are observable in active markets.
|
|
|
• |
Level 3: Valuations derived from valuation techniques in which one or more significant inputs or significant value drivers are unobservable.
|
As required under the fair value hierarchy, the Company considers relevant and observable market inputs in its valuations where possible. The frequency of transactions, the size of the bid-ask spread and the amount of adjustment necessary when comparing similar transactions are all factors in determining the liquidity of markets and the relevance of observed prices in those markets.
The Company’s policy with respect to transfers between levels of the fair value hierarchy is to recognize transfers into and out of each level as of the end of the reporting period.
Determination of Fair Value
For assets and liabilities carried at fair value, the Company measures fair value using the procedures set out below, irrespective of whether the assets and liabilities are measured at fair value as a result of an election or whether they are required to be measured at fair value.
When available, the Company uses quoted market prices to determine fair value and classifies such items as Level 1. In some cases where a market price is available, the
Company will make use of acceptable practical expedients (such as matrix pricing) to calculate fair value, in which case the items are classified as Level 2.
The Company may also apply a price-based methodology, which utilizes, where available, quoted prices or other market information obtained from recent trading activity in positions with the same or similar characteristics to the position being valued. The market activity and the amount of the bid-ask spread are among the factors considered in determining the liquidity of markets and the observability of prices from those markets. If relevant and observable prices are available, those valuations may be classified as Level 2. When less liquidity exists for a security or loan, a quoted price is stale, a significant adjustment to the price of a similar security is necessary to reflect differences in the terms of the actual security or loan being valued, or prices from independent sources are insufficient to corroborate the valuation, the “price” inputs are considered unobservable and the fair value measurements are classified as Level 3.
If quoted market prices are not available, fair value is based upon internally developed valuation techniques that use, where possible, current market-based parameters, such as interest rates, currency rates and option volatilities. Items valued using such internally generated valuation techniques are classified according to the lowest level input or value driver that is significant to the valuation. Thus, an item may be classified as Level 3 even though there may be some significant inputs that are readily observable.
Fair value estimates from internal valuation techniques are verified, where possible, to prices obtained from independent vendors or brokers. Vendors’ and brokers’ valuations may be based on a variety of inputs ranging from observed prices to proprietary valuation models.
The following section describes the valuation methodologies used by the Company to measure various financial instruments at fair value, including an indication of the level in the fair value hierarchy in which each instrument is generally classified. Where appropriate, the description includes details of the valuation models, the key inputs to those models and any significant assumptions.
Market Valuation Adjustments
Generally, the unit of account for a financial instrument is the individual financial instrument. The Company applies market valuation adjustments that are consistent with the unit of account, which does not include adjustment due to the size of the Company’s position, except as follows. ASC 820-10 permits an exception, through an accounting policy election, to measure the fair value of a portfolio of financial assets and financial liabilities on the basis of the net open risk position when certain criteria are met. Citi has elected to measure certain portfolios of financial instruments, such as derivatives, that meet those criteria on the basis of the net open risk position. The Company applies market valuation adjustments, including adjustments to account for the size of the net open risk position, consistent with market participant assumptions and in accordance with the unit of account.
Liquidity adjustments are applied to items in Level 2 or Level 3 of the fair value hierarchy in an effort to ensure that the fair value reflects the price at which the net open risk position could be liquidated. The liquidity adjustment is based on the bid/offer spread for an instrument. When Citi has elected to measure certain portfolios of financial investments, such as derivatives, on the basis of the net open risk position, the liquidity adjustment may be adjusted to take into account the size of the position.
Credit valuation adjustments (CVA) and funding valuation adjustments (FVA) are applied to over-the-counter (OTC) derivative instruments in which the base valuation generally discounts expected cash flows using the relevant base interest rate curve for the currency of the derivative (e.g., LIBOR for uncollateralized U.S.-dollar derivatives). As not all counterparties have the same credit risk as that implied by the relevant base curve, a CVA is necessary to incorporate the market view of both counterparty credit risk and Citi’s own credit risk in the valuation. FVA reflects a market funding risk premium inherent in the uncollateralized portion of derivative portfolios and in collateralized derivatives where the terms of the agreement do not permit the reuse of the collateral received.
Citi’s CVA and FVA methodology consists of two steps:
|
|
• |
First, the exposure profile for each counterparty is determined using the terms of all individual derivative positions and a Monte Carlo simulation or other quantitative analysis to generate a series of expected cash flows at future points in time. The calculation of this exposure profile considers the effect of credit risk mitigants and sources of funding, including pledged cash or other collateral and any legal right of offset that exists with a counterparty through arrangements such as netting agreements. Individual derivative contracts that are subject to an enforceable master netting agreement with a counterparty are aggregated as a netting set for this purpose, since it is those aggregate net cash flows that are subject to nonperformance risk. This process identifies specific, point-in-time future cash flows that are subject to nonperformance risk and unsecured funding, rather than using the current recognized net asset or liability as a basis to measure the CVA and FVA. |
|
|
• |
Second, for CVA, market-based views of default probabilities derived from observed credit spreads in the credit default swap (CDS) market are applied to the expected future cash flows determined in step one. Citi’s own-credit CVA is determined using Citi-specific CDS spreads for the relevant tenor. Generally, counterparty CVA is determined using CDS spread indices for each credit rating and tenor. For certain identified netting sets where individual analysis is practicable (e.g., exposures to counterparties with liquid CDSs), counterparty-specific CDS spreads are used. For FVA, a term structure of future liquidity spreads is applied to the expected future funding requirement. |
The CVA and FVA are designed to incorporate a market view of the credit and funding risk, respectively, inherent in
the derivative portfolio. However, most unsecured derivative instruments are negotiated bilateral contracts and are not commonly transferred to third parties. Derivative instruments are normally settled contractually or, if terminated early, are terminated at a value negotiated bilaterally between the counterparties. Thus, the CVA and FVA may not be realized upon a settlement or termination in the normal course of business. In addition, all or a portion of these adjustments may be reversed or otherwise adjusted in future periods in the event of changes in the credit or funding risk associated with the derivative instruments.
The table below summarizes the CVA and FVA applied to the fair value of derivative instruments at December 31, 2017 and 2016:
|
|
|
|
|
|
|
|
|
Credit and funding valuation adjustments
contra-liability (contra-asset)
|
In millions of dollars |
December 31,
2017 |
December 31,
2016 |
Counterparty CVA |
$ |
(970 |
) |
$ |
(1,488 |
) |
Asset FVA |
(447 |
) |
(536 |
) |
Citigroup (own-credit) CVA |
287 |
|
459 |
|
Liability FVA |
47 |
|
62 |
|
Total CVA—derivative instruments(1)
|
$ |
(1,083 |
) |
$ |
(1,503 |
) |
|
|
(1) |
FVA is included with CVA for presentation purposes. |
The table below summarizes pretax gains (losses) related to changes in CVA on derivative instruments, net of hedges, FVA on derivatives and debt valuation adjustments (DVA) on Citi’s own fair value option (FVO) liabilities for the years indicated:
|
|
|
|
|
|
|
|
|
|
|
|
Credit/funding/debt valuation
adjustments gain (loss)
|
In millions of dollars |
2017 |
2016 |
2015 |
Counterparty CVA |
$ |
276 |
|
$ |
157 |
|
$ |
(115 |
) |
Asset FVA |
90 |
|
47 |
|
(66 |
) |
Own-credit CVA |
(153 |
) |
17 |
|
(28 |
) |
Liability FVA |
(15 |
) |
(44 |
) |
97 |
|
Total CVA—derivative instruments |
$ |
198 |
|
$ |
177 |
|
$ |
(112 |
) |
DVA related to own FVO liabilities(1)
|
$ |
(680 |
) |
$ |
(538 |
) |
$ |
367 |
|
Total CVA and DVA(2)
|
$ |
(482 |
) |
$ |
(361 |
) |
$ |
255 |
|
|
|
(1) |
Effective January 1, 2016, Citigroup early adopted on a prospective basis only the provisions of ASU No. 2016-01, Financial Instruments—Overall (Subtopic 825-10): Recognition and Measurement of Financial Assets and Financial Liabilities, related to the presentation of DVA on fair value option liabilities. Accordingly, beginning in the first quarter of 2016, the portion of the change in fair value of these liabilities related to changes in Citigroup’s own credit spreads (DVA) is reflected as a component of AOCI; previously these amounts were recognized in Citigroup’s revenues and net income. DVA amounts in AOCI will be recognized in revenue and net income if realized upon the settlement of the related liability.
|
|
|
(2) |
FVA is included with CVA for presentation purposes. |
Valuation Process for Fair Value Measurements
Price verification procedures and related internal control procedures are governed by the Citigroup Pricing and Price Verification Policy and Standards, which is jointly owned by Finance and Risk Management.
For fair value measurements of substantially all assets and liabilities held by the Company, individual business units are responsible for valuing the trading account assets and liabilities, and Product Control within Finance performs independent price verification procedures to evaluate those fair value measurements. Product Control is independent of the individual business units and reports to the Global Head of Product Control. It has authority over the valuation of financial assets and liabilities. Fair value measurements of assets and liabilities are determined using various techniques, including, but not limited to, discounted cash flows and internal models, such as option and correlation models.
Based on the observability of inputs used, Product Control classifies the inventory as Level 1, Level 2 or Level 3 of the fair value hierarchy. When a position involves one or more significant inputs that are not directly observable, price verification procedures are performed that may include reviewing relevant historical data, analyzing profit and loss, valuing each component of a structured trade individually and benchmarking, among others.
Reports of inventory that is classified within Level 3 of the fair value hierarchy are distributed to senior management in Finance, Risk and the business. This inventory is also discussed in Risk Committees and in monthly meetings with senior trading management. As deemed necessary, reports may go to the Audit Committee of the Board of Directors or to the full Board of Directors. Whenever an adjustment is needed to bring the price of an asset or liability to its exit price, Product Control reports it to management along with other price verification results.
In addition, the pricing models used in measuring fair value are governed by an independent control framework. Although the models are developed and tested by the individual business units, they are independently validated by the Model Validation Group within Risk Management and reviewed by Finance with respect to their impact on the price verification procedures. The purpose of this independent control framework is to assess model risk arising from models’ theoretical soundness, calibration techniques where needed and the appropriateness of the model for a specific product in a defined market. To ensure their continued applicability, models are independently reviewed annually. In addition, Risk Management approves and maintains a list of products permitted to be valued under each approved model for a given business.
Securities Purchased Under Agreements to Resell and Securities Sold Under Agreements to Repurchase
No quoted prices exist for these instruments, so fair value is determined using a discounted cash flow technique. Cash flows are estimated based on the terms of the contract, taking into account any embedded derivative or other features. These cash flows are discounted using interest rates appropriate to the maturity of the instrument as well as the nature of the underlying collateral. Generally, when such instruments are recorded at fair value, they are classified within Level 2 of the fair value hierarchy, as the inputs used in the valuation are readily observable. However, certain long-dated positions are classified within Level 3 of the fair value hierarchy.
Trading Account Assets and Liabilities—Trading Securities and Trading Loans
When available, the Company uses quoted market prices in active markets to determine the fair value of trading securities; such items are classified as Level 1 of the fair value hierarchy. Examples include government securities and exchange-traded equity securities.
For bonds and secondary market loans traded over the counter, the Company generally determines fair value utilizing valuation techniques, including discounted cash flows, price-based and internal models, such as Black-Scholes and Monte Carlo simulation. Fair value estimates from these internal valuation techniques are verified, where possible, to prices obtained from independent sources, including third-party vendors. Vendors compile prices from various sources and may apply matrix pricing for similar bonds or loans where no price is observable. A price-based methodology utilizes, where available, quoted prices or other market information obtained from recent trading activity of assets with similar characteristics to the bond or loan being valued. The yields used in discounted cash flow models are derived from the same price information. Trading securities and loans priced using such methods are generally classified as Level 2. However, when less liquidity exists for a security or loan, a quoted price is stale, a significant adjustment to the price of a similar security or loan is necessary to reflect differences in the terms of the actual security or loan being valued, or prices from independent sources are insufficient to corroborate valuation, a loan or security is generally classified as Level 3. The price input used in a price-based methodology may be zero for a security, such as a subprime CDO, that is not receiving any principal or interest and is currently written down to zero.
When the Company’s principal market for a portfolio of loans is the securitization market, the Company uses the securitization price to determine the fair value of the portfolio. The securitization price is determined from the assumed proceeds of a hypothetical securitization in the current market, adjusted for transformation costs (i.e., direct costs other than transaction costs) and securitization uncertainties such as market conditions and liquidity. As a result of the severe reduction in the level of activity in certain securitization markets since the second half of 2007, observable securitization prices for certain directly
comparable portfolios of loans have not been readily available. Therefore, such portfolios of loans are generally classified as Level 3 of the fair value hierarchy. However, for other loan securitization markets, such as commercial real estate loans, price verification of the hypothetical securitizations has been possible, since these markets have remained active. Accordingly, this loan portfolio is classified as Level 2 of the fair value hierarchy.
For most of the lending and structured direct subprime exposures, fair value is determined utilizing observable transactions where available, other market data for similar assets in markets that are not active and other internal valuation techniques. The valuation of certain asset-backed security (ABS) CDO positions utilizes prices based on the underlying assets of the ABS CDO.
Trading Account Assets and Liabilities—Derivatives
Exchange-traded derivatives, measured at fair value using quoted (i.e., exchange) prices in active markets, where available, are classified as Level 1 of the fair value hierarchy.
Derivatives without a quoted price in an active market and derivatives executed over the counter are valued using internal valuation techniques. These derivative instruments are classified as either Level 2 or Level 3 depending upon the observability of the significant inputs to the model.
The valuation techniques and inputs depend on the type of derivative and the nature of the underlying instrument. The principal techniques used to value these instruments are discounted cash flows and internal models, including Black-Scholes and Monte Carlo simulation.
The key inputs depend upon the type of derivative and the nature of the underlying instrument and include interest rate yield curves, foreign exchange rates, volatilities and correlation. The Company uses overnight indexed swap (OIS) curves as fair value measurement inputs for the valuation of certain collateralized derivatives. Citi uses the relevant benchmark curve for the currency of the derivative (e.g., the London Interbank Offered Rate for U.S.-dollar derivatives) as the discount rate for uncollateralized derivatives.
As referenced above, during the third quarter of 2016, Citi incorporated FVA into the fair value measurements due to what it believes to be an industry migration toward incorporating the market’s view of funding risk premium in OTC derivatives. The charge incurred in connection with the implementation of FVA was reflected in Principal transactions as a change in accounting estimate. Citi’s FVA methodology leverages the existing CVA methodology to estimate a funding exposure profile. The calculation of this exposure profile considers collateral agreements where the terms do not permit the Company to reuse the collateral received, including where counterparties post collateral to third-party custodians.
Investments
The investments category includes available-for-sale debt and marketable equity securities whose fair values are generally determined by utilizing similar procedures described for trading securities above or, in some cases, using vendor pricing as the primary source.
Also included in investments are nonpublic investments in private equity and real estate entities. Determining the fair value of nonpublic securities involves a significant degree of management judgment, as no quoted prices exist and such securities are generally thinly traded. In addition, there may be transfer restrictions on private equity securities. The Company’s process for determining the fair value of such securities utilizes commonly accepted valuation techniques, including comparables analysis. In determining the fair value of nonpublic securities, the Company also considers events such as a proposed sale of the investee company, initial public offerings, equity issuances or other observable transactions.
Private equity securities are generally classified as Level 3 of the fair value hierarchy.
In addition, the Company holds investments in certain alternative investment funds that calculate NAV per share, including hedge funds, private equity funds and real estate funds. Investments in funds are generally classified as non-marketable equity securities carried at fair value. The fair values of these investments are estimated using the NAV per share of the Company’s ownership interest in the funds where it is not probable that the investment will be realized at a price other than the NAV. Consistent with the provisions of ASU 2015-07 these investments have not been categorized within the fair value hierarchy and are not included in the tables below. See Note 13 to the Consolidated Financial Statements for additional information.
Short-Term Borrowings and Long-Term Debt
Where fair value accounting has been elected, the fair value of non-structured liabilities is determined by utilizing internal models using the appropriate discount rate for the applicable maturity. Such instruments are generally classified as Level 2 of the fair value hierarchy when all significant inputs are readily observable.
The Company determines the fair value of hybrid financial instruments, including structured liabilities, using the appropriate derivative valuation methodology (described above in “Trading Account Assets and Liabilities—Derivatives”) given the nature of the embedded risk profile. Such instruments are classified as Level 2 or Level 3 depending on the observability of significant inputs to the model.
Items Measured at Fair Value on a Recurring Basis
The following tables present for each of the fair value hierarchy levels the Company’s assets and liabilities that are measured at fair value on a recurring basis at December 31, 2017 and December 31, 2016. The Company may hedge positions that have been classified in the Level 3 category with
other financial instruments (hedging instruments) that may be classified as Level 3, but also with financial instruments classified as Level 1 or Level 2 of the fair value hierarchy. The effects of these hedges are presented gross in the following tables:
Fair Value Levels
|
|
|
|
|
|
|
|
|
|
|
|
|
|
|
|
|
|
|
|
In millions of dollars at December 31, 2017 |
Level 1(1)
|
Level 2(1)
|
Level 3 |
Gross
inventory |
Netting(2)
|
Net
balance |
Assets |
|
|
|
|
|
|
Federal funds sold and securities borrowed or purchased under agreements to resell |
$ |
— |
|
$ |
188,571 |
|
$ |
16 |
|
$ |
188,587 |
|
$ |
(55,638 |
) |
$ |
132,949 |
|
Trading non-derivative assets |
|
|
|
|
|
|
Trading mortgage-backed securities |
|
|
|
|
|
|
U.S. government-sponsored agency guaranteed |
— |
|
22,801 |
|
163 |
|
22,964 |
|
— |
|
22,964 |
|
Residential |
— |
|
649 |
|
164 |
|
813 |
|
— |
|
813 |
|
Commercial |
— |
|
1,309 |
|
57 |
|
1,366 |
|
— |
|
1,366 |
|
Total trading mortgage-backed securities |
$ |
— |
|
$ |
24,759 |
|
$ |
384 |
|
$ |
25,143 |
|
$ |
— |
|
$ |
25,143 |
|
U.S. Treasury and federal agency securities |
$ |
17,524 |
|
$ |
3,613 |
|
$ |
— |
|
$ |
21,137 |
|
$ |
— |
|
$ |
21,137 |
|
State and municipal |
— |
|
4,426 |
|
274 |
|
4,700 |
|
— |
|
4,700 |
|
Foreign government |
39,347 |
|
20,843 |
|
16 |
|
60,206 |
|
— |
|
60,206 |
|
Corporate |
301 |
|
15,129 |
|
275 |
|
15,705 |
|
— |
|
15,705 |
|
Equity securities |
53,305 |
|
6,794 |
|
120 |
|
60,219 |
|
— |
|
60,219 |
|
Asset-backed securities |
— |
|
1,198 |
|
1,590 |
|
2,788 |
|
— |
|
2,788 |
|
Other trading assets(3)
|
3 |
|
11,105 |
|
615 |
|
11,723 |
|
— |
|
11,723 |
|
Total trading non-derivative assets |
$ |
110,480 |
|
$ |
87,867 |
|
$ |
3,274 |
|
$ |
201,621 |
|
$ |
— |
|
$ |
201,621 |
|
Trading derivatives |
|
|
|
|
|
|
Interest rate contracts |
$ |
145 |
|
$ |
201,663 |
|
$ |
1,708 |
|
$ |
203,516 |
|
|
|
Foreign exchange contracts |
19 |
|
120,624 |
|
577 |
|
121,220 |
|
|
|
Equity contracts |
2,364 |
|
24,170 |
|
444 |
|
26,978 |
|
|
|
Commodity contracts |
282 |
|
13,252 |
|
569 |
|
14,103 |
|
|
|
Credit derivatives |
— |
|
19,574 |
|
910 |
|
20,484 |
|
|
|
Total trading derivatives |
$ |
2,810 |
|
$ |
379,283 |
|
$ |
4,208 |
|
$ |
386,301 |
|
|
|
Cash collateral paid(4)
|
|
|
|
$ |
7,541 |
|
|
|
Netting agreements |
|
|
|
|
$ |
(306,401 |
) |
|
Netting of cash collateral received |
|
|
|
|
(37,506 |
) |
|
Total trading derivatives |
$ |
2,810 |
|
$ |
379,283 |
|
$ |
4,208 |
|
$ |
393,842 |
|
$ |
(343,907 |
) |
$ |
49,935 |
|
Investments |
|
|
|
|
|
|
Mortgage-backed securities |
|
|
|
|
|
|
U.S. government-sponsored agency guaranteed |
$ |
— |
|
$ |
41,717 |
|
$ |
24 |
|
$ |
41,741 |
|
$ |
— |
|
$ |
41,741 |
|
Residential |
— |
|
2,884 |
|
— |
|
2,884 |
|
— |
|
2,884 |
|
Commercial |
— |
|
329 |
|
3 |
|
332 |
|
— |
|
332 |
|
Total investment mortgage-backed securities |
$ |
— |
|
$ |
44,930 |
|
$ |
27 |
|
$ |
44,957 |
|
$ |
— |
|
$ |
44,957 |
|
U.S. Treasury and federal agency securities |
$ |
106,964 |
|
$ |
11,182 |
|
$ |
— |
|
$ |
118,146 |
|
$ |
— |
|
$ |
118,146 |
|
State and municipal |
— |
|
8,028 |
|
737 |
|
8,765 |
|
— |
|
8,765 |
|
Foreign government |
56,456 |
|
43,985 |
|
92 |
|
100,533 |
|
— |
|
100,533 |
|
Corporate |
1,911 |
|
12,127 |
|
71 |
|
14,109 |
|
— |
|
14,109 |
|
Equity securities |
176 |
|
11 |
|
2 |
|
189 |
|
— |
|
189 |
|
Asset-backed securities |
— |
|
3,091 |
|
827 |
|
3,918 |
|
— |
|
3,918 |
|
Other debt securities |
— |
|
297 |
|
— |
|
297 |
|
— |
|
297 |
|
Non-marketable equity securities(5)
|
— |
|
121 |
|
681 |
|
802 |
|
— |
|
802 |
|
Total investments |
$ |
165,507 |
|
$ |
123,772 |
|
$ |
2,437 |
|
$ |
291,716 |
|
$ |
— |
|
$ |
291,716 |
|
Table continues on the next page, including footnotes.
|
|
|
|
|
|
|
|
|
|
|
|
|
|
|
|
|
|
|
|
In millions of dollars at December 31, 2017 |
Level 1(1)
|
Level 2(1)
|
Level 3 |
Gross
inventory |
Netting(2)
|
Net
balance |
Loans |
$ |
— |
|
$ |
3,824 |
|
$ |
550 |
|
$ |
4,374 |
|
$ |
— |
|
$ |
4,374 |
|
Mortgage servicing rights |
— |
|
— |
|
558 |
|
558 |
|
— |
|
558 |
|
Non-trading derivatives and other financial assets measured on a recurring basis, gross |
$ |
13,903 |
|
$ |
6,900 |
|
$ |
16 |
|
$ |
20,819 |
|
|
|
Cash collateral paid(6)
|
|
|
|
— |
|
|
|
Netting of cash collateral received |
|
|
|
|
$ |
(1,026 |
) |
|
Non-trading derivatives and other financial assets measured on a recurring basis |
$ |
13,903 |
|
$ |
6,900 |
|
$ |
16 |
|
$ |
20,819 |
|
$ |
(1,026 |
) |
$ |
19,793 |
|
Total assets |
$ |
292,700 |
|
$ |
790,217 |
|
$ |
11,059 |
|
$ |
1,101,517 |
|
$ |
(400,571 |
) |
$ |
700,946 |
|
Total as a percentage of gross assets(7)
|
26.8 |
% |
72.2 |
% |
1.0 |
% |
|
|
|
|
|
|
Liabilities |
|
|
|
|
|
|
Interest-bearing deposits |
$ |
— |
|
$ |
1,179 |
|
$ |
286 |
|
$ |
1,465 |
|
$ |
— |
|
$ |
1,465 |
|
Federal funds purchased and securities loaned or sold under agreements to repurchase |
— |
|
95,550 |
|
726 |
|
96,276 |
|
(55,638 |
) |
40,638 |
|
Trading account liabilities |
|
|
|
|
|
|
Securities sold, not yet purchased |
65,843 |
|
10,306 |
|
22 |
|
76,171 |
|
— |
|
76,171 |
|
Other trading liabilities |
— |
|
1,409 |
|
5 |
|
1,414 |
|
— |
|
1,414 |
|
Total trading liabilities |
$ |
65,843 |
|
$ |
11,715 |
|
$ |
27 |
|
$ |
77,585 |
|
$ |
— |
|
$ |
77,585 |
|
Trading derivatives |
|
|
|
|
|
|
Interest rate contracts |
$ |
137 |
|
$ |
182,162 |
|
$ |
2,130 |
|
$ |
184,429 |
|
|
|
Foreign exchange contracts |
9 |
|
119,719 |
|
447 |
|
120,175 |
|
|
|
Equity contracts |
2,430 |
|
26,472 |
|
2,471 |
|
31,373 |
|
|
|
Commodity contracts |
115 |
|
14,482 |
|
2,430 |
|
17,027 |
|
|
|
Credit derivatives |
— |
|
19,513 |
|
1,709 |
|
21,222 |
|
|
|
Total trading derivatives |
$ |
2,691 |
|
$ |
362,348 |
|
$ |
9,187 |
|
$ |
374,226 |
|
|
|
Cash collateral received(8)
|
|
|
|
$ |
14,296 |
|
|
|
Netting agreements |
|
|
|
|
$ |
(306,401 |
) |
|
Netting of cash collateral paid |
|
|
|
|
(35,659 |
) |
|
Total trading derivatives |
$ |
2,691 |
|
$ |
362,348 |
|
$ |
9,187 |
|
$ |
388,522 |
|
$ |
(342,060 |
) |
$ |
46,462 |
|
Short-term borrowings |
$ |
— |
|
$ |
4,609 |
|
$ |
18 |
|
$ |
4,627 |
|
$ |
— |
|
$ |
4,627 |
|
Long-term debt |
— |
|
18,310 |
|
13,082 |
|
31,392 |
|
— |
|
31,392 |
|
Non-trading derivatives and other financial liabilities measured on a recurring basis, gross |
$ |
13,903 |
|
$ |
1,168 |
|
$ |
8 |
|
$ |
15,079 |
|
|
|
Cash collateral received(9)
|
|
|
|
12 |
|
|
|
Netting of cash collateral paid |
|
|
|
|
$ |
(7 |
) |
|
Total non-trading derivatives and other financial liabilities measured on a recurring basis |
$ |
13,903 |
|
$ |
1,168 |
|
$ |
8 |
|
$ |
15,091 |
|
$ |
(7 |
) |
$ |
15,084 |
|
Total liabilities |
$ |
82,437 |
|
$ |
494,879 |
|
$ |
23,334 |
|
$ |
614,958 |
|
$ |
(397,705 |
) |
$ |
217,253 |
|
Total as a percentage of gross liabilities(7)
|
13.7 |
% |
82.4 |
% |
3.9 |
% |
|
|
|
|
|
(1) |
In 2017, the Company transferred assets of approximately $4.8 billion from Level 1 to Level 2, primarily related to foreign government securities and equity securities not traded in active markets. In 2017, the Company transferred assets of approximately $4.0 billion from Level 2 to Level 1, primarily related to foreign government bonds and equity securities traded with sufficient frequency to constitute a liquid market. In 2017, the Company transferred liabilities of approximately $0.4 billion from Level 1 to Level 2. In 2017, the Company transferred liabilities of approximately $0.3 billion from Level 2 to Level 1.
|
|
|
(2) |
Represents netting of (i) the amounts due under securities purchased under agreements to resell and the amounts owed under securities sold under agreements to repurchase and (ii) derivative exposures covered by a qualifying master netting agreement and cash collateral offsetting. |
|
|
(3) |
Includes positions related to investments in unallocated precious metals, as discussed in Note 25 to the Consolidated Financial Statements. Also includes physical commodities accounted for at the lower of cost or fair value and unfunded credit products. |
|
|
(4) |
Reflects the net amount of $43,200 million of gross cash collateral paid, of which $35,659 million was used to offset trading derivative liabilities.
|
|
|
(5) |
Amounts exclude $0.4 billion of investments measured at Net Asset Value (NAV) in accordance with ASU No. 2015-07, Fair Value Measurement (Topic 820): Disclosures for Investments in Certain Entities That Calculate Net Asset Value per Share (or Its Equivalent).
|
|
|
(6) |
Reflects the net amount of $7 million of gross cash collateral paid, all of which was used to offset non-trading derivative liabilities.
|
|
|
(7) |
Because the amount of the cash collateral paid/received has not been allocated to the Level 1, 2 and 3 subtotals, these percentages are calculated based on total assets and liabilities measured at fair value on a recurring basis, excluding the cash collateral paid/received on derivatives. |
|
|
(8) |
Reflects the net amount of $51,802 million of gross cash collateral received, of which $37,506 million was used to offset trading derivative assets.
|
|
|
(9) |
Reflects the net amount of $1,038 million of gross cash collateral received, of which $1,026 million was used to offset non-trading derivatives.
|
Fair Value Levels
|
|
|
|
|
|
|
|
|
|
|
|
|
|
|
|
|
|
|
|
In millions of dollars at December 31, 2016 |
Level 1(1)
|
Level 2(1)
|
Level 3 |
Gross
inventory |
Netting(2)
|
Net
balance |
Assets |
|
|
|
|
|
|
Federal funds sold and securities borrowed or purchased under agreements to resell |
$ |
— |
|
$ |
172,394 |
|
$ |
1,496 |
|
$ |
173,890 |
|
$ |
(40,686 |
) |
$ |
133,204 |
|
Trading non-derivative assets |
|
|
|
|
|
|
Trading mortgage-backed securities |
|
|
|
|
|
|
U.S. government-sponsored agency guaranteed |
— |
|
22,718 |
|
176 |
|
22,894 |
|
— |
|
22,894 |
|
Residential |
— |
|
291 |
|
399 |
|
690 |
|
— |
|
690 |
|
Commercial |
— |
|
1,000 |
|
206 |
|
1,206 |
|
— |
|
1,206 |
|
Total trading mortgage-backed securities |
$ |
— |
|
$ |
24,009 |
|
$ |
781 |
|
$ |
24,790 |
|
$ |
— |
|
$ |
24,790 |
|
U.S. Treasury and federal agency securities |
$ |
16,368 |
|
$ |
4,811 |
|
$ |
1 |
|
$ |
21,180 |
|
$ |
— |
|
$ |
21,180 |
|
State and municipal |
— |
|
3,780 |
|
296 |
|
4,076 |
|
— |
|
4,076 |
|
Foreign government |
32,164 |
|
17,492 |
|
40 |
|
49,696 |
|
— |
|
49,696 |
|
Corporate |
424 |
|
14,199 |
|
324 |
|
14,947 |
|
— |
|
14,947 |
|
Equity securities |
45,056 |
|
5,260 |
|
127 |
|
50,443 |
|
— |
|
50,443 |
|
Asset-backed securities |
— |
|
892 |
|
1,868 |
|
2,760 |
|
— |
|
2,760 |
|
Other trading assets(3)
|
— |
|
9,466 |
|
2,814 |
|
12,280 |
|
— |
|
12,280 |
|
Total trading non-derivative assets |
$ |
94,012 |
|
$ |
79,909 |
|
$ |
6,251 |
|
$ |
180,172 |
|
$ |
— |
|
$ |
180,172 |
|
Trading derivatives |
|
|
|
|
|
|
Interest rate contracts |
$ |
105 |
|
$ |
366,995 |
|
$ |
2,225 |
|
$ |
369,325 |
|
|
|
Foreign exchange contracts |
53 |
|
184,776 |
|
833 |
|
185,662 |
|
|
|
Equity contracts |
2,306 |
|
21,209 |
|
595 |
|
24,110 |
|
|
|
Commodity contracts |
261 |
|
12,999 |
|
505 |
|
13,765 |
|
|
|
Credit derivatives |
— |
|
23,021 |
|
1,594 |
|
24,615 |
|
|
|
Total trading derivatives |
$ |
2,725 |
|
$ |
609,000 |
|
$ |
5,752 |
|
$ |
617,477 |
|
|
|
Cash collateral paid(4)
|
|
|
|
$ |
11,188 |
|
|
|
Netting agreements |
|
|
|
|
$ |
(519,000 |
) |
|
Netting of cash collateral received |
|
|
|
|
(45,912 |
) |
|
Total trading derivatives |
$ |
2,725 |
|
$ |
609,000 |
|
$ |
5,752 |
|
$ |
628,665 |
|
$ |
(564,912 |
) |
$ |
63,753 |
|
Investments |
|
|
|
|
|
|
Mortgage-backed securities |
|
|
|
|
|
|
U.S. government-sponsored agency guaranteed |
$ |
— |
|
$ |
38,304 |
|
$ |
101 |
|
$ |
38,405 |
|
$ |
— |
|
$ |
38,405 |
|
Residential |
— |
|
3,860 |
|
50 |
|
3,910 |
|
— |
|
3,910 |
|
Commercial |
— |
|
358 |
|
— |
|
358 |
|
— |
|
358 |
|
Total investment mortgage-backed securities |
$ |
— |
|
$ |
42,522 |
|
$ |
151 |
|
$ |
42,673 |
|
$ |
— |
|
$ |
42,673 |
|
U.S. Treasury and federal agency securities |
$ |
112,916 |
|
$ |
10,753 |
|
$ |
2 |
|
$ |
123,671 |
|
$ |
— |
|
$ |
123,671 |
|
State and municipal |
— |
|
8,909 |
|
1,211 |
|
10,120 |
|
— |
|
10,120 |
|
Foreign government |
54,028 |
|
43,934 |
|
186 |
|
98,148 |
|
— |
|
98,148 |
|
Corporate |
3,215 |
|
13,598 |
|
311 |
|
17,124 |
|
— |
|
17,124 |
|
Equity securities |
336 |
|
46 |
|
9 |
|
391 |
|
— |
|
391 |
|
Asset-backed securities |
— |
|
6,134 |
|
660 |
|
6,794 |
|
— |
|
6,794 |
|
Other debt securities |
— |
|
503 |
|
— |
|
503 |
|
— |
|
503 |
|
Non-marketable equity securities(5)
|
— |
|
35 |
|
1,331 |
|
1,366 |
|
— |
|
1,366 |
|
Total investments |
$ |
170,495 |
|
$ |
126,434 |
|
$ |
3,861 |
|
$ |
300,790 |
|
$ |
— |
|
$ |
300,790 |
|
|
|
|
|
|
|
|
|
|
|
|
|
|
|
|
|
|
|
|
|
In millions of dollars at December 31, 2016 |
Level 1(1)
|
Level 2(1)
|
Level 3 |
Gross
inventory |
Netting(2)
|
Net
balance |
Loans |
$ |
— |
|
$ |
2,918 |
|
$ |
568 |
|
$ |
3,486 |
|
$ |
— |
|
$ |
3,486 |
|
Mortgage servicing rights |
— |
|
— |
|
1,564 |
|
1,564 |
|
— |
|
1,564 |
|
Non-trading derivatives and other financial assets measured on a recurring basis, gross |
$ |
9,300 |
|
$ |
7,732 |
|
$ |
34 |
|
$ |
17,066 |
|
|
|
Cash collateral paid(6)
|
|
|
|
8 |
|
|
|
Netting of cash collateral received |
|
|
|
|
$ |
(1,345 |
) |
|
Non-trading derivatives and other financial assets measured on a recurring basis |
$ |
9,300 |
|
$ |
7,732 |
|
$ |
34 |
|
$ |
17,074 |
|
$ |
(1,345 |
) |
$ |
15,729 |
|
Total assets |
$ |
276,532 |
|
$ |
998,387 |
|
$ |
19,526 |
|
$ |
1,305,641 |
|
$ |
(606,943 |
) |
$ |
698,698 |
|
Total as a percentage of gross assets(7)
|
21.4 |
% |
77.1 |
% |
1.5 |
% |
|
|
|
Liabilities |
|
|
|
|
|
|
Interest-bearing deposits |
$ |
— |
|
$ |
919 |
|
$ |
293 |
|
$ |
1,212 |
|
$ |
— |
|
$ |
1,212 |
|
Federal funds purchased and securities loaned or sold under agreements to repurchase |
— |
|
73,500 |
|
849 |
|
74,349 |
|
(40,686 |
) |
33,663 |
|
Trading account liabilities |
|
|
|
|
|
|
Securities sold, not yet purchased |
67,429 |
|
12,184 |
|
1,177 |
|
80,790 |
|
— |
|
80,790 |
|
Other trading liabilities |
— |
|
1,827 |
|
1 |
|
1,828 |
|
— |
|
1,828 |
|
Total trading liabilities |
$ |
67,429 |
|
$ |
14,011 |
|
$ |
1,178 |
|
$ |
82,618 |
|
$ |
— |
|
$ |
82,618 |
|
Trading account derivatives |
|
|
|
|
|
|
Interest rate contracts |
$ |
107 |
|
$ |
351,766 |
|
$ |
2,888 |
|
$ |
354,761 |
|
|
|
Foreign exchange contracts |
13 |
|
187,328 |
|
420 |
|
187,761 |
|
|
|
Equity contracts |
2,245 |
|
22,119 |
|
2,152 |
|
26,516 |
|
|
|
Commodity contracts |
196 |
|
12,386 |
|
2,450 |
|
15,032 |
|
|
|
Credit derivatives |
— |
|
22,842 |
|
2,595 |
|
25,437 |
|
|
|
Total trading derivatives |
$ |
2,561 |
|
$ |
596,441 |
|
$ |
10,505 |
|
$ |
609,507 |
|
|
|
Cash collateral received(8)
|
|
|
|
$ |
15,731 |
|
|
|
Netting agreements |
|
|
|
|
$ |
(519,000 |
) |
|
Netting of cash collateral paid |
|
|
|
|
(49,811 |
) |
|
Total trading derivatives |
$ |
2,561 |
|
$ |
596,441 |
|
$ |
10,505 |
|
$ |
625,238 |
|
$ |
(568,811 |
) |
$ |
56,427 |
|
Short-term borrowings |
$ |
— |
|
$ |
2,658 |
|
$ |
42 |
|
$ |
2,700 |
|
$ |
— |
|
$ |
2,700 |
|
Long-term debt |
— |
|
16,510 |
|
9,744 |
|
26,254 |
|
— |
|
26,254 |
|
Non-trading derivatives and other financial liabilities measured on a recurring basis, gross |
$ |
9,300 |
|
$ |
1,540 |
|
$ |
8 |
|
$ |
10,848 |
|
|
|
Cash collateral received(9)
|
|
|
|
1 |
|
|
|
Netting of cash collateral paid |
|
|
|
|
$ |
(53 |
) |
|
Non-trading derivatives and other financial liabilities measured on a recurring basis |
$ |
9,300 |
|
$ |
1,540 |
|
$ |
8 |
|
$ |
10,849 |
|
$ |
(53 |
) |
$ |
10,796 |
|
Total liabilities |
$ |
79,290 |
|
$ |
705,579 |
|
$ |
22,619 |
|
$ |
823,220 |
|
$ |
(609,550 |
) |
$ |
213,670 |
|
Total as a percentage of gross liabilities(6)
|
9.8 |
% |
87.4 |
% |
2.8 |
% |
|
|
|
|
|
(1) |
In 2016, the Company transferred assets of approximately $2.6 billion from Level 1 to Level 2, respectively, primarily related to foreign government securities and equity securities not traded in active markets. In 2016, the Company transferred assets of approximately $4.0 billion from Level 2 to Level 1, respectively, primarily related to foreign government bonds and equity securities traded with sufficient frequency to constitute a liquid market. In 2016, the Company transferred liabilities of approximately $0.4 billion from Level 2 to Level 1. In 2016, the Company transferred liabilities of approximately $0.3 billion from Level 1 to Level 2.
|
|
|
(2) |
Represents netting of (i) the amounts due under securities purchased under agreements to resell and the amounts owed under securities sold under agreements to repurchase; and (ii) derivative exposures covered by a qualifying master netting agreement and cash collateral offsetting. |
|
|
(3) |
Includes positions related to investments in unallocated precious metals, as discussed in Note 25 to the Consolidated Financial Statements. Also includes physical commodities accounted for at the lower of cost or fair value and unfunded credit products. |
|
|
(4) |
Reflects the net amount of $60,999 million of gross cash collateral paid, of which $49,811 million was used to offset trading derivative liabilities.
|
|
|
(5) |
Amounts exclude $0.4 billion investments measured at Net Asset Value (NAV) in accordance with ASU 2015-07.
|
|
|
(6) |
Reflects the net amount of $61 million of gross cash collateral paid, of which $53 million was used to offset non-trading derivative liabilities.
|
|
|
(7) |
Because the amount of the cash collateral paid/received has not been allocated to the Level 1, 2 and 3 subtotals, these percentages are calculated based on total assets and liabilities measured at fair value on a recurring basis, excluding the cash collateral paid/received on derivatives. |
|
|
(8) |
Reflects the net amount of $61,643 million of gross cash collateral received, of which $45,912 million was used to offset trading derivative assets.
|
|
|
(9) |
Reflects the net amount of $1,346 million of gross cash collateral received, of which $1,345 million was used to offset non-trading derivative assets.
|
Changes in Level 3 Fair Value Category
The following tables present the changes in the Level 3 fair value category for the years ended December 31, 2017 and 2016. The gains and losses presented below include changes in the fair value related to both observable and unobservable inputs.
The Company often hedges positions with offsetting positions that are classified in a different level. For example, the gains and losses for assets and liabilities in the Level 3
category presented in the tables below do not reflect the effect of offsetting losses and gains on hedging instruments that may be classified in the Level 1 and Level 2 categories. In addition, the Company hedges items classified in the Level 3 category with instruments also classified in Level 3 of the fair value hierarchy. The hedged items and related hedges are presented gross in the following tables:
Level 3 Fair Value Rollforward
|
|
|
|
|
|
|
|
|
|
|
|
|
|
|
|
|
|
|
|
|
|
|
|
|
|
|
|
|
|
|
|
|
|
|
|
|
Net realized/unrealized
gains (losses) included in |
Transfers |
|
|
|
|
|
Unrealized
gains/
(losses)
still held(3)
|
In millions of dollars |
Dec. 31, 2016 |
Principal
transactions |
Other(1)(2)
|
into
Level 3 |
out of
Level 3 |
Purchases |
Issuances |
Sales |
Settlements |
Dec. 31, 2017 |
Assets |
|
|
|
|
|
|
|
|
|
|
|
Federal funds sold and securities borrowed or purchased under agreements to resell |
$ |
1,496 |
|
$ |
(281 |
) |
$ |
— |
|
$ |
— |
|
$ |
(1,198 |
) |
$ |
— |
|
$ |
— |
|
$ |
— |
|
$ |
(1 |
) |
$ |
16 |
|
$ |
1 |
|
Trading non-derivative assets |
|
|
|
|
|
|
|
|
|
|
|
Trading mortgage-backed securities |
|
|
|
|
|
|
|
|
|
|
|
U.S. government-sponsored agency guaranteed |
176 |
|
23 |
|
— |
|
176 |
|
(174 |
) |
463 |
|
— |
|
(504 |
) |
3 |
|
163 |
|
2 |
|
Residential |
399 |
|
86 |
|
— |
|
95 |
|
(118 |
) |
126 |
|
— |
|
(424 |
) |
— |
|
164 |
|
14 |
|
Commercial |
206 |
|
15 |
|
— |
|
69 |
|
(57 |
) |
450 |
|
— |
|
(626 |
) |
— |
|
57 |
|
(5 |
) |
Total trading mortgage-backed securities |
$ |
781 |
|
$ |
124 |
|
$ |
— |
|
$ |
340 |
|
$ |
(349 |
) |
$ |
1,039 |
|
$ |
— |
|
$ |
(1,554 |
) |
$ |
3 |
|
$ |
384 |
|
$ |
11 |
|
U.S. Treasury and federal agency securities |
$ |
1 |
|
$ |
— |
|
$ |
— |
|
$ |
— |
|
$ |
— |
|
$ |
— |
|
$ |
— |
|
$ |
(1 |
) |
$ |
— |
|
$ |
— |
|
$ |
— |
|
State and municipal |
296 |
|
28 |
|
— |
|
24 |
|
(48 |
) |
161 |
|
(23 |
) |
(164 |
) |
— |
|
274 |
|
8 |
|
Foreign government |
40 |
|
1 |
|
— |
|
89 |
|
(228 |
) |
291 |
|
— |
|
(177 |
) |
— |
|
16 |
|
— |
|
Corporate |
324 |
|
344 |
|
— |
|
140 |
|
(185 |
) |
482 |
|
(8 |
) |
(828 |
) |
6 |
|
275 |
|
81 |
|
Equity securities |
127 |
|
54 |
|
— |
|
210 |
|
(58 |
) |
51 |
|
(3 |
) |
(261 |
) |
— |
|
120 |
|
— |
|
Asset-backed securities |
1,868 |
|
284 |
|
— |
|
44 |
|
(178 |
) |
1,457 |
|
— |
|
(1,885 |
) |
— |
|
1,590 |
|
36 |
|
Other trading assets |
2,814 |
|
117 |
|
— |
|
474 |
|
(2,691 |
) |
2,195 |
|
11 |
|
(2,285 |
) |
(20 |
) |
615 |
|
60 |
|
Total trading non-derivative assets |
$ |
6,251 |
|
$ |
952 |
|
$ |
— |
|
$ |
1,321 |
|
$ |
(3,737 |
) |
$ |
5,676 |
|
$ |
(23 |
) |
$ |
(7,155 |
) |
$ |
(11 |
) |
$ |
3,274 |
|
$ |
196 |
|
Trading derivatives, net(4)
|
|
|
|
|
|
|
|
|
|
|
|
Interest rate contracts |
$ |
(663 |
) |
$ |
(44 |
) |
$ |
— |
|
$ |
(28 |
) |
$ |
610 |
|
$ |
154 |
|
$ |
(13 |
) |
$ |
(322 |
) |
$ |
(116 |
) |
$ |
(422 |
) |
$ |
77 |
|
Foreign exchange contracts |
413 |
|
(438 |
) |
— |
|
54 |
|
(60 |
) |
33 |
|
14 |
|
(21 |
) |
135 |
|
130 |
|
(139 |
) |
Equity contracts |
(1,557 |
) |
129 |
|
— |
|
(159 |
) |
28 |
|
184 |
|
(216 |
) |
(333 |
) |
(103 |
) |
(2,027 |
) |
(214 |
) |
Commodity contracts |
(1,945 |
) |
(384 |
) |
— |
|
77 |
|
35 |
|
— |
|
23 |
|
(3 |
) |
336 |
|
(1,861 |
) |
149 |
|
Credit derivatives |
(1,001 |
) |
(484 |
) |
— |
|
(28 |
) |
18 |
|
6 |
|
16 |
|
(6 |
) |
680 |
|
(799 |
) |
(169 |
) |
Total trading derivatives, net(4)
|
$ |
(4,753 |
) |
$ |
(1,221 |
) |
$ |
— |
|
$ |
(84 |
) |
$ |
631 |
|
$ |
377 |
|
$ |
(176 |
) |
$ |
(685 |
) |
$ |
932 |
|
$ |
(4,979 |
) |
$ |
(296 |
) |
Table continues on the next page, including footnotes.
|
|
|
|
|
|
|
|
|
|
|
|
|
|
|
|
|
|
|
|
|
|
|
|
|
|
|
|
|
|
|
|
|
|
|
|
|
Net realized/unrealized
gains (losses) included in |
Transfers |
|
|
|
|
|
Unrealized
gains/
(losses)
still held(3)
|
In millions of dollars |
Dec. 31, 2016 |
Principal
transactions |
Other(1)(2)
|
into
Level 3 |
out of
Level 3 |
Purchases |
Issuances |
Sales |
Settlements |
Dec. 31, 2017 |
Investments |
|
|
|
|
|
|
|
|
|
|
|
Mortgage-backed securities |
|
|
|
|
|
|
|
|
|
|
|
U.S. government-sponsored agency guaranteed |
$ |
101 |
|
$ |
— |
|
$ |
16 |
|
$ |
1 |
|
$ |
(94 |
) |
$ |
— |
|
$ |
— |
|
$ |
— |
|
$ |
— |
|
$ |
24 |
|
$ |
(2 |
) |
Residential |
50 |
|
— |
|
2 |
|
— |
|
(47 |
) |
— |
|
— |
|
(5 |
) |
— |
|
— |
|
— |
|
Commercial |
— |
|
— |
|
— |
|
3 |
|
— |
|
12 |
|
— |
|
(12 |
) |
— |
|
3 |
|
— |
|
Total investment mortgage-backed securities |
$ |
151 |
|
$ |
— |
|
$ |
18 |
|
$ |
4 |
|
$ |
(141 |
) |
$ |
12 |
|
$ |
— |
|
$ |
(17 |
) |
$ |
— |
|
$ |
27 |
|
$ |
(2 |
) |
U.S. Treasury and federal agency securities |
$ |
2 |
|
$ |
— |
|
$ |
— |
|
$ |
— |
|
$ |
— |
|
$ |
— |
|
$ |
— |
|
$ |
(2 |
) |
$ |
— |
|
$ |
— |
|
$ |
— |
|
State and municipal |
1,211 |
|
— |
|
58 |
|
70 |
|
(517 |
) |
127 |
|
— |
|
(212 |
) |
— |
|
737 |
|
44 |
|
Foreign government |
186 |
|
— |
|
— |
|
2 |
|
(284 |
) |
523 |
|
— |
|
(335 |
) |
— |
|
92 |
|
1 |
|
Corporate |
311 |
|
— |
|
9 |
|
77 |
|
(47 |
) |
227 |
|
— |
|
(506 |
) |
— |
|
71 |
|
— |
|
Equity securities |
9 |
|
— |
|
(1 |
) |
— |
|
— |
|
— |
|
— |
|
(6 |
) |
— |
|
2 |
|
— |
|
Asset-backed securities |
660 |
|
— |
|
(89 |
) |
31 |
|
(32 |
) |
883 |
|
— |
|
(626 |
) |
— |
|
827 |
|
12 |
|
Other debt securities |
— |
|
— |
|
— |
|
— |
|
— |
|
21 |
|
— |
|
(21 |
) |
— |
|
— |
|
— |
|
Non-marketable equity securities |
1,331 |
|
— |
|
(170 |
) |
2 |
|
— |
|
19 |
|
— |
|
(233 |
) |
(268 |
) |
681 |
|
44 |
|
Total investments |
$ |
3,861 |
|
$ |
— |
|
$ |
(175 |
) |
$ |
186 |
|
$ |
(1,021 |
) |
$ |
1,812 |
|
$ |
— |
|
$ |
(1,958 |
) |
$ |
(268 |
) |
$ |
2,437 |
|
$ |
99 |
|
Loans |
$ |
568 |
|
$ |
— |
|
$ |
75 |
|
$ |
80 |
|
$ |
(16 |
) |
$ |
188 |
|
$ |
— |
|
$ |
(337 |
) |
$ |
(8 |
) |
$ |
550 |
|
$ |
211 |
|
Mortgage servicing rights |
1,564 |
|
— |
|
65 |
|
— |
|
— |
|
— |
|
96 |
|
(1,057 |
) |
(110 |
) |
558 |
|
74 |
|
Other financial assets measured on a recurring basis |
34 |
|
— |
|
(128 |
) |
10 |
|
(8 |
) |
1 |
|
318 |
|
(14 |
) |
(197 |
) |
16 |
|
(152 |
) |
Liabilities |
|
|
|
|
|
|
|
|
|
|
|
Interest-bearing deposits |
$ |
293 |
|
$ |
— |
|
$ |
25 |
|
$ |
40 |
|
$ |
— |
|
$ |
— |
|
$ |
2 |
|
$ |
— |
|
$ |
(24 |
) |
$ |
286 |
|
$ |
22 |
|
Federal funds purchased and securities loaned or sold under agreements to repurchase |
849 |
|
14 |
|
— |
|
— |
|
— |
|
— |
|
36 |
|
— |
|
(145 |
) |
726 |
|
10 |
|
Trading account liabilities |
|
|
|
|
|
|
|
|
|
|
|
Securities sold, not yet purchased |
1,177 |
|
385 |
|
— |
|
22 |
|
(796 |
) |
— |
|
17 |
|
277 |
|
(290 |
) |
22 |
|
8 |
|
Other trading liabilities |
1 |
|
— |
|
— |
|
4 |
|
— |
|
— |
|
— |
|
— |
|
— |
|
5 |
|
— |
|
Short-term borrowings |
42 |
|
32 |
|
— |
|
4 |
|
(7 |
) |
— |
|
31 |
|
— |
|
(20 |
) |
18 |
|
(3 |
) |
Long-term debt |
9,744 |
|
(1,083 |
) |
— |
|
1,251 |
|
(1,836 |
) |
44 |
|
2,712 |
|
— |
|
84 |
|
13,082 |
|
(1,554 |
) |
Other financial liabilities measured on a recurring basis |
8 |
|
— |
|
— |
|
5 |
|
— |
|
— |
|
5 |
|
(1 |
) |
(9 |
) |
8 |
|
(1 |
) |
|
|
(1)
|
Changes in fair value for available-for-sale investments are recorded in AOCI, unless related to other-than-temporary impairment, while gains and losses from sales are recorded in Realized gains (losses) from sales of investments on the Consolidated Statement of Income.
|
|
|
(2) |
Unrealized gains (losses) on MSRs are recorded in Other revenue on the Consolidated Statement of Income.
|
|
|
(3) |
Represents the amount of total gains or losses for the period, included in earnings (and AOCI for changes in fair value of available-for-sale investments), attributable to the change in fair value relating to assets and liabilities classified as Level 3 that are still held at December 31, 2017.
|
|
|
(4) |
Total Level 3 trading derivative assets and liabilities have been netted in these tables for presentation purposes only. |
|
|
|
|
|
|
|
|
|
|
|
|
|
|
|
|
|
|
|
|
|
|
|
|
|
|
|
|
|
|
|
|
|
|
|
|
|
Net realized/unrealized
gains (losses) included in |
Transfers |
|
|
|
|
|
Unrealized
gains/
(losses)
still held(3)
|
In millions of dollars |
Dec. 31, 2015 |
Principal
transactions |
Other(1)(2)
|
into
Level 3 |
out of
Level 3 |
Purchases |
Issuances |
Sales |
Settlements |
Dec. 31, 2016 |
Assets |
|
|
|
|
|
|
|
|
|
|
|
Federal funds sold and securities borrowed or purchased under agreements to resell |
$ |
1,337 |
|
$ |
(20 |
) |
$ |
— |
|
$ |
— |
|
$ |
(28 |
) |
$ |
758 |
|
$ |
— |
|
$ |
— |
|
$ |
(551 |
) |
$ |
1,496 |
|
$ |
(16 |
) |
Trading non-derivative assets |
|
|
|
|
|
|
|
|
|
|
|
Trading mortgage-backed securities |
|
|
|
|
|
|
|
|
|
|
|
U.S. government-sponsored agency guaranteed |
744 |
|
6 |
|
— |
|
510 |
|
(1,087 |
) |
941 |
|
— |
|
(961 |
) |
23 |
|
176 |
|
(7 |
) |
Residential |
1,326 |
|
104 |
|
— |
|
189 |
|
(162 |
) |
324 |
|
— |
|
(1,376 |
) |
(6 |
) |
399 |
|
26 |
|
Commercial |
517 |
|
(1 |
) |
— |
|
193 |
|
(234 |
) |
759 |
|
— |
|
(1,028 |
) |
— |
|
206 |
|
(27 |
) |
Total trading mortgage-backed securities |
$ |
2,587 |
|
$ |
109 |
|
$ |
— |
|
$ |
892 |
|
$ |
(1,483 |
) |
$ |
2,024 |
|
$ |
— |
|
$ |
(3,365 |
) |
$ |
17 |
|
$ |
781 |
|
$ |
(8 |
) |
U.S. Treasury and federal agency securities |
$ |
1 |
|
$ |
— |
|
$ |
— |
|
$ |
2 |
|
$ |
— |
|
$ |
— |
|
$ |
— |
|
$ |
(2 |
) |
$ |
— |
|
$ |
1 |
|
$ |
— |
|
State and municipal |
351 |
|
23 |
|
— |
|
195 |
|
(256 |
) |
322 |
|
— |
|
(339 |
) |
— |
|
296 |
|
(88 |
) |
Foreign government |
197 |
|
(9 |
) |
— |
|
21 |
|
(49 |
) |
115 |
|
— |
|
(235 |
) |
— |
|
40 |
|
(16 |
) |
Corporate |
376 |
|
330 |
|
— |
|
171 |
|
(132 |
) |
867 |
|
— |
|
(1,295 |
) |
7 |
|
324 |
|
69 |
|
Equity securities |
3,684 |
|
(527 |
) |
— |
|
279 |
|
(4,057 |
) |
955 |
|
(11 |
) |
(196 |
) |
— |
|
127 |
|
(457 |
) |
Asset-backed securities |
2,739 |
|
53 |
|
— |
|
205 |
|
(360 |
) |
2,199 |
|
— |
|
(2,965 |
) |
(3 |
) |
1,868 |
|
(46 |
) |
Other trading assets |
2,483 |
|
(58 |
) |
— |
|
2,070 |
|
(2,708 |
) |
2,894 |
|
19 |
|
(1,838 |
) |
(48 |
) |
2,814 |
|
(101 |
) |
Total trading non-derivative assets |
$ |
12,418 |
|
$ |
(79 |
) |
$ |
— |
|
$ |
3,835 |
|
$ |
(9,045 |
) |
$ |
9,376 |
|
$ |
8 |
|
$ |
(10,235 |
) |
$ |
(27 |
) |
$ |
6,251 |
|
$ |
(647 |
) |
Trading derivatives, net(4)
|
|
|
|
|
|
|
|
|
|
|
|
Interest rate contracts |
$ |
(495 |
) |
$ |
(146 |
) |
$ |
— |
|
$ |
301 |
|
$ |
(239 |
) |
$ |
163 |
|
$ |
(18 |
) |
$ |
(142 |
) |
$ |
(87 |
) |
$ |
(663 |
) |
$ |
26 |
|
Foreign exchange contracts |
620 |
|
(276 |
) |
— |
|
75 |
|
(106 |
) |
200 |
|
— |
|
(181 |
) |
81 |
|
413 |
|
23 |
|
Equity contracts |
(800 |
) |
(89 |
) |
— |
|
63 |
|
(772 |
) |
92 |
|
38 |
|
(128 |
) |
39 |
|
(1,557 |
) |
(33 |
) |
Commodity contracts |
(1,861 |
) |
(352 |
) |
— |
|
(425 |
) |
(39 |
) |
357 |
|
— |
|
(347 |
) |
722 |
|
(1,945 |
) |
(164 |
) |
Credit derivatives |
307 |
|
(1,970 |
) |
— |
|
8 |
|
(29 |
) |
37 |
|
— |
|
(34 |
) |
680 |
|
(1,001 |
) |
(1,854 |
) |
Total trading derivatives, net(4)
|
$ |
(2,229 |
) |
$ |
(2,833 |
) |
$ |
— |
|
$ |
22 |
|
$ |
(1,185 |
) |
$ |
849 |
|
$ |
20 |
|
$ |
(832 |
) |
$ |
1,435 |
|
$ |
(4,753 |
) |
$ |
(2,002 |
) |
Investments |
|
|
|
|
|
|
|
|
|
|
|
Mortgage-backed securities |
|
|
|
|
|
|
|
|
|
|
|
U.S. government-sponsored agency guaranteed |
$ |
139 |
|
$ |
— |
|
$ |
(26 |
) |
$ |
25 |
|
$ |
(72 |
) |
$ |
45 |
|
$ |
— |
|
$ |
(9 |
) |
$ |
(1 |
) |
$ |
101 |
|
$ |
54 |
|
Residential |
4 |
|
— |
|
3 |
|
49 |
|
— |
|
26 |
|
— |
|
(32 |
) |
— |
|
50 |
|
2 |
|
Commercial |
2 |
|
— |
|
(1 |
) |
6 |
|
(7 |
) |
— |
|
— |
|
— |
|
— |
|
— |
|
— |
|
Total investment mortgage-backed securities |
$ |
145 |
|
$ |
— |
|
$ |
(24 |
) |
$ |
80 |
|
$ |
(79 |
) |
$ |
71 |
|
$ |
— |
|
$ |
(41 |
) |
$ |
(1 |
) |
$ |
151 |
|
$ |
56 |
|
U.S. Treasury and federal agency securities |
$ |
4 |
|
$ |
— |
|
$ |
— |
|
$ |
— |
|
$ |
— |
|
$ |
— |
|
$ |
— |
|
$ |
(2 |
) |
$ |
— |
|
$ |
2 |
|
$ |
— |
|
State and municipal |
2,192 |
|
— |
|
39 |
|
467 |
|
(1,598 |
) |
351 |
|
— |
|
(240 |
) |
— |
|
1,211 |
|
23 |
|
Foreign government |
260 |
|
— |
|
10 |
|
38 |
|
(39 |
) |
259 |
|
— |
|
(339 |
) |
(3 |
) |
186 |
|
(104 |
) |
Corporate |
603 |
|
— |
|
77 |
|
11 |
|
(240 |
) |
693 |
|
— |
|
(468 |
) |
(365 |
) |
311 |
|
— |
|
Equity securities |
124 |
|
— |
|
10 |
|
5 |
|
(5 |
) |
1 |
|
— |
|
(131 |
) |
5 |
|
9 |
|
— |
|
Asset-backed securities |
596 |
|
— |
|
(92 |
) |
7 |
|
(61 |
) |
435 |
|
— |
|
(306 |
) |
81 |
|
660 |
|
(102 |
) |
Other debt securities |
— |
|
— |
|
— |
|
10 |
|
— |
|
6 |
|
— |
|
(16 |
) |
— |
|
— |
|
— |
|
Non-marketable equity securities |
1,135 |
|
— |
|
79 |
|
336 |
|
(32 |
) |
26 |
|
— |
|
(14 |
) |
(199 |
) |
1,331 |
|
18 |
|
Total investments |
$ |
5,059 |
|
$ |
— |
|
$ |
99 |
|
$ |
954 |
|
$ |
(2,054 |
) |
$ |
1,842 |
|
$ |
— |
|
$ |
(1,557 |
) |
$ |
(482 |
) |
$ |
3,861 |
|
$ |
(109 |
) |
Table continues on the next page, including footnotes.
|
|
|
|
|
|
|
|
|
|
|
|
|
|
|
|
|
|
|
|
|
|
|
|
|
|
|
|
|
|
|
|
|
|
|
|
|
Net realized/unrealized
gains (losses) included in |
Transfers |
|
|
|
|
|
Unrealized
gains
(losses)
still held(3)
|
In millions of dollars |
Dec. 31, 2015 |
Principal
transactions |
Other(1)(2)
|
into
Level 3 |
out of
Level 3 |
Purchases |
Issuances |
Sales |
Settlements |
Dec. 31, 2016 |
Loans |
$ |
2,166 |
|
$ |
— |
|
$ |
(61 |
) |
$ |
89 |
|
$ |
(1,074 |
) |
$ |
708 |
|
$ |
219 |
|
$ |
(813 |
) |
$ |
(666 |
) |
$ |
568 |
|
$ |
26 |
|
Mortgage servicing rights |
1,781 |
|
— |
|
(36 |
) |
— |
|
— |
|
— |
|
152 |
|
(20 |
) |
(313 |
) |
1,564 |
|
(21 |
) |
Other financial assets measured on a recurring basis |
180 |
|
— |
|
80 |
|
55 |
|
(47 |
) |
1 |
|
236 |
|
(133 |
) |
(338 |
) |
34 |
|
39 |
|
Liabilities |
|
|
|
|
|
|
|
|
|
|
|
Interest-bearing deposits |
$ |
434 |
|
$ |
— |
|
$ |
43 |
|
$ |
322 |
|
$ |
(309 |
) |
$ |
— |
|
$ |
5 |
|
$ |
— |
|
$ |
(116 |
) |
$ |
293 |
|
$ |
46 |
|
Federal funds purchased and securities loaned or sold under agreements to repurchase |
1,247 |
|
(6 |
) |
— |
|
— |
|
(150 |
) |
— |
|
— |
|
27 |
|
(281 |
) |
849 |
|
(12 |
) |
Trading account liabilities |
|
|
|
|
|
|
|
|
|
|
|
Securities sold, not yet purchased |
199 |
|
17 |
|
— |
|
1,185 |
|
(109 |
) |
(70 |
) |
(41 |
) |
367 |
|
(337 |
) |
1,177 |
|
(43 |
) |
Other trading liabilities |
— |
|
— |
|
— |
|
1 |
|
— |
|
— |
|
— |
|
— |
|
— |
|
1 |
|
— |
|
Short-term borrowings |
9 |
|
(16 |
) |
— |
|
19 |
|
(37 |
) |
— |
|
87 |
|
— |
|
(52 |
) |
42 |
|
— |
|
Long-term debt |
7,543 |
|
(282 |
) |
— |
|
3,792 |
|
(4,350 |
) |
— |
|
4,845 |
|
(3 |
) |
(2,365 |
) |
9,744 |
|
(419 |
) |
Other financial liabilities measured on a recurring basis |
14 |
|
— |
|
(11 |
) |
2 |
|
(12 |
) |
(8 |
) |
12 |
|
— |
|
(11 |
) |
8 |
|
(13 |
) |
|
|
(1)
|
Changes in fair value of available-for-sale investments are recorded in AOCI, unless related to other-than-temporary impairment, while gains and losses from sales are recorded in Realized gains (losses) from sales of investments on the Consolidated Statement of Income.
|
|
|
(2) |
Unrealized gains (losses) on MSRs are recorded in Other revenue on the Consolidated Statement of Income.
|
|
|
(3) |
Represents the amount of total gains or losses for the period, included in earnings (and AOCI for changes in fair value of available-for-sale investments), attributable to the change in fair value relating to assets and liabilities classified as Level 3 that are still held at December 31, 2016.
|
|
|
(4) |
Total Level 3 derivative assets and liabilities have been netted in these tables for presentation purposes only. |
Level 3 Fair Value Rollforward
The following were the significant Level 3 transfers for the period December 31, 2016 to December 31, 2017:
|
|
• |
Transfers of Federal funds sold and securities borrowed or purchased under agreements to resell of $1.2 billion from Level 3 to Level 2 related to the significance of unobservable inputs as well as certain underlying market inputs becoming more observable and shortening of the remaining tenor of certain reverse repos. There is more transparency and observability for repo curves used in the valuation of structured reverse repos with tenors up to five years.
|
|
|
• |
Transfers of Other trading assets of $2.7 billion from Level 3 to Level 2, related to trading loans, reflecting changes in the volume of market quotations, changes in the significance of unobservable inputs for certain portfolios of trading loans economically hedging derivatives, and certain underlying market inputs becoming more observable as a result of secondary market transactions for portfolios of residential mortgage loans with similar characteristics.
|
|
|
• |
Transfers of Long-term debt of $1.3 billion from Level 2 to Level 3, and of $1.8 billion from Level 3 to Level 2, mainly related to structured debt, reflecting changes in the significance of unobservable inputs as well as certain underlying market inputs becoming less or more observable.
|
The following were the significant Level 3 transfers for the period December 31, 2015 to December 31, 2016:
|
|
• |
Transfers of U.S. government-sponsored agency guaranteed MBS in Trading account assets of $0.5 billion from Level 2 to Level 3, and of $1.1 billion from Level 3 to Level 2, primarily related to Agency Guaranteed MBS securities for which there were changes in volume of market quotations.
|
|
|
• |
Transfer of Equity securities of $4.0 billion from Level 3 to Level 2, included $3.2 billion of non-marketable equity securities and $0.5 billion of related partial economic hedging derivatives for which the portfolio valuation measurement exception under ASC 820-35-18D has been applied. After application of the portfolio exception, the Company considers these items to be one valuation unit and measures the fair value of the net open risk position primarily based on recent market transactions where these instruments are traded concurrently. Because the derivatives offset the significant unobservable exposure
|
within the non-marketable equity securities, there were no remaining unobservable inputs deemed to be significant.
|
|
• |
Transfers of Other trading assets of $2.1 billion from Level 2 to Level 3, and of $2.7 billion from Level 3 to Level 2, primarily related to trading loans for which there were changes in volume of market quotations.
|
|
|
• |
Transfers of State and Municipal securities in AFS Investments of $0.5 billion from Level 2 to Level 3, and of $1.6 billion from Level 3 to Level 2, primarily reflecting changes in the volume of market quotations.
|
|
|
• |
Transfers of Loans of $1.1 billion from Level 3 to Level 2 reflecting changes in the volume of market quotations.
|
|
|
• |
Transfers of Securities Sold Not Yet Purchased of $1.2 billion from Level 2 to Level 3 related to the significance
|
of unobservable inputs as well as certain underlying market inputs becoming less observable.
|
|
• |
Transfers of Long-term debt of $3.8 billion from Level 2 to Level 3, and of $4.4 billion from Level 3 to Level 2, mainly related to structured debt, reflecting changes in the significance of unobservable inputs as well as certain underlying market inputs becoming less or more observable.
|
Valuation Techniques and Inputs for Level 3 Fair Value Measurements
The Company’s Level 3 inventory consists of both cash
instruments and derivatives of varying complexity. The
valuation methodologies used to measure the fair value of
these positions include discounted cash flow analysis, internal
models and comparative analysis. A position is classified
within Level 3 of the fair value hierarchy when at least one
input is unobservable and is considered significant to its
valuation. The specific reason an input is deemed
unobservable varies; for example, at least one significant
input to the pricing model is not observable in the market, at
least one significant input has been adjusted to make it more
representative of the position being valued or the price quote
available does not reflect sufficient trading activities.
The following tables present the valuation techniques covering the majority of Level 3 inventory and the most significant unobservable inputs used in Level 3 fair value measurements. Differences between this table and amounts presented in the Level 3 Fair Value Rollforward table represent individually immaterial items that have been measured using a variety of valuation techniques other than those listed.
Valuation Techniques and Inputs for Level 3 Fair Value Measurements
|
|
|
|
|
|
|
|
|
|
|
|
|
|
|
|
As of December 31, 2017 |
Fair value(1)
(in millions)
|
Methodology |
Input |
Low(2)(3)
|
High(2)(3)
|
Weighted
average(4)
|
Assets |
|
|
|
|
|
|
Federal funds sold and securities borrowed or purchased under agreements to resell |
$ |
16 |
|
Model-based |
Interest rate |
1.43 |
% |
2.16 |
% |
2.09 |
% |
|
|
|
|
|
|
|
|
|
|
Mortgage-backed securities |
$ |
214 |
|
Price-based |
Price |
$ |
2.96 |
|
$ |
101.00 |
|
$ |
56.52 |
|
|
184 |
|
Yield analysis |
Yield |
2.52 |
% |
14.06 |
% |
5.97 |
|
State and municipal, foreign government, corporate and other debt securities |
$ |
949 |
|
Model-based |
Price |
$ |
— |
|
$ |
184.04 |
|
$ |
91.74 |
|
|
914 |
|
Price-based |
Credit spread |
35 bps |
|
500 bps |
|
249 bps |
|
|
|
|
Yield |
2.36 |
% |
14.25 |
% |
6.03 |
% |
Equity securities(5)
|
$ |
65 |
|
Price-based |
Price |
$ |
— |
|
$ |
25,450.00 |
|
$ |
2,526.62 |
|
|
55 |
|
Model-based |
WAL |
2.50 years |
|
2.50 years |
|
2.50 years |
|
Asset-backed securities |
$ |
2,287 |
|
Price-based |
Price |
$ |
4.25 |
|
$ |
100.60 |
|
$ |
74.57 |
|
Non-marketable equity |
$ |
423 |
|
Comparables analysis |
EBITDA multiples |
6.90 |
x |
12.80 |
x |
8.66 |
x |
|
223 |
|
Price-based |
Discount to price |
— |
% |
100.00 |
% |
11.83 |
% |
|
|
|
Price-to-book ratio |
0.05 |
x |
1.00 |
x |
0.32 |
x |
Derivatives—gross(6)
|
|
|
|
|
|
|
Interest rate contracts (gross) |
$ |
3,818 |
|
Model-based |
IR normal volatility |
9.40 |
% |
77.40 |
% |
58.86 |
% |
|
|
|
Mean reversion |
1.00 |
% |
20.00 |
% |
10.50 |
% |
Foreign exchange contracts (gross) |
$ |
940 |
|
Model-based |
Foreign exchange (FX) volatility |
4.58 |
% |
15.02 |
% |
8.16 |
% |
|
|
|
|
Interest rate |
(0.55 |
)% |
0.28 |
% |
0.04 |
% |
|
|
|
IR-IR correlation |
(51.00 |
)% |
40.00 |
% |
36.56 |
% |
|
|
|
IR-FX correlation |
(7.34 |
)% |
60.00 |
% |
49.04 |
% |
|
|
|
Credit spread |
11 bps |
|
717 bps |
|
173 bps |
|
Equity contracts (gross)(7)
|
$ |
2,897 |
|
Model-based |
Equity volatility |
3.00 |
% |
68.93 |
% |
24.66 |
% |
|
|
|
Forward price |
69.74 |
% |
154.19 |
% |
92.80 |
% |
Commodity contracts (gross) |
$ |
2,937 |
|
Model-based |
Forward price |
3.66 |
% |
290.59 |
% |
114.16 |
% |
|
|
|
Commodity volatility |
8.60 |
% |
66.73 |
% |
25.04 |
% |
|
|
|
Commodity correlation |
(37.64 |
)% |
91.71 |
% |
15.21 |
% |
Credit derivatives (gross) |
$ |
1,797 |
|
Model-based |
Credit correlation |
25.00 |
% |
90.00 |
% |
44.64 |
% |
|
823 |
|
Price-based |
Upfront points |
6.03 |
% |
97.26 |
% |
62.88 |
% |
|
|
|
Credit spread |
3 bps |
|
1,636 bps |
|
173 bps |
|
|
|
|
Price |
$ |
1.00 |
|
$ |
100.24 |
|
$ |
57.63 |
|
|
|
|
|
|
|
|
|
|
|
|
|
|
|
|
|
As of December 31, 2017 |
Fair value(1)
(in millions)
|
Methodology |
Input |
Low(2)(3)
|
High(2)(3)
|
Weighted
average(4)
|
Nontrading derivatives and other financial assets and liabilities measured on a recurring basis (gross)(6)
|
$ |
24 |
|
Model-based |
Recovery rate |
25.00 |
% |
40.00 |
% |
31.56 |
% |
|
|
|
Redemption rate |
10.72 |
% |
99.50 |
% |
74.24 |
% |
|
|
|
Credit spread |
38 bps |
|
275 bps |
|
127 bps |
|
|
|
|
Upfront points |
61.00 |
% |
61.00 |
% |
61.00 |
% |
Loans and leases |
$ |
391 |
|
Model-based |
Equity volatility |
3.00 |
% |
68.93 |
% |
22.52 |
% |
|
148 |
|
Price-based |
Credit spread |
134 bps |
|
500 bps |
|
173 bps |
|
|
|
|
Yield |
3.09 |
% |
4.40 |
% |
3.13 |
% |
Mortgage servicing rights |
$ |
471 |
|
Cash flow |
Yield |
8.00 |
% |
16.38 |
% |
11.47 |
% |
|
87 |
|
Model-based |
WAL |
3.83 years |
|
6.89 years |
|
5.93 years |
|
Liabilities |
|
|
|
|
|
|
Interest-bearing deposits |
$ |
286 |
|
Model-based |
Mean reversion |
1.00 |
% |
20.00 |
% |
10.50 |
% |
|
|
|
Forward price |
99.56 |
% |
99.95 |
% |
99.72 |
% |
Federal funds purchased and securities loaned or sold under agreements to repurchase |
$ |
726 |
|
Model-based |
Interest rate |
1.43 |
% |
2.16 |
% |
2.09 |
% |
Trading account liabilities |
|
|
|
|
|
|
Securities sold, not yet purchased |
$ |
21 |
|
Price-based |
Price |
$ |
1.00 |
|
$ |
287.64 |
|
$ |
88.19 |
|
Short-term borrowings and long-term debt |
$ |
13,100 |
|
Model-based |
Forward price |
69.74 |
% |
161.11 |
% |
100.70 |
% |
|
|
|
|
|
|
|
|
|
|
|
|
|
|
|
|
As of December 31, 2016 |
Fair value(1)
(in millions)
|
Methodology |
Input |
Low(2)(3)
|
High(2)(3)
|
Weighted
average(4)
|
Assets |
|
|
|
|
|
|
Federal funds sold and securities borrowed or purchased under agreements to resell |
$ |
1,496 |
|
Model-based |
IR log-normal volatility |
12.86 |
% |
75.50 |
% |
61.73 |
% |
|
|
|
Interest rate |
(0.51 |
)% |
5.76 |
% |
2.80 |
% |
Mortgage-backed securities |
$ |
509 |
|
Price-based |
Price |
$ |
5.50 |
|
$ |
113.48 |
|
$ |
61.74 |
|
|
368 |
|
Yield analysis |
Yield |
1.90 |
% |
14.54 |
% |
4.34 |
% |
State and municipal, foreign government, corporate and other debt securities |
$ |
3,308 |
|
Price-based |
Price |
$ |
15.00 |
|
$ |
103.60 |
|
$ |
89.93 |
|
|
1,513 |
|
Cash flow |
Credit spread |
35 bps |
|
600 bps |
|
230 bps |
|
Equity securities(5)
|
$ |
69 |
|
Model-based |
Price |
$ |
0.48 |
|
$ |
104.00 |
|
$ |
22.19 |
|
|
58 |
|
Price-based |
|
|
|
|
|
|
|
Asset-backed securities |
$ |
2,454 |
|
Price-based |
Price |
$ |
4.00 |
|
$ |
100.00 |
|
$ |
71.51 |
|
Non-marketable equity |
$ |
726 |
|
Price-based |
Discount to price |
— |
% |
90.00 |
% |
13.36 |
% |
|
565 |
|
Comparables analysis |
EBITDA multiples |
6.80 |
x |
10.10 |
x |
8.62 |
x |
|
|
|
Price-to-book ratio |
0.32 |
x |
1.03 |
x |
0.87 |
x |
|
|
|
Price |
$ |
— |
|
$ |
113.23 |
|
$ |
54.40 |
|
Derivatives—gross(6)
|
|
|
|
|
|
|
Interest rate contracts (gross) |
$ |
4,897 |
|
Model-based |
IR log-normal volatility |
1.00 |
% |
93.97 |
% |
62.72 |
% |
|
|
|
Mean reversion |
1.00 |
% |
20.00 |
% |
10.50 |
% |
|
|
|
|
|
|
|
|
|
|
|
|
|
|
|
|
As of December 31, 2016 |
Fair value(1)
(in millions)
|
Methodology |
Input |
Low(2)(3)
|
High(2)(3)
|
Weighted
average(4)
|
Foreign exchange contracts (gross) |
$ |
1,110 |
|
Model-based |
Foreign exchange (FX) volatility |
1.39 |
% |
26.85 |
% |
15.18 |
% |
|
134 |
|
Cash flow |
Interest rate |
(0.85 |
)% |
(0.49 |
)% |
(0.84 |
)% |
|
|
|
Credit spread |
4 bps |
|
657 bps |
|
266 bps |
|
|
|
|
IR-IR correlation |
40.00 |
% |
50.00 |
% |
41.27 |
% |
|
|
|
IR-FX correlation |
16.41 |
% |
60.00 |
% |
49.52 |
% |
Equity contracts (gross)(7)
|
$ |
2,701 |
|
Model-based |
Equity volatility |
3.00 |
% |
97.78 |
% |
29.52 |
% |
|
|
|
|
Forward price |
69.05 |
% |
144.61 |
% |
94.28 |
% |
|
|
|
Equity-FX correlation |
(60.70 |
)% |
28.20 |
% |
(26.28 |
)% |
|
|
|
Equity-IR correlation |
(35.00 |
)% |
41.00 |
% |
(15.65 |
)% |
|
|
|
Yield volatility |
3.55 |
% |
14.77 |
% |
9.29 |
% |
|
|
|
|
Equity-equity correlation |
(87.70 |
)% |
96.50 |
% |
67.45 |
% |
Commodity contracts (gross) |
$ |
2,955 |
|
Model-based |
Forward price |
35.74 |
% |
235.35 |
% |
119.99 |
% |
|
|
|
Commodity volatility |
2.00 |
% |
32.19 |
% |
17.07 |
% |
|
|
|
|
Commodity correlation |
(41.61 |
)% |
90.42 |
% |
52.85 |
% |
Credit derivatives (gross) |
$ |
2,786 |
|
Model-based |
Recovery rate |
20.00 |
% |
75.00 |
% |
39.75 |
% |
|
1,403 |
|
Price-based |
Credit correlation |
5.00 |
% |
90.00 |
% |
34.27 |
% |
|
|
|
Upfront points |
6.00 |
% |
99.90 |
% |
72.89 |
% |
|
|
|
Price |
$ |
1.00 |
|
$ |
167.00 |
|
$ |
77.35 |
|
|
|
|
Credit spread |
3 bps |
|
1,515 bps |
|
256 bps |
|
Nontrading derivatives and other financial assets and liabilities measured on a recurring basis (gross)(6)
|
$ |
42 |
|
Model-based |
Recovery rate |
40.00 |
% |
40.00 |
% |
40.00 |
% |
|
|
|
Redemption rate |
3.92 |
% |
99.58 |
% |
74.69 |
% |
|
|
|
Upfront points |
16.00 |
% |
20.50 |
% |
18.78 |
% |
|
|
|
|
|
|
|
Loans |
$ |
258 |
|
Price-based |
Price |
$ |
31.55 |
|
$ |
105.74 |
|
$ |
56.46 |
|
|
221 |
|
Yield analysis |
Yield |
2.75 |
% |
20.00 |
% |
11.09 |
% |
|
79 |
|
Model-based |
|
|
|
|
|
|
|
Mortgage servicing rights |
$ |
1,473 |
|
Cash flow |
Yield |
4.20 |
% |
20.56 |
% |
9.32 |
% |
|
|
|
|
WAL |
3.53 years |
|
7.24 years |
|
5.83 years |
|
Liabilities |
|
|
|
|
|
|
|
|
|
Interest-bearing deposits |
$ |
293 |
|
Model-based |
Mean reversion |
1.00 |
% |
20.00 |
% |
10.50 |
% |
|
|
|
|
Forward price |
98.79 |
% |
104.07 |
% |
100.19 |
% |
Federal funds purchased and securities loaned or sold under agreements to repurchase |
$ |
849 |
|
Model-based |
Interest rate |
0.62 |
% |
2.19 |
% |
1.99 |
% |
Trading account liabilities |
|
|
|
|
|
|
|
|
|
Securities sold, not yet purchased |
$ |
1,056 |
|
Model-based |
IR Normal volatility |
12.86 |
% |
75.50 |
% |
61.73 |
% |
Short-term borrowings and long-term debt |
$ |
9,774 |
|
Model-based |
Mean reversion |
1.00 |
% |
20.00 |
% |
10.50 |
% |
|
|
|
Commodity correlation |
(41.61 |
)% |
90.42 |
% |
52.85 |
% |
|
|
|
Commodity volatility |
2.00 |
% |
32.19 |
% |
17.07 |
% |
|
|
|
Forward price |
69.05 |
% |
235.35 |
% |
103.28 |
% |
|
|
(1) |
The fair value amounts presented in these tables represent the primary valuation technique or techniques for each class of assets or liabilities. |
|
|
(2) |
Some inputs are shown as zero due to rounding. |
|
|
(3) |
When the low and high inputs are the same, there is either a constant input applied to all positions, or the methodology involving the input applies to only one large position. |
|
|
(4) |
Weighted averages are calculated based on the fair values of the instruments. |
|
|
(5) |
For equity securities, the price and fund NAV inputs are expressed on an absolute basis, not as a percentage of the notional amount. |
|
|
(6) |
Both trading and nontrading account derivatives—assets and liabilities—are presented on a gross absolute value basis. |
|
|
(7) |
Includes hybrid products. |
Sensitivity to Unobservable Inputs and Interrelationships between Unobservable Inputs
The impact of key unobservable inputs on the Level 3 fair value measurements may not be independent of one another. In addition, the amount and direction of the impact on a fair value measurement for a given change in an unobservable input depends on the nature of the instrument as well as whether the Company holds the instrument as an asset or a liability. For certain instruments, the pricing, hedging and risk management are sensitive to the correlation between various inputs rather than on the analysis and aggregation of the individual inputs.
The following section describes the sensitivities and interrelationships of the most significant unobservable inputs used by the Company in Level 3 fair value measurements.
Correlation
Correlation is a measure of the extent to which two or more variables change in relation to each other. A variety of correlation-related assumptions are required for a wide range of instruments, including equity and credit baskets, foreign-exchange options, CDOs backed by loans or bonds, mortgages, subprime mortgages and many other instruments. For almost all of these instruments, correlations are not observable in the market and must be calculated using historical information. Estimating correlation can be especially difficult where it may vary over time. Calculating correlation information from market data requires significant assumptions regarding the informational efficiency of the market (for example, swaption markets). Changes in correlation levels can have a major impact, favorable or unfavorable, on the value of an instrument, depending on its nature. A change in the default correlation of the fair value of the underlying bonds comprising a CDO structure would affect the fair value of the senior tranche. For example, an increase in the default correlation of the underlying bonds would reduce the fair value of the senior tranche, because highly correlated instruments produce larger losses in the event of default and a part of these losses would become attributable to the senior tranche. That same change in default correlation would have a different impact on junior tranches of the same structure.
Volatility
Volatility represents the speed and severity of market price changes and is a key factor in pricing options. Typically, instruments can become more expensive if volatility increases. For example, as an index becomes more volatile, the cost to Citi of maintaining a given level of exposure increases because more frequent rebalancing of the portfolio is required. Volatility generally depends on the tenor of the underlying instrument and the strike price or level defined in the contract. Volatilities for certain combinations of tenor and strike are not observable. The general relationship between changes in the value of a portfolio to changes in volatility also depends on changes in interest rates and the level of the underlying index. Generally, long option positions (assets) benefit from increases in volatility, whereas short option positions (liabilities) will suffer losses. Some instruments are more sensitive to changes in volatility than others. For example, an
at-the-money option would experience a larger percentage change in its fair value than a deep-in-the-money option. In addition, the fair value of an option with more than one underlying security (for example, an option on a basket of bonds) depends on the volatility of the individual underlying securities as well as their correlations.
Yield
In some circumstances, the yield of an instrument is not observable in the market and must be estimated from historical data or from yields of similar securities. This estimated yield may need to be adjusted to capture the characteristics of the security being valued. In other situations, the estimated yield may not represent sufficient market liquidity and must be adjusted as well. Whenever the amount of the adjustment is significant to the value of the security, the fair value measurement is classified as Level 3.
Adjusted yield is generally used to discount the projected future principal and interest cash flows on instruments, such as asset-backed securities. Adjusted yield is impacted by changes in the interest rate environment and relevant credit spreads.
Prepayment
Voluntary unscheduled payments (prepayments) change the future cash flows for the investor and thereby change the fair value of the security. The effect of prepayments is more pronounced for residential mortgage-backed securities. An increase in prepayments—in speed or magnitude—generally creates losses for the holder of these securities. Prepayment is generally negatively correlated with delinquency and interest rate. A combination of low prepayment and high delinquencies amplifies each input’s negative impact on mortgage securities’ valuation. As prepayment speeds change, the weighted average life of the security changes, which impacts the valuation either positively or negatively, depending upon the nature of the security and the direction of the change in the weighted average life.
Recovery
Recovery is the proportion of the total outstanding balance of a bond or loan that is expected to be collected in a liquidation scenario. For many credit securities (such as asset-backed securities), there is no directly observable market input for recovery, but indications of recovery levels are available from pricing services. The assumed recovery of a security may differ from its actual recovery that will be observable in the future. The recovery rate impacts the valuation of credit securities. Generally, an increase in the recovery rate assumption increases the fair value of the security. An increase in loss severity, the inverse of the recovery rate, reduces the amount of principal available for distribution and, as a result, decreases the fair value of the security.
Credit Spread
Credit spread is a component of the security representing its credit quality. Credit spread reflects the market perception of changes in prepayment, delinquency and recovery rates,
therefore capturing the impact of other variables on the fair value. Changes in credit spread affect the fair value of
securities differently depending on the characteristics and maturity profile of the security. For example, credit spread is a more significant driver of the fair value measurement of a high yield bond as compared to an investment grade bond. Generally, the credit spread for an investment grade bond is also more observable and less volatile than its high yield counterpart.
Qualitative Discussion of the Ranges of Significant Unobservable Inputs
The following section describes the ranges of the most significant unobservable inputs used by the Company in Level 3 fair value measurements. The level of aggregation and the diversity of instruments held by the Company lead to a wide range of unobservable inputs that may not be evenly distributed across the Level 3 inventory.
Correlation
There are many different types of correlation inputs, including credit correlation, cross-asset correlation (such as equity-interest rate correlation) and same-asset correlation (such as interest rate-interest rate correlation). Correlation inputs are generally used to value hybrid and exotic instruments. Generally, same-asset correlation inputs have a narrower range than cross-asset correlation inputs. However, due to the complex and unique nature of these instruments, the ranges for correlation inputs can vary widely across portfolios.
Volatility
Similar to correlation, asset-specific volatility inputs vary widely by asset type. For example, ranges for foreign exchange volatility are generally lower and narrower than equity volatility. Equity volatilities are wider due to the nature of the equities market and the terms of certain exotic instruments. For most instruments, the interest rate volatility input is on the lower end of the range; however, for certain structured or exotic instruments (such as market-linked deposits or exotic interest rate derivatives), the range is much wider.
Yield
Ranges for the yield inputs vary significantly depending upon the type of security. For example, securities that typically have lower yields, such as municipal bonds, will fall in the lower end of the range, while more illiquid securities or securities with lower credit quality, such as certain residual tranche asset-backed securities, will have much higher yield inputs.
Credit Spread
Credit spread is relevant primarily for fixed income and credit instruments; however, the ranges for the credit spread input can vary across instruments. For example, certain fixed income instruments, such as certificates of deposit, typically have lower credit spreads, whereas certain derivative instruments with high-risk counterparties are typically subject to higher credit spreads when they are uncollateralized or have a longer tenor. Other instruments, such as credit default swaps,
also have credit spreads that vary with the attributes of the underlying obligor. Stronger companies have tighter credit spreads, and weaker companies have wider credit spreads.
Price
The price input is a significant unobservable input for certain fixed income instruments. For these instruments, the price input is expressed as a percentage of the notional amount, with a price of $100 meaning that the instrument is valued at par. For most of these instruments, the price varies between zero to $100, or slightly above $100. Relatively illiquid assets that have experienced significant losses since issuance, such as certain asset-backed securities, are at the lower end of the range, whereas most investment grade corporate bonds will fall in the middle to the higher end of the range. For certain structured debt instruments with embedded derivatives, the price input may be above $100 to reflect the embedded features of the instrument (for example, a step-up coupon or a conversion option).
The price input is also a significant unobservable input for certain equity securities; however, the range of price inputs varies depending on the nature of the position, the number of shares outstanding and other factors.
Mean Reversion
A number of financial instruments require an estimate of the rate at which the interest rate reverts to its long-term average. Changes in this estimate can significantly affect the fair value of these instruments. However, sometimes there is insufficient external market data to calibrate this parameter, especially when pricing more complex instruments. The level of mean reversion affects the correlation between short- and long-term interest rates. The fair values of more complex instruments, such as Bermudan swaptions (options with multiple exercise dates) and constant maturity spread options or structured debts with these embedded features, are more sensitive to the changes in this correlation as compared to less complex instruments, such as caps and floors.
Items Measured at Fair Value on a Nonrecurring Basis
Certain assets and liabilities are measured at fair value on a nonrecurring basis and therefore are not included in the tables above. These include assets measured at cost that have been written down to fair value during the periods as a result of an impairment. In addition, these assets include loans held-for-sale and other real estate owned that are measured at the lower of cost or market.
The following table presents the carrying amounts of all assets that were still held for which a nonrecurring fair value measurement was recorded:
|
|
|
|
|
|
|
|
|
|
|
In millions of dollars |
Fair value |
Level 2 |
Level 3 |
December 31, 2017 |
|
|
|
Loans held-for-sale(1)
|
$ |
5,675 |
|
$ |
2,066 |
|
$ |
3,609 |
|
Other real estate owned |
54 |
|
10 |
|
44 |
|
Loans(2)
|
630 |
|
216 |
|
414 |
|
Total assets at fair value on a nonrecurring basis |
$ |
6,359 |
|
$ |
2,292 |
|
$ |
4,067 |
|
|
|
|
|
|
|
|
|
|
|
|
In millions of dollars |
Fair value |
Level 2 |
Level 3 |
December 31, 2016 |
|
|
|
Loans held-for-sale(1)
|
$ |
5,802 |
|
$ |
3,389 |
|
$ |
2,413 |
|
Other real estate owned |
75 |
|
15 |
|
60 |
|
Loans(2)
|
1,376 |
|
586 |
|
790 |
|
Total assets at fair value on a nonrecurring basis |
$ |
7,253 |
|
$ |
3,990 |
|
$ |
3,263 |
|
|
|
(1) |
Net of fair value amounts on the unfunded portion of loans held-for-sale, recognized within Other liabilities on the Consolidated Balance Sheet.
|
|
|
(2) |
Represents impaired loans held for investment whose carrying amount is based on the fair value of the underlying collateral, primarily real estate secured loans. |
The fair value of loans held-for-sale is determined where possible using quoted secondary-market prices. If no such quoted price exists, the fair value of a loan is determined using quoted prices for a similar asset or assets, adjusted for the specific attributes of that loan. Fair value for the other real estate owned is based on appraisals. For loans whose carrying amount is based on the fair value of the underlying collateral, the fair values depend on the type of collateral. Fair value of the collateral is typically estimated based on quoted market prices if available, appraisals or other internal valuation techniques.
Where the fair value of the related collateral is based on an unadjusted appraised value, the loan is generally classified as Level 2. Where significant adjustments are made to the appraised value, the loan is classified as Level 3. Additionally, for corporate loans, appraisals of the collateral are often based on sales of similar assets; however, because the prices of similar assets require significant adjustments to reflect the unique features of the underlying collateral, these fair value measurements are generally classified as Level 3.
Valuation Techniques and Inputs for Level 3 Nonrecurring Fair Value Measurements
The following tables present the valuation techniques covering the majority of Level 3 nonrecurring fair value measurements and the most significant unobservable inputs used in those measurements:
|
|
|
|
|
|
|
|
|
|
|
|
|
|
|
|
As of December 31, 2017 |
Fair value(1)
(in millions)
|
Methodology |
Input |
Low(2)
|
High |
Weighted
average(3)
|
Loans held-for-sale |
$ |
3,186 |
|
Price-based |
Price |
$ |
77.93 |
|
$ |
100.00 |
|
$ |
99.26 |
|
Other real estate owned |
$ |
42 |
|
Price-based |
Appraised value(4)
|
$ |
20,278 |
|
$ |
8,091,760 |
|
$ |
4,016,665 |
|
|
|
|
Discount to price |
34.00 |
% |
34.00 |
% |
34.00 |
% |
|
|
|
Price |
$ |
30.00 |
|
$ |
50.36 |
|
$ |
49.09 |
|
Loans (5)
|
$ |
133 |
|
Price-based |
Price |
$ |
2.80 |
|
$ |
100.00 |
|
$ |
62.46 |
|
|
129 |
|
Cash flow |
Recovery rate |
50.00 |
% |
100.00 |
% |
63.59 |
% |
|
127 |
|
Recovery analysis |
Appraised value |
$ |
— |
|
$ |
45,500,000 |
|
$ |
38,785,667 |
|
|
|
|
|
|
|
|
|
|
|
|
|
|
|
|
|
As of December 31, 2016 |
Fair value(1)
(in millions)
|
Methodology |
Input |
Low(2)
|
High |
Weighted
average(3)
|
Loans held-for-sale |
$ |
2,413 |
|
Price-based |
Price |
$ |
— |
|
$ |
100.00 |
|
$ |
93.08 |
|
Other real estate owned |
$ |
59 |
|
Price-based |
Discount to price(6)
|
0.34 |
% |
13.00 |
% |
3.10 |
% |
|
|
|
|
Price |
$ |
64.65 |
|
$ |
74.39 |
|
$ |
66.21 |
|
Loans(4)
|
$ |
431 |
|
Cash flow |
Price |
$ |
3.25 |
|
$ |
105 |
|
$ |
59.61 |
|
|
197 |
|
Recovery analysis |
Forward price |
$ |
2.90 |
|
$ |
210.00 |
|
$ |
156.78 |
|
|
135 |
|
Price-based |
Discount to price(6)
|
0.25 |
% |
13.00 |
% |
8.34 |
% |
|
|
|
Appraised value(4)
|
$ |
25.80 |
|
$ |
26,400,000 |
|
$ |
6,462,735 |
|
|
|
(1) |
The fair value amounts presented in this table represent the primary valuation technique or techniques for each class of assets or liabilities. |
|
|
(2) |
Some inputs are shown as zero due to rounding. |
|
|
(3) |
Weighted averages are calculated based on the fair values of the instruments. |
|
|
(4) |
Appraised values are disclosed in whole dollars. |
|
|
(5) |
Includes estimated costs to sell. |
|
|
(6) |
Represents impaired loans held for investment whose carrying amounts are based on the fair value of the underlying collateral, primarily real estate secured loans. |
Nonrecurring Fair Value Changes
The following table presents total nonrecurring fair value measurements for the period, included in earnings, attributable to the change in fair value relating to assets that were still held:
|
|
|
|
|
|
Year ended December 31, |
In millions of dollars |
2017 |
Loans held-for-sale |
$ |
(26 |
) |
Other real estate owned |
(4 |
) |
Loans(1)
|
(87 |
) |
Total nonrecurring fair value gains (losses) |
$ |
(117 |
) |
|
|
|
|
|
|
Year ended December 31, |
In millions of dollars |
2016 |
Loans held-for-sale |
$ |
(2 |
) |
Other real estate owned |
(5 |
) |
Loans(1)
|
(105 |
) |
Total nonrecurring fair value gains (losses) |
$ |
(112 |
) |
|
|
(1) |
Represents loans held for investment whose carrying amount is based on the fair value of the underlying collateral, primarily real estate loans. |
Estimated Fair Value of Financial Instruments not Carried at Fair Value
The following table presents the carrying value and fair value of Citigroup’s financial instruments that are not carried at fair value. The table below therefore excludes items measured at fair value on a recurring basis presented in the tables above.
The disclosure also excludes leases, affiliate investments, pension and benefit obligations, certain insurance contracts and tax-related items. Also, as required, the disclosure excludes the effect of taxes, any premium or discount that could result from offering for sale at one time the entire holdings of a particular instrument, excess fair value associated with deposits with no fixed maturity and other expenses that would be incurred in a market transaction. In addition, the table excludes the values of non-financial assets and liabilities, as well as a wide range of franchise, relationship and intangible values, which are integral to a full assessment of Citigroup’s financial position and the value of its net assets.
The fair value represents management’s best estimates based on a range of methodologies and assumptions. The
carrying value of short-term financial instruments not accounted for at fair value, as well as receivables and payables arising in the ordinary course of business, approximates fair value because of the relatively short period of time between their origination and expected realization. Quoted market prices are used when available for investments and for liabilities, such as long-term debt not carried at fair value. For loans not accounted for at fair value, cash flows are discounted at quoted secondary market rates or estimated market rates if available. Otherwise, sales of comparable loan portfolios or current market origination rates for loans with similar terms and risk characteristics are used. Expected credit losses are either embedded in the estimated future cash flows or incorporated as an adjustment to the discount rate used. The value of collateral is also considered. For liabilities such as long-term debt not accounted for at fair value and without quoted market prices, market borrowing rates of interest are used to discount contractual cash flows.
|
|
|
|
|
|
|
|
|
|
|
|
|
|
|
|
|
|
December 31, 2017 |
Estimated fair value |
|
Carrying
value
|
Estimated
fair value
|
|
|
|
In billions of dollars |
Level 1 |
Level 2 |
Level 3 |
Assets |
|
|
|
|
|
Investments |
$ |
60.2 |
|
$ |
60.6 |
|
$ |
0.5 |
|
$ |
57.5 |
|
$ |
2.6 |
|
Federal funds sold and securities borrowed or purchased under agreements to resell |
99.5 |
|
99.5 |
|
— |
|
94.4 |
|
5.1 |
|
Loans(1)(2)
|
648.6 |
|
644.9 |
|
— |
|
6.0 |
|
638.9 |
|
Other financial assets(2)(3)
|
242.6 |
|
243.0 |
|
166.4 |
|
14.1 |
|
62.5 |
|
Liabilities |
|
|
|
|
|
Deposits |
$ |
958.4 |
|
$ |
955.6 |
|
$ |
— |
|
$ |
816.1 |
|
$ |
139.5 |
|
Federal funds purchased and securities loaned or sold under agreements to repurchase |
115.6 |
|
115.6 |
|
— |
|
115.6 |
|
— |
|
Long-term debt(4)
|
205.3 |
|
214.0 |
|
— |
|
187.2 |
|
26.8 |
|
Other financial liabilities(5)
|
129.9 |
|
129.9 |
|
— |
|
15.5 |
|
114.4 |
|
|
|
|
|
|
|
|
|
|
|
|
|
|
|
|
|
|
|
December 31, 2016 |
Estimated fair value |
|
Carrying
value
|
Estimated
fair value
|
|
|
|
In billions of dollars |
Level 1 |
Level 2 |
Level 3 |
Assets |
|
|
|
|
|
Investments |
$ |
52.1 |
|
$ |
52.0 |
|
$ |
0.8 |
|
$ |
48.6 |
|
$ |
2.6 |
|
Federal funds sold and securities borrowed or purchased under agreements to resell |
103.6 |
|
103.6 |
|
— |
|
98.5 |
|
5.1 |
|
Loans(1)(2)
|
607.0 |
|
607.3 |
|
— |
|
7.0 |
|
600.3 |
|
Other financial assets(2)(3)
|
215.2 |
|
215.9 |
|
145.6 |
|
16.2 |
|
54.1 |
|
Liabilities |
|
|
|
|
|
Deposits |
$ |
928.2 |
|
$ |
927.6 |
|
$ |
— |
|
$ |
789.7 |
|
$ |
137.9 |
|
Federal funds purchased and securities loaned or sold under agreements to repurchase |
108.2 |
|
108.2 |
|
— |
|
107.8 |
|
0.4 |
|
Long-term debt(4)
|
179.9 |
|
185.5 |
|
— |
|
156.5 |
|
29.0 |
|
Other financial liabilities(5)
|
115.3 |
|
115.3 |
|
— |
|
16.2 |
|
99.1 |
|
|
|
(1)
|
The carrying value of loans is net of the Allowance for loan losses of $12.4 billion for December 31, 2017 and $12.1 billion for December 31, 2016. In addition, the carrying values exclude $1.7 billion and $1.9 billion of lease finance receivables at December 31, 2017 and December 31, 2016, respectively.
|
|
|
(2) |
Includes items measured at fair value on a nonrecurring basis. |
|
|
(3) |
Includes cash and due from banks, deposits with banks, brokerage receivables, reinsurance recoverable and other financial instruments included in Other assets on the Consolidated Balance Sheet, for all of which the carrying value is a reasonable estimate of fair value.
|
|
|
(4) |
The carrying value includes long-term debt balances under qualifying fair value hedges. |
|
|
(5) |
Includes brokerage payables, short-term borrowings (carried at cost) and other financial instruments included in Other liabilities on the Consolidated Balance Sheet, for all of which the carrying value is a reasonable estimate of fair value.
|
Fair values vary from period to period based on changes in a wide range of factors, including interest rates, credit quality and market perceptions of value, and as existing assets and liabilities run off and new transactions are entered into. The estimated fair values of loans reflect changes in credit status since the loans were made, changes in interest rates in the case of fixed-rate loans and premium values at origination of certain loans.
The estimated fair values of the Company’s corporate unfunded lending commitments at December 31, 2017 and December 31, 2016 were liabilities of $3.2 billion and $5.2 billion, respectively, substantially all of which are classified as Level 3. The Company does not estimate the fair values of consumer unfunded lending commitments, which are generally cancelable by providing notice to the borrower.
25. FAIR VALUE ELECTIONS
The Company may elect to report most financial instruments and certain other items at fair value on an instrument-by-instrument basis with changes in fair value reported in earnings, other than DVA (see below). The election is made upon the initial recognition of an eligible financial asset, financial liability or firm commitment or when certain specified reconsideration events occur. The fair value election may not be revoked once an election is made. The changes in
fair value are recorded in current earnings, other than DVA, which from January 1, 2016 is reported in AOCI. Additional discussion regarding the applicable areas in which fair value elections were made is presented in Note 24 to the Consolidated Financial Statements.
The Company has elected fair value accounting for its mortgage servicing rights. See Note 21 to the Consolidated Financial Statements for further discussions regarding the accounting and reporting of MSRs.
The following table presents the changes in fair value of those items for which the fair value option has been elected:
|
|
|
|
|
|
|
|
|
Changes in fair value gains (losses) for
the years ended December 31,
|
|
In millions of dollars |
2017 |
2016 |
Assets |
|
|
|
Federal funds sold and securities borrowed or purchased under agreements to resell
selected portfolios of securities purchased under agreements
to resell and securities borrowed
|
$ |
(133 |
) |
$ |
(89 |
) |
Trading account assets |
1,622 |
|
404 |
|
Investments |
(3 |
) |
(25 |
) |
Loans |
|
|
Certain corporate loans
|
(537 |
) |
40 |
|
Certain consumer loans |
3 |
|
— |
|
Total loans |
$ |
(534 |
) |
$ |
40 |
|
Other assets |
|
|
MSRs |
$ |
65 |
|
$ |
(36 |
) |
Certain mortgage loans held for sale(1)
|
142 |
|
284 |
|
Other assets |
— |
|
376 |
|
Total other assets |
$ |
207 |
|
$ |
624 |
|
Total assets |
$ |
1,159 |
|
$ |
954 |
|
Liabilities |
|
|
Interest-bearing deposits |
$ |
(69 |
) |
$ |
(50 |
) |
|
Federal funds purchased and securities loaned or sold under agreements to repurchase
selected portfolios of securities sold under agreements to repurchase and securities loaned
|
223 |
|
45 |
|
Trading account liabilities |
70 |
|
105 |
|
Short-term borrowings |
(116 |
) |
(61 |
) |
Long-term debt |
(1,491 |
) |
(935 |
) |
Total liabilities |
$ |
(1,383 |
) |
$ |
(896 |
) |
|
|
(1) |
Includes gains (losses) associated with interest rate lock-commitments for those loans that have been originated and elected under the fair value option. |
Own Debt Valuation Adjustments (DVA)
Own debt valuation adjustments are recognized on Citi’s liabilities for which the fair value option has been elected using Citi’s credit spreads observed in the bond market. Effective January 1, 2016, changes in fair value of fair value option liabilities related to changes in Citigroup’s own credit spreads (DVA) are reflected as a component of AOCI; previously these amounts were recognized in Citigroup’s Revenues and Net income along with all other changes in fair value. See Note 1 to the Consolidated Financial Statements for additional information.
Among other variables, the fair value of liabilities for which the fair value option has been elected (other than non-recourse and similar liabilities) is impacted by the narrowing or widening of the Company’s credit spreads.
The estimated change in the fair value of these liabilities due to such changes in the Company’s own credit spread (or instrument-specific credit risk) were losses of $680 million and $538 million for the years ended December 31, 2017 and 2016, respectively. Changes in fair value resulting from changes in instrument-specific credit risk were estimated by incorporating the Company’s current credit spreads observable in the bond market into the relevant valuation technique used to value each liability as described above.
The Fair Value Option for Financial Assets and Financial Liabilities
Selected Portfolios of Securities Purchased Under Agreements to Resell, Securities Borrowed, Securities Sold Under Agreements to Repurchase, Securities Loaned and Certain Non-Collateralized Short-Term Borrowings
The Company elected the fair value option for certain portfolios of fixed income securities purchased under agreements to resell and fixed income securities sold under agreements to repurchase, securities borrowed, securities loaned and certain non-collateralized short-term borrowings held primarily by broker-dealer entities in the United States, United Kingdom and Japan. In each case, the election was made because the related interest-rate risk is managed on a portfolio basis, primarily with offsetting derivative instruments that are accounted for at fair value through earnings.
Changes in fair value for transactions in these portfolios are recorded in Principal transactions. The related interest revenue and interest expense are measured based on the contractual rates specified in the transactions and are reported as Interest revenue and expense in the Consolidated Statement of Income.
Certain Loans and Other Credit Products
Citigroup has also elected the fair value option for certain other originated and purchased loans, including certain unfunded loan products, such as guarantees and letters of credit, executed by Citigroup’s lending and trading businesses. None of these credit products are highly leveraged financing commitments. Significant groups of transactions include loans and unfunded loan products that are expected to be either sold or securitized in the near term, or transactions where the economic risks are hedged with derivative instruments, such as purchased credit default swaps or total return swaps where the Company pays the total return on the underlying loans to a third party. Citigroup has elected the fair value option to mitigate accounting mismatches in cases where hedge accounting is complex and to achieve operational simplifications. Fair value was not elected for most lending transactions across the Company.
The following table provides information about certain credit products carried at fair value:
|
|
|
|
|
|
|
|
|
|
|
|
|
|
|
December 31, 2017 |
December 31, 2016 |
In millions of dollars |
Trading assets |
Loans |
Trading assets |
Loans |
Carrying amount reported on the Consolidated Balance Sheet |
$ |
8,851 |
|
$ |
4,374 |
|
$ |
9,824 |
|
$ |
3,486 |
|
Aggregate unpaid principal balance in excess of fair value |
623 |
|
682 |
|
758 |
|
18 |
|
Balance of non-accrual loans or loans more than 90 days past due |
— |
|
1 |
|
— |
|
1 |
|
Aggregate unpaid principal balance in excess of fair value for non-accrual loans or loans more than 90 days past due |
— |
|
1 |
|
— |
|
1 |
|
In addition to the amounts reported above, $508 million and $1,828 million of unfunded commitments related to certain credit products selected for fair value accounting were outstanding as of December 31, 2017 and 2016, respectively.
Changes in the fair value of funded and unfunded credit products are classified in Principal transactions in Citi’s Consolidated Statement of Income. Related interest revenue is measured based on the contractual interest rates and reported
as Interest revenue on Trading account assets or loan interest depending on the balance sheet classifications of the credit products. The changes in fair value for the years ended December 31, 2017 and 2016 due to instrument-specific credit risk totaled to gains of $10 million and $76 million, respectively.
Certain Investments in Unallocated Precious Metals
Citigroup invests in unallocated precious metals accounts (gold, silver, platinum and palladium) as part of its commodity and foreign currency trading activities or to economically hedge certain exposures from issuing structured liabilities. Under ASC 815, the investment is bifurcated into a debt host contract and a commodity forward derivative instrument. Citigroup elects the fair value option for the debt host contract, and reports the debt host contract within Trading account assets on the Company’s Consolidated Balance Sheet. The total carrying amount of debt host contracts across unallocated precious metals accounts was approximately $0.9 billion and $0.6 billion at December 31, 2017 and 2016, respectively. The amounts are expected to fluctuate based on trading activity in future periods.
As part of its commodity and foreign currency trading activities, Citi trades unallocated precious metals investments and executes forward purchase and forward sale derivative contracts with trading counterparties. When Citi sells an unallocated precious metals investment, Citi’s receivable from its depository bank is repaid and Citi derecognizes its investment in the unallocated precious metal. The forward purchase or sale contract with the trading counterparty indexed to unallocated precious metals is accounted for as a derivative, at fair value through earnings. As of December 31, 2017, there were approximately $10.3 billion and $9.3 billion notional amounts of such forward purchase and forward sale derivative contracts outstanding, respectively.
Certain Investments in Private Equity and Real Estate Ventures and Certain Equity Method and Other Investments
Citigroup invests in private equity and real estate ventures for the purpose of earning investment returns and for capital appreciation. The Company has elected the fair value option for certain of these ventures, because such investments are considered similar to many private equity or hedge fund activities in Citi’s investment companies, which are reported at fair value. The fair value option brings consistency in the accounting and evaluation of these investments. All investments (debt and equity) in such private equity and real estate entities are accounted for at fair value. These investments are classified as Investments on Citigroup’s Consolidated Balance Sheet.
Changes in the fair values of these investments are classified in Other revenue in the Company’s Consolidated Statement of Income.
Citigroup also elects the fair value option for certain non-marketable equity securities whose risk is managed with derivative instruments that are accounted for at fair value through earnings. These securities are classified as Trading account assets on Citigroup’s Consolidated Balance Sheet. Changes in the fair value of these securities and the related derivative instruments are recorded in Principal transactions.
Certain Mortgage Loans Held-for-Sale (HFS)
Citigroup has elected the fair value option for certain purchased and originated prime fixed-rate and conforming adjustable-rate first mortgage loans HFS. These loans are intended for sale or securitization and are hedged with derivative instruments. The Company has elected the fair value option to mitigate accounting mismatches in cases where hedge accounting is complex and to achieve operational simplifications.
The following table provides information about certain mortgage loans HFS carried at fair value:
|
|
|
|
|
|
|
|
In millions of dollars |
December 31,
2017 |
December 31, 2016 |
Carrying amount reported on the Consolidated Balance Sheet |
$ |
426 |
|
$ |
915 |
|
Aggregate fair value in excess of (less than) unpaid principal balance |
14 |
|
8 |
|
Balance of non-accrual loans or loans more than 90 days past due |
— |
|
— |
|
Aggregate unpaid principal balance in excess of fair value for non-accrual loans or loans more than 90 days past due |
— |
|
— |
|
The changes in the fair values of these mortgage loans are reported in Other revenue in the Company’s Consolidated Statement of Income. There was no net change in fair value during the years ended December 31, 2017 and 2016 due to instrument-specific credit risk. Related interest income continues to be measured based on the contractual interest rates and reported as Interest revenue in the Consolidated Statement of Income.
Certain Structured Liabilities
The Company has elected the fair value option for certain structured liabilities whose performance is linked to structured interest rates, inflation, currency, equity, referenced credit or commodity risks. The Company elected the fair value option, because these exposures are considered to be trading-related positions and, therefore, are managed on a fair value basis. These positions will continue to be classified as debt, deposits or derivatives (Trading account liabilities) on the Company’s Consolidated Balance Sheet according to their legal form.
The following table provides information about the carrying value of structured notes, disaggregated by type of embedded derivative instrument:
|
|
|
|
|
|
|
|
In billions of dollars |
December 31, 2017 |
December 31, 2016 |
Interest rate linked |
$ |
13.9 |
|
$ |
10.6 |
|
Foreign exchange linked |
0.3 |
|
0.2 |
|
Equity linked |
13.0 |
|
12.3 |
|
Commodity linked |
0.2 |
|
0.3 |
|
Credit linked |
1.9 |
|
0.9 |
|
Total |
$ |
29.3 |
|
$ |
24.3 |
|
Prior to 2016, the total change in the fair value of these structured liabilities was reported in Principal transactions in the Company’s Consolidated Statement of Income. Beginning in the first quarter of 2016, the portion of the changes in fair value attributable to changes in Citigroup’s own credit spreads (DVA) are reflected as a component of AOCI while all other changes in fair value will continue to be reported in Principal transactions. Changes in the fair value of these structured liabilities include accrued interest, which is also included in the change in fair value reported in Principal transactions.
Certain Non-Structured Liabilities
The Company has elected the fair value option for certain non-structured liabilities with fixed and floating interest rates. The Company has elected the fair value option where the interest-rate risk of such liabilities may be economically hedged with derivative contracts or the proceeds are used to purchase
financial assets that will also be accounted for at fair value through earnings. The elections have been made to mitigate accounting mismatches and to achieve operational simplifications. These positions are reported in Short-term borrowings and Long-term debt on the Company’s Consolidated Balance Sheet. Prior to 2016, the total change in the fair value of these non-structured liabilities was reported in Principal transactions in the Company’s Consolidated Statement of Income. Beginning in the first quarter of 2016, the portion of the changes in fair value attributable to changes in Citigroup’s own credit spreads (DVA) is reflected as a component of AOCI while all other changes in fair value will continue to be reported in Principal transactions.
Interest expense on non-structured liabilities is measured based on the contractual interest rates and reported as Interest expense in the Consolidated Statement of Income.
The following table provides information about long-term debt carried at fair value:
|
|
|
|
|
|
|
|
In millions of dollars |
December 31, 2017 |
December 31, 2016 |
Carrying amount reported on the Consolidated Balance Sheet |
$ |
31,392 |
|
$ |
26,254 |
|
Aggregate unpaid principal balance in excess of (less than) fair value |
(579 |
) |
(128 |
) |
The following table provides information about short-term borrowings carried at fair value:
|
|
|
|
|
|
|
|
In millions of dollars |
December 31, 2017 |
December 31, 2016 |
Carrying amount reported on the Consolidated Balance Sheet |
$ |
4,627 |
|
$ |
2,700 |
|
Aggregate unpaid principal balance in excess of (less than) fair value |
74 |
|
(61 |
) |
26. PLEDGED ASSETS, COLLATERAL, GUARANTEES AND COMMITMENTS
Pledged Assets
In connection with Citi’s financing and trading activities, Citi has pledged assets to collateralize its obligations under repurchase agreements, secured financing agreements, secured liabilities of consolidated VIEs and other borrowings. The approximate carrying values of the significant components of pledged assets recognized on Citi’s Consolidated Balance Sheet included:
|
|
|
|
|
|
|
|
In millions of dollars |
2017 |
2016 |
Investment securities |
$ |
138,807 |
|
$ |
161,914 |
|
Loans |
229,552 |
|
231,833 |
|
Trading account assets |
102,892 |
|
84,371 |
|
Total |
$ |
471,251 |
|
$ |
478,118 |
|
In addition, included in Cash and due from banks and Deposits with banks at December 31, 2017 and 2016 were $7.4 billion and $6.8 billion, respectively, of cash segregated under federal and other brokerage regulations or deposited with clearing organizations.
Collateral
At December 31, 2017 and 2016, the approximate fair value of collateral received by Citi that may be resold or repledged, excluding the impact of allowable netting, was $457.5 billion and $378.1 billion, respectively. This collateral was received in connection with resale agreements, securities borrowings and loans, derivative transactions and margined broker loans.
At December 31, 2017 and 2016, a substantial portion of the collateral received by Citi had been sold or repledged in connection with repurchase agreements, securities sold, not yet purchased, securities borrowings and loans, pledges to clearing organizations, segregation requirements under securities laws and regulations, derivative transactions and bank loans.
In addition, at December 31, 2017 and 2016, Citi had pledged $362 billion and $388 billion, respectively, of
collateral that may not be sold or repledged by the secured parties.
Lease Commitments
Rental expense (principally for offices, branches and computer equipment) was $1.1 billion, $1.1 billion and $1.3 billion for the years ended December 31, 2017, 2016 and 2015, respectively.
Future minimum annual rentals under non-cancelable leases, net of sublease income, are as follows:
|
|
|
|
|
In millions of dollars |
|
2018 |
$ |
968 |
|
2019 |
837 |
|
2020 |
676 |
|
2021 |
568 |
|
2022 |
469 |
|
Thereafter |
2,593 |
|
Total |
$ |
6,111 |
|
Guarantees
Citi provides a variety of guarantees and indemnifications to its customers to enhance their credit standing and enable them to complete a wide variety of business transactions. For
certain contracts meeting the definition of a guarantee, the guarantor must recognize, at inception, a liability for the fair value of the obligation undertaken in issuing the guarantee.
In addition, the guarantor must disclose the maximum potential amount of future payments that the guarantor could be required to make under the guarantee, if there were a total
default by the guaranteed parties. The determination of the maximum potential future payments is based on the notional amount of the guarantees without consideration of possible recoveries under recourse provisions or from collateral held or pledged. As such, Citi believes such amounts bear no relationship to the anticipated losses, if any, on these guarantees.
The following tables present information about Citi’s guarantees:
|
|
|
|
|
|
|
|
|
|
|
|
|
|
|
Maximum potential amount of future payments |
|
In billions of dollars at December 31, 2017 except carrying value in millions |
Expire within
1 year
|
Expire after
1 year
|
Total amount
outstanding
|
Carrying value
(in millions of dollars)
|
Financial standby letters of credit |
$ |
27.9 |
|
$ |
65.9 |
|
$ |
93.8 |
|
$ |
93 |
|
Performance guarantees |
7.2 |
|
4.1 |
|
11.3 |
|
20 |
|
Derivative instruments considered to be guarantees |
11.0 |
|
84.9 |
|
95.9 |
|
423 |
|
Loans sold with recourse |
— |
|
0.2 |
|
0.2 |
|
9 |
|
Securities lending indemnifications(1)
|
103.7 |
|
— |
|
103.7 |
|
— |
|
Credit card merchant processing(1)(2)
|
85.5 |
|
— |
|
85.5 |
|
— |
|
Credit card arrangements with partners |
0.3 |
|
1.1 |
|
1.4 |
|
205 |
|
Custody indemnifications and other |
— |
|
36.0 |
|
36.0 |
|
59 |
|
Total |
$ |
235.6 |
|
$ |
192.2 |
|
$ |
427.8 |
|
$ |
809 |
|
|
|
|
|
|
|
|
|
|
|
|
|
|
|
|
Maximum potential amount of future payments |
|
In billions of dollars at December 31, 2016 except carrying value in millions |
Expire within
1 year |
Expire after
1 year |
Total amount
outstanding |
Carrying value
(in millions of dollars)
|
Financial standby letters of credit |
$ |
26.0 |
|
$ |
67.1 |
|
$ |
93.1 |
|
$ |
141 |
|
Performance guarantees |
7.5 |
|
3.6 |
|
11.1 |
|
19 |
|
Derivative instruments considered to be guarantees |
7.2 |
|
80.0 |
|
87.2 |
|
747 |
|
Loans sold with recourse |
— |
|
0.2 |
|
0.2 |
|
12 |
|
Securities lending indemnifications(1)
|
80.3 |
|
— |
|
80.3 |
|
— |
|
Credit card merchant processing(1)(2)
|
86.4 |
|
— |
|
86.4 |
|
— |
|
|
Credit card arrangements with partners
|
— |
|
1.5 |
|
1.5 |
|
206 |
|
Custody indemnifications and other |
— |
|
45.4 |
|
45.4 |
|
58 |
|
Total |
$ |
207.4 |
|
$ |
197.8 |
|
$ |
405.2 |
|
$ |
1,183 |
|
|
|
(1) |
The carrying values of securities lending indemnifications and credit card merchant processing were not material for either period presented, as the probability of potential liabilities arising from these guarantees is minimal. |
|
|
(2) |
At December 31, 2017 and 2016, this maximum potential exposure was estimated to be $86 billion and $86 billion, respectively. However, Citi believes that the maximum exposure is not representative of the actual potential loss exposure based on its historical experience. This contingent liability is unlikely to arise, as most products and services are delivered when purchased and amounts are refunded when items are returned to merchants.
|
Financial Standby Letters of Credit
Citi issues standby letters of credit, which substitute its own credit for that of the borrower. If a letter of credit is drawn down, the borrower is obligated to repay Citi. Standby letters of credit protect a third party from defaults on contractual obligations. Financial standby letters of credit include (i) guarantees of payment of insurance premiums and reinsurance risks that support industrial revenue bond underwriting, (ii) settlement of payment obligations to clearing houses, including futures and over-the-counter derivatives clearing (see further discussion below), (iii) support options and purchases of securities in lieu of escrow deposit accounts and (iv) letters of credit that backstop loans, credit facilities, promissory notes and trade acceptances.
Performance Guarantees
Performance guarantees and letters of credit are issued to guarantee a customer’s tender bid on a construction or systems-installation project or to guarantee completion of such projects in accordance with contract terms. They are also issued to support a customer’s obligation to supply specified products, commodities or maintenance or warranty services to a third party.
Derivative Instruments Considered to Be Guarantees
Derivatives are financial instruments whose cash flows are based on a notional amount and an underlying instrument, reference credit or index, where there is little or no initial investment, and whose terms require or permit net settlement. For a discussion of Citi’s derivatives activities, see Note 22 to the Consolidated Financial Statements.
Derivative instruments considered to be guarantees include only those instruments that require Citi to make payments to the counterparty based on changes in an underlying instrument that is related to an asset, a liability or an equity security held by the guaranteed party. More specifically, derivative instruments considered to be
guarantees include certain over-the-counter written put options where the counterparty is not a bank, hedge fund or broker-dealer (such counterparties are considered to be dealers in these markets and may, therefore, not hold the underlying instruments). Credit derivatives sold by Citi are excluded from the tables above as they are disclosed separately in Note 22 to the Consolidated Financial Statements. In instances where Citi’s maximum potential future payment is unlimited, the notional amount of the contract is disclosed.
Loans Sold with Recourse
Loans sold with recourse represent Citi’s obligations to reimburse the buyers for loan losses under certain circumstances. Recourse refers to the clause in a sales agreement under which a seller/lender will fully reimburse the buyer/investor for any losses resulting from the purchased loans. This may be accomplished by the seller taking back any loans that become delinquent.
In addition to the amounts shown in the tables above, Citi has recorded a repurchase reserve for its potential repurchases or make-whole liability regarding residential mortgage representation and warranty claims related to its whole loan sales to the U.S. government-sponsored enterprises (GSEs) and, to a lesser extent, private investors. The repurchase reserve was approximately $66 million and $107 million at December 31, 2017 and 2016, respectively, and these amounts are included in Other liabilities on the Consolidated Balance Sheet.
Securities Lending Indemnifications
Owners of securities frequently lend those securities for a fee to other parties who may sell them short or deliver them to another party to satisfy some other obligation. Banks may administer such securities lending programs for their clients. Securities lending indemnifications are issued by the bank to guarantee that a securities lending customer will be made
whole in the event that the security borrower does not return the security subject to the lending agreement and collateral held is insufficient to cover the market value of the security.
Credit Card Merchant Processing
Credit card merchant processing guarantees represent the Company’s indirect obligations in connection with (i) providing transaction processing services to various merchants with respect to its private-label cards and (ii) potential liability for bank card transaction processing services. The nature of the liability in either case arises as a result of a billing dispute between a merchant and a cardholder that is ultimately resolved in the cardholder’s favor. The merchant is liable to refund the amount to the cardholder. In general, if the credit card processing company is unable to collect this amount from the merchant, the credit card processing company bears the loss for the amount of the credit or refund paid to the cardholder.
With regard to (i) above, Citi has the primary contingent liability with respect to its portfolio of private-label merchants. The risk of loss is mitigated as the cash flows between Citi and the merchant are settled on a net basis, and Citi has the right to offset any payments with cash flows otherwise due to the merchant. To further mitigate this risk, Citi may delay settlement, require a merchant to make an escrow deposit, include event triggers to provide Citi with more financial and operational control in the event of the financial deterioration of the merchant or require various credit enhancements (including letters of credit and bank guarantees). In the unlikely event that a private-label merchant is unable to deliver products, services or a refund to its private-label cardholders, Citi is contingently liable to credit or refund cardholders.
With regard to (ii) above, Citi has a potential liability for bank card transactions where Citi provides the transaction processing services as well as those where a third party provides the services and Citi acts as a secondary guarantor, should that processor fail to perform.
Citi’s maximum potential contingent liability related to both bank card and private-label merchant processing services is estimated to be the total volume of credit card transactions that meet the requirements to be valid charge-back transactions at any given time. At December 31, 2017 and 2016, this maximum potential exposure was estimated to be $86 billion and $86 billion, respectively.
However, Citi believes that the maximum exposure is not representative of the actual potential loss exposure based on its historical experience. This contingent liability is unlikely to arise, as most products and services are delivered when purchased and amounts are refunded when items are returned to merchants. Citi assesses the probability and amount of its contingent liability related to merchant processing based on the financial strength of the primary guarantor, the extent and nature of unresolved charge-backs and its historical loss experience. At December 31, 2017 and 2016, the losses incurred and the carrying amounts of Citi’s contingent obligations related to merchant processing activities were immaterial.
Credit Card Arrangements with Partners
Citi, in certain of its credit card partner arrangements, provides guarantees to the partner regarding the volume of certain customer originations during the term of the agreement. To the extent that such origination targets are not met, the guarantees serve to compensate the partner for certain payments that otherwise would have been generated in connection with such originations.
Custody Indemnifications
Custody indemnifications are issued to guarantee that custody clients will be made whole in the event that a third-party subcustodian or depository institution fails to safeguard clients’ assets.
Other Guarantees and Indemnifications
Credit Card Protection Programs
Citi, through its credit card businesses, provides various
cardholder protection programs on several of its card
products, including programs that provide insurance
coverage for rental cars, coverage for certain losses
associated with purchased products, price protection for
certain purchases and protection for lost luggage. These
guarantees are not included in the table, since the total
outstanding amount of the guarantees and Citi’s maximum
exposure to loss cannot be quantified. The protection is
limited to certain types of purchases and losses, and it is not
possible to quantify the purchases that would qualify for
these benefits at any given time. Citi assesses the probability
and amount of its potential liability related to these programs
based on the extent and nature of its historical loss
experience. At December 31, 2017 and 2016, the actual and estimated losses incurred and the carrying value
of Citi’s obligations related to these programs were
immaterial.
Other Representation and Warranty Indemnifications
In the normal course of business, Citi provides standard representations and warranties to counterparties in contracts in connection with numerous transactions and also provides indemnifications, including indemnifications that protect the counterparties to the contracts in the event that additional taxes are owed, due either to a change in the tax law or an adverse interpretation of the tax law. Counterparties to these transactions provide Citi with comparable indemnifications. While such representations, warranties and indemnifications are essential components of many contractual relationships, they do not represent the underlying business purpose for the transactions. The indemnification clauses are often standard contractual terms related to Citi’s own performance under the terms of a contract and are entered into in the normal course of business based on an assessment that the risk of loss is remote. Often these clauses are intended to ensure that terms of a contract are met at inception. No compensation is received for these standard representations and warranties, and it is not possible to determine their fair value because they rarely, if ever, result in a payment. In many cases, there are no stated or notional amounts included in the
indemnification clauses, and the contingencies potentially triggering the obligation to indemnify have not occurred and are not expected to occur. As a result, these indemnifications are not included in the tables above.
Value-Transfer Networks
Citi is a member of, or shareholder in, hundreds of value-transfer networks (VTNs) (payment, clearing and settlement systems as well as exchanges) around the world. As a condition of membership, many of these VTNs require that members stand ready to pay a pro rata share of the losses incurred by the organization due to another member’s default on its obligations. Citi’s potential obligations may be limited to its membership interests in the VTNs, contributions to the VTN’s funds, or, in limited cases, the obligation may be unlimited. The maximum exposure cannot be estimated as this would require an assessment of future claims that have not yet occurred. Citi believes the risk of loss is remote given historical experience with the VTNs. Accordingly, Citi’s participation in VTNs is not reported in the guarantees tables above, and there are no amounts reflected on the Consolidated Balance Sheet as of December 31, 2017 or 2016 for potential obligations that could arise from Citi’s involvement with VTN associations.
Long-Term Care Insurance Indemnification
In 2000, Travelers Life & Annuity (Travelers), then a subsidiary of Citi, entered into a reinsurance agreement to transfer the risks and rewards of its long-term care (LTC) business to GE Life (now Genworth Financial Inc., or Genworth), then a subsidiary of the General Electric Company (GE). As part of this transaction, the reinsurance obligations were provided by two regulated insurance subsidiaries of GE Life, which funded two collateral trusts with securities. Presently, as discussed below, the trusts are referred to as the Genworth Trusts.
As part of GE’s spin-off of Genworth in 2004, GE retained the risks and rewards associated with the 2000 Travelers reinsurance agreement by providing a reinsurance contract to Genworth through its Union Fidelity Life Insurance Company (UFLIC) subsidiary that covers the Travelers LTC policies. In addition, GE provided a capital maintenance agreement in favor of UFLIC which is designed to assure that UFLIC will have the funds to pay its reinsurance obligations. As a result of these reinsurance agreements and the spin-off of Genworth, Genworth has reinsurance protection from UFLIC (supported by GE) and has reinsurance obligations in connection with the Travelers LTC policies. As noted below, the Genworth reinsurance obligations now benefit Brighthouse Financial, Inc. (Brighthouse). While neither Brighthouse nor Citi are direct beneficiaries of the capital maintenance agreement between GE and UFLIC, Brighthouse and Citi benefit indirectly from the existence of the capital maintenance agreement, which helps assure that UFLIC will continue to have funds necessary to pay its reinsurance obligations to Genworth.
In connection with Citi’s 2005 sale of Travelers to MetLife Inc. (MetLife), Citi provided an indemnification to MetLife for losses (including policyholder claims) relating to
the LTC business for the entire term of the Travelers LTC policies, which, as noted above, are reinsured by subsidiaries of Genworth. In 2017, MetLife spun off its retail insurance business to Brighthouse. As a result, the Travelers LTC policies now reside with Brighthouse. The original reinsurance agreement between Travelers (now Brighthouse) and Genworth remains in place and Brighthouse is the sole beneficiary of the Genworth Trusts. The fair value of the Genworth Trusts is approximately $7.5 billion as of December 31, 2017, compared to $7.0 billion at December 31, 2016. The Genworth Trusts are designed to provide collateral to Brighthouse in an amount equal to the statutory liabilities of Brighthouse in respect of the Travelers LTC policies. The assets in the Genworth Trusts are evaluated and adjusted periodically to ensure that the fair value of the assets continues to provide collateral in an amount equal to these estimated statutory liabilities, as the liabilities change over time.
If both (i) Genworth fails to perform under the original Travelers/GE Life reinsurance agreement for any reason, including insolvency or the failure of UFLIC to perform in a timely manner, and (ii) the assets of the two Genworth Trusts are insufficient or unavailable, then Citi, through its LTC reinsurance indemnification, must reimburse Brighthouse for any losses incurred in connection with the LTC policies. Since both events would have to occur before Citi would become responsible for any payment to Brighthouse pursuant to its indemnification obligation, and the likelihood of such events occurring is currently not probable, there is no liability reflected on the Consolidated Balance Sheet as of December 31, 2017 and 2016 related to this indemnification. Citi continues to closely monitor its potential exposure under this indemnification obligation.
Separately, Genworth announced that it had agreed to be purchased by China Oceanwide Holdings Co., Ltd, subject to a series of conditions and regulatory approvals. Citi is monitoring these developments.
Futures and Over-the-Counter Derivatives Clearing
Citi provides clearing services on central clearing parties (CCPs) for clients that need to clear exchange traded and over-the-counter (OTC) derivatives contracts. Based on all relevant facts and circumstances, Citi has concluded that it acts as an agent for accounting purposes in its role as clearing member for these client transactions. As such, Citi does not reflect the underlying exchange traded or OTC derivatives contracts in its Consolidated Financial Statements. See Note 22 for a discussion of Citi’s derivatives activities that are reflected in its Consolidated Financial Statements.
As a clearing member, Citi collects and remits cash and securities collateral (margin) between its clients and the respective CCP. In certain circumstances, Citi collects a higher amount of cash (or securities) from its clients than it needs to remit to the CCPs. This excess cash is then held at depository institutions such as banks or carry brokers.
There are two types of margin: initial and variation. Where Citi obtains benefits from or controls cash initial margin (e.g., retains an interest spread), cash initial margin
collected from clients and remitted to the CCP or depository institutions is reflected within Brokerage payables (payables to customers) and Brokerage receivables (receivables from brokers, dealers and clearing organizations) or Cash and due from banks, respectively.
However, for exchange traded and OTC-cleared derivatives contracts where Citi does not obtain benefits from or control the client cash balances, the client cash initial margin collected from clients and remitted to the CCP or depository institutions is not reflected on Citi’s Consolidated Balance Sheet. These conditions are met when Citi has contractually agreed with the client that (i) Citi will pass through to the client all interest paid by the CCP or depository institutions on the cash initial margin, (ii) Citi will not utilize its right as a clearing member to transform cash margin into other assets, (iii) Citi does not guarantee and is not liable to the client for the performance of the CCP or the depository institution and (iv) the client cash balances are legally isolated from Citi’s bankruptcy estate. The total amount of cash initial margin collected and remitted in this manner was approximately $10.7 billion and $9.4 billion as of December 31, 2017 and 2016, respectively.
Variation margin due from clients to the respective CCP, or from the CCP to clients, reflects changes in the value of the client’s derivative contracts for each trading day. As a clearing member, Citi is exposed to the risk of non-performance by clients (e.g., failure of a client to post variation margin to the CCP for negative changes in the value of the client’s derivative contracts). In the event of non-performance by a client, Citi would move to close out the client’s positions. The CCP would typically utilize initial margin posted by the client and held by the CCP, with any remaining shortfalls required to be paid by Citi as clearing member. Citi generally holds incremental cash or securities margin posted by the client, which would typically be expected to be sufficient to mitigate Citi’s credit risk in the event that the client fails to perform.
As required by ASC 860-30-25-5, securities collateral posted by clients is not recognized on Citi’s Consolidated Balance Sheet.
Carrying Value—Guarantees and Indemnifications
At December 31, 2017 and 2016, the total carrying amounts of the liabilities related to the guarantees and indemnifications included in the tables above amounted to
approximately $0.8 billion and $1.2 billion, respectively. The carrying value of financial and performance guarantees is included in Other liabilities. For loans sold with recourse, the carrying value of the liability is included in Other liabilities.
Collateral
Cash collateral available to Citi to reimburse losses realized under these guarantees and indemnifications amounted to $46 billion and $48 billion at December 31, 2017 and 2016, respectively. Securities and other marketable assets held as collateral amounted to $70 billion and $41 billion at December 31, 2017 and 2016, respectively. The majority of collateral is held to reimburse losses realized under securities lending indemnifications. Additionally, letters of credit in favor of Citi held as collateral amounted to $3.7 billion and $5.4 billion at December 31, 2017 and 2016, respectively. Other property may also be available to Citi to cover losses under certain guarantees and indemnifications; however, the value of such property has not been determined.
Performance Risk
Citi evaluates the performance risk of its guarantees based on the assigned referenced counterparty internal or external ratings. Where external ratings are used, investment-grade ratings are considered to be Baa/BBB and above, while anything below is considered non-investment grade. Citi’s internal ratings are in line with the related external rating system. On certain underlying referenced assets or entities, ratings are not available. Such referenced assets are included in the “not rated” category. The maximum potential amount of the future payments related to the outstanding guarantees is determined to be the notional amount of these contracts, which is the par amount of the assets guaranteed.
Presented in the tables below are the maximum potential amounts of future payments that are classified based upon internal and external credit ratings. As previously mentioned, the determination of the maximum potential future payments is based on the notional amount of the guarantees without consideration of possible recoveries under recourse provisions or from collateral held or pledged. As such, Citi believes such amounts bear no relationship to the anticipated losses, if any, on these guarantees.
|
|
|
|
|
|
|
|
|
|
|
|
|
|
|
Maximum potential amount of future payments |
In billions of dollars at December 31, 2017 |
Investment
grade
|
Non-investment
grade
|
Not
rated
|
Total |
Financial standby letters of credit |
$ |
68.1 |
|
$ |
10.9 |
|
$ |
14.8 |
|
$ |
93.8 |
|
Performance guarantees |
7.9 |
|
2.4 |
|
1.0 |
|
11.3 |
|
Derivative instruments deemed to be guarantees |
— |
|
— |
|
95.9 |
|
95.9 |
|
Loans sold with recourse |
— |
|
— |
|
0.2 |
|
0.2 |
|
Securities lending indemnifications |
— |
|
— |
|
103.7 |
|
103.7 |
|
Credit card merchant processing |
— |
|
— |
|
85.5 |
|
85.5 |
|
Credit card arrangements with partners |
— |
|
— |
|
1.4 |
|
1.4 |
|
Custody indemnifications and other |
23.7 |
|
12.3 |
|
— |
|
36.0 |
|
Total |
$ |
99.7 |
|
$ |
25.6 |
|
$ |
302.5 |
|
$ |
427.8 |
|
|
|
|
|
|
|
|
|
|
|
|
|
|
|
|
Maximum potential amount of future payments |
In billions of dollars at December 31, 2016 |
Investment
grade
|
Non-investment
grade
|
Not
rated
|
Total |
Financial standby letters of credit |
$ |
66.8 |
|
$ |
13.4 |
|
$ |
12.9 |
|
$ |
93.1 |
|
Performance guarantees |
6.3 |
|
4.0 |
|
0.8 |
|
11.1 |
|
Derivative instruments deemed to be guarantees |
— |
|
— |
|
87.2 |
|
87.2 |
|
Loans sold with recourse |
— |
|
— |
|
0.2 |
|
0.2 |
|
Securities lending indemnifications |
— |
|
— |
|
80.3 |
|
80.3 |
|
Credit card merchant processing |
— |
|
— |
|
86.4 |
|
86.4 |
|
|
Credit card arrangements with partners
|
— |
|
— |
|
1.5 |
|
1.5 |
|
Custody indemnifications and other |
33.3 |
|
12.1 |
|
— |
|
45.4 |
|
Total |
$ |
106.4 |
|
$ |
29.5 |
|
$ |
269.3 |
|
$ |
405.2 |
|
Credit Commitments and Lines of Credit
The table below summarizes Citigroup’s credit commitments:
|
|
|
|
|
|
|
|
|
|
|
|
|
|
In millions of dollars |
U.S. |
Outside of
U.S.
|
December 31,
2017 |
December 31, 2016 |
Commercial and similar letters of credit |
$ |
904 |
|
$ |
4,096 |
|
$ |
5,000 |
|
$ |
5,736 |
|
One- to four-family residential mortgages |
988 |
|
1,686 |
|
2,674 |
|
2,838 |
|
Revolving open-end loans secured by one- to four-family residential properties |
10,825 |
|
1,498 |
|
12,323 |
|
13,405 |
|
Commercial real estate, construction and land development |
9,594 |
|
1,557 |
|
11,151 |
|
10,781 |
|
Credit card lines |
578,634 |
|
99,666 |
|
678,300 |
|
664,335 |
|
Commercial and other consumer loan commitments |
171,383 |
|
101,272 |
|
272,655 |
|
259,934 |
|
Other commitments and contingencies |
2,182 |
|
889 |
|
3,071 |
|
3,202 |
|
Total |
$ |
774,510 |
|
$ |
210,664 |
|
$ |
985,174 |
|
$ |
960,231 |
|
The majority of unused commitments are contingent upon customers maintaining specific credit standards.
Commercial commitments generally have floating interest rates and fixed expiration dates and may require payment of fees. Such fees (net of certain direct costs) are deferred and, upon exercise of the commitment, amortized over the life of the loan or, if exercise is deemed remote, amortized over the commitment period.
Commercial and Similar Letters of Credit
A commercial letter of credit is an instrument by which Citigroup substitutes its credit for that of a customer to enable the customer to finance the purchase of goods or to incur other commitments. Citigroup issues a letter on behalf of its client to a supplier and agrees to pay the supplier upon presentation of documentary evidence that the supplier has performed in accordance with the terms of the letter of credit. When a letter of credit is drawn, the customer is then required to reimburse Citigroup.
One- to Four-Family Residential Mortgages
A one- to four-family residential mortgage commitment is a written confirmation from Citigroup to a seller of a property that the bank will advance the specified sums enabling the buyer to complete the purchase.
Revolving Open-End Loans Secured by One- to Four-Family Residential Properties
Revolving open-end loans secured by one- to four-family residential properties are essentially home equity lines of credit. A home equity line of credit is a loan secured by a primary residence or second home to the extent of the excess of fair market value over the debt outstanding for the first mortgage.
Commercial Real Estate, Construction and Land Development
Commercial real estate, construction and land development include unused portions of commitments to extend credit for the purpose of financing commercial and multifamily residential properties as well as land development projects.
Both secured-by-real-estate and unsecured commitments are included in this line, as well as
undistributed loan proceeds, where there is an obligation to advance for construction progress payments. However, this line only includes those extensions of credit that, once funded, will be classified as Total loans, net on the Consolidated Balance Sheet.
Credit Card Lines
Citigroup provides credit to customers by issuing credit cards. The credit card lines are cancelable by providing notice to the cardholder or without such notice as permitted by local law.
Commercial and Other Consumer Loan Commitments
Commercial and other consumer loan commitments include overdraft and liquidity facilities as well as commercial commitments to make or purchase loans, purchase third-party receivables, provide note issuance or revolving underwriting facilities and invest in the form of equity.
Other Commitments and Contingencies
Other commitments and contingencies include committed or unsettled regular-way reverse repurchase agreements and all other transactions related to commitments and contingencies not reported on the lines above.
Unsettled Reverse Repurchase and Securities Lending Agreements and Unsettled Repurchase and Securities Borrowing Agreements
In addition, in the normal course of business, Citigroup enters into reverse repurchase and securities borrowing agreements, as well as repurchase and securities lending agreements, which settle at a future date. At December 31, 2017, and December 31, 2016, Citigroup had $35.0 billion and $43.1 billion unsettled reverse repurchase and securities borrowing agreements, and $19.1 billion and $14.9 billion unsettled repurchase and securities lending agreements. For a further discussion of securities purchased under agreements to resell and securities borrowed, and securities sold under agreements to repurchase and securities loaned, including the Company’s policy for offsetting repurchase and reverse repurchase agreements, see Note 11 to the Consolidated Financial Statements.
27. CONTINGENCIES
Accounting and Disclosure Framework
ASC 450 governs the disclosure and recognition of loss contingencies, including potential losses from litigation and regulatory matters. ASC 450 defines a “loss contingency” as “an existing condition, situation, or set of circumstances involving uncertainty as to possible loss to an entity that will ultimately be resolved when one or more future events occur or fail to occur.” It imposes different requirements for the recognition and disclosure of loss contingencies based on the likelihood of occurrence of the contingent future event or events. It distinguishes among degrees of likelihood using the following three terms: “probable,” meaning that “the future event or events are likely to occur”; “remote,” meaning that “the chance of the future event or events occurring is slight”; and “reasonably possible,” meaning that “the chance of the future event or events occurring is more than remote but less than likely.” These three terms are used below as defined in ASC 450.
Accruals. ASC 450 requires accrual for a loss contingency when it is “probable that one or more future events will occur confirming the fact of loss” and “the amount of the loss can be reasonably estimated.” In accordance with ASC 450, Citigroup establishes accruals for contingencies, including the litigation and regulatory matters disclosed herein, when Citigroup believes it is probable that a loss has been incurred and the amount of the loss can be reasonably estimated. When the reasonable estimate of the loss is within a range of amounts, the minimum amount of the range is accrued, unless some higher amount within the range is a better estimate than any other amount within the range. Once established, accruals are adjusted from time to time, as appropriate, in light of additional information. The amount of loss ultimately incurred in relation to those matters may be substantially higher or lower than the amounts accrued for those matters.
Disclosure. ASC 450 requires disclosure of a loss contingency if “there is at least a reasonable possibility that a loss or an additional loss may have been incurred” and there is no accrual for the loss because the conditions described above are not met or an exposure to loss exists in excess of the amount accrued. In accordance with ASC 450, if Citigroup has not accrued for a matter because Citigroup believes that a loss is reasonably possible but not probable, or that a loss is probable but not reasonably estimable, and the reasonably possible loss is material, it discloses the loss contingency. In addition, Citigroup discloses matters for which it has accrued if it believes a reasonably possible exposure to material loss exists in excess of the amount accrued. In accordance with ASC 450, Citigroup’s disclosure includes an estimate of the reasonably possible loss or range of loss for those matters as to which an estimate can be made. ASC 450 does not require disclosure of an estimate of the reasonably possible loss or range of loss where an estimate cannot be made. Neither accrual nor disclosure is required for losses that are deemed remote.
Litigation and Regulatory Contingencies
Overview. In addition to the matters described below, in the ordinary course of business, Citigroup, its affiliates and subsidiaries, and current and former officers, directors and employees (for purposes of this section, sometimes collectively referred to as Citigroup and Related Parties) routinely are named as defendants in, or as parties to, various legal actions and proceedings. Certain of these actions and proceedings assert claims or seek relief in connection with alleged violations of consumer protection, fair lending, securities, banking, antifraud, antitrust, anti-money laundering, employment and other statutory and common laws. Certain of these actual or threatened legal actions and proceedings include claims for substantial or indeterminate compensatory or punitive damages, or for injunctive relief, and in some instances seek recovery on a class-wide basis.
In the ordinary course of business, Citigroup and Related Parties also are subject to governmental and regulatory examinations, information-gathering requests, investigations and proceedings (both formal and informal), certain of which may result in adverse judgments, settlements, fines, penalties, restitution, disgorgement, injunctions or other relief. In addition, certain affiliates and subsidiaries of Citigroup are banks, registered broker-dealers, futures commission merchants, investment advisers or other regulated entities and, in those capacities, are subject to regulation by various U.S., state and foreign securities, banking, commodity futures, consumer protection and other regulators. In connection with formal and informal inquiries by these regulators, Citigroup and such affiliates and subsidiaries receive numerous requests, subpoenas and orders seeking documents, testimony and other information in connection with various aspects of their regulated activities. From time to time Citigroup and Related Parties also receive grand jury subpoenas and other requests for information or assistance, formal or informal, from federal or state law enforcement agencies including, among others, various United States Attorneys’ Offices, the Asset Forfeiture and Money Laundering Section and other divisions of the Department of Justice, the Financial Crimes Enforcement Network of the United States Department of the Treasury, and the Federal Bureau of Investigation relating to Citigroup and its customers.
Because of the global scope of Citigroup’s operations, and its presence in countries around the world, Citigroup and Related Parties are subject to litigation and governmental and regulatory examinations, information-gathering requests, investigations and proceedings (both formal and informal) in multiple jurisdictions with legal and regulatory regimes that may differ substantially, and present substantially different risks, from those Citigroup and Related Parties are subject to in the United States. In some instances, Citigroup and Related Parties may be involved in proceedings involving the same subject matter in multiple jurisdictions, which may result in overlapping, cumulative or inconsistent outcomes.
Citigroup seeks to resolve all litigation and regulatory matters in the manner management believes is in the best interests of Citigroup and its shareholders, and contests liability, allegations of wrongdoing and, where applicable, the
amount of damages or scope of any penalties or other relief sought as appropriate in each pending matter.
Inherent Uncertainty of the Matters Disclosed. Certain of the matters disclosed below involve claims for substantial or indeterminate damages. The claims asserted in these matters typically are broad, often spanning a multi-year period and sometimes a wide range of business activities, and the plaintiffs’ or claimants’ alleged damages frequently are not quantified or factually supported in the complaint or statement of claim. Other matters relate to regulatory investigations or proceedings, as to which there may be no objective basis for quantifying the range of potential fine, penalty or other remedy. As a result, Citigroup is often unable to estimate the loss in such matters, even if it believes that a loss is probable or reasonably possible, until developments in the case or investigation have yielded additional information sufficient to support a quantitative assessment of the range of reasonably possible loss. Such developments may include, among other things, discovery from adverse parties or third parties, rulings by the court on key issues, analysis by retained experts and engagement in settlement negotiations. Depending on a range of factors, such as the complexity of the facts, the novelty of the legal theories, the pace of discovery, the court’s scheduling order, the timing of court decisions and the adverse party’s willingness to negotiate in good faith toward a resolution, it may be months or years after the filing of a case or commencement of an investigation before an estimate of the range of reasonably possible loss can be made.
Matters as to Which an Estimate Can Be Made. For some of the matters disclosed below, Citigroup is currently able to estimate a reasonably possible loss or range of loss in excess of amounts accrued (if any). For some of the matters included within this estimation, an accrual has been made because a loss is believed to be both probable and reasonably estimable, but an exposure to loss exists in excess of the amount accrued. In these cases, the estimate reflects the reasonably possible range of loss in excess of the accrued amount. For other matters included within this estimation, no accrual has been made because a loss, although estimable, is believed to be reasonably possible, but not probable; in these cases, the estimate reflects the reasonably possible loss or range of loss. As of December 31, 2017, Citigroup estimates that the reasonably possible unaccrued loss for these matters ranges up to approximately $1.0 billion in the aggregate.
These estimates are based on currently available information. As available information changes, the matters for which Citigroup is able to estimate will change, and the estimates themselves will change. In addition, while many estimates presented in financial statements and other financial disclosures involve significant judgment and may be subject to significant uncertainty, estimates of the range of reasonably possible loss arising from litigation and regulatory proceedings are subject to particular uncertainties. For example, at the time of making an estimate, (i) Citigroup may have only preliminary, incomplete, or inaccurate information about the facts underlying the claim, (ii) its assumptions about the future rulings of the court or other tribunal on significant issues, or the behavior and incentives of adverse parties or regulators, may prove to be wrong and (iii) the outcomes it is
attempting to predict are often not amenable to the use of statistical or other quantitative analytical tools. In addition, from time to time an outcome may occur that Citigroup had not accounted for in its estimate because it had deemed such an outcome to be remote. For all of these reasons, the amount of loss in excess of accruals ultimately incurred for the matters as to which an estimate has been made could be substantially higher or lower than the range of loss included in the estimate.
Matters as to Which an Estimate Cannot Be Made. For other matters disclosed below, Citigroup is not currently able to estimate the reasonably possible loss or range of loss. Many of these matters remain in very preliminary stages (even in some cases where a substantial period of time has passed since the commencement of the matter), with few or no substantive legal decisions by the court or tribunal defining the scope of the claims, the class (if any) or the potentially available damages, and fact discovery is still in progress or has not yet begun. In many of these matters, Citigroup has not yet answered the complaint or statement of claim or asserted its defenses, nor has it engaged in any negotiations with the adverse party (whether a regulator or a private party). For all these reasons, Citigroup cannot at this time estimate the reasonably possible loss or range of loss, if any, for these matters.
Opinion of Management as to Eventual Outcome. Subject to the foregoing, it is the opinion of Citigroup’s management, based on current knowledge and after taking into account its current legal accruals, that the eventual outcome of all matters described in this Note would not be likely to have a material adverse effect on the consolidated financial condition of Citigroup. Nonetheless, given the substantial or indeterminate amounts sought in certain of these matters, and the inherent unpredictability of such matters, an adverse outcome in certain of these matters could, from time to time, have a material adverse effect on Citigroup’s consolidated results of operations or cash flows in particular quarterly or annual periods.
CARD Act Matter
Citi identified certain methodological issues in connection with determining annual percentage rates (APRs) for certain cardholders under the rate re-evaluation provisions of the Credit Card Accountability Responsibility and Disclosure Act (CARD Act) and Regulation Z. Citi self-reported the issues to its regulators and will be providing remediation to affected customers. Citi is cooperating fully with the regulatory reviews.
Credit Crisis-Related Litigation and Other Matters
Citigroup and Related Parties were named as defendants in numerous legal actions and other proceedings asserting claims for damages and related relief for losses arising from the global financial credit crisis that began in 2007. Citigroup also received subpoenas and requests for information from various regulatory agencies and other government authorities concerning certain businesses impacted by the credit crisis. The vast majority of these matters have been resolved as of December 31, 2017.
Mortgage-Related Litigation and Other Matters
Mortgage-Backed Securities and CDO Investor Actions: Beginning in July 2010, Citigroup and Related Parties were named as defendants in complaints filed by purchasers of MBS and CDOs sold or underwritten by Citigroup. The complaints generally assert that defendants made material misrepresentations and omissions about the credit quality of the assets underlying the securities or the manner in which those assets were selected, and typically assert claims under Section 11 of the Securities Act of 1933, state blue sky laws, and/or common-law misrepresentation-based causes of action.
All but one of these matters have been resolved through settlement or otherwise. As of December 31, 2017, the aggregate original purchase amount of the purchases covered by the remaining tolling (extension) agreement with an investor threatening litigation is approximately $500 million.
Mortgage-Backed Securities Repurchase Claims: Various parties to MBS securitizations and other interested parties have asserted that certain Citigroup affiliates breached representations and warranties made in connection with mortgage loans sold into securitization trusts (private-label securitizations). Typically, these claims are based on allegations that securitized mortgages were not underwritten in accordance with the applicable underwriting standards. Citigroup also has received inquiries, demands for loan files, and requests to toll the applicable statutes of limitation for representation and warranty claims, relating to its private-label securitizations. These inquiries, demands and requests have been made by trustees of securitization trusts and others.
To date, trustees have filed six actions against Citigroup seeking to enforce certain of these contractual repurchase claims that were excluded from the April 7, 2014 settlement in connection with four private-label securitizations. Citigroup has reached an agreement with the trustees to resolve all six of these actions. Additional information concerning these actions is publicly available in court filings under the docket numbers 13 Civ. 2843 (S.D.N.Y.) (Daniels, J.), 13 Civ. 6989 (S.D.N.Y.) (Daniels, J.), 653816/2013 (N.Y. Sup. Ct.) (Kornreich, J.), 653919/2014 (N.Y. Sup. Ct.), 653929/2014 (N.Y. Sup. Ct.), and 653930/2014 (N.Y. Sup. Ct.).
Mortgage-Backed Securities Trustee Actions: On November 24, 2014, a group of investors in 27 RMBS trusts for which Citibank served or currently serves as trustee filed an action in the United States District Court for the Southern District of New York, captioned FIXED INCOME SHARES: SERIES M ET AL. v. CITIBANK N.A., alleging claims that Citibank failed to pursue contractual remedies against securitization sponsors and servicers. On September 8, 2015, the United States District Court for the Southern District of New York dismissed all claims as to 24 of the 27 trusts and allowed certain of the claims to proceed as to the other three trusts. On September 7, 2016, plaintiffs filed a stipulation of voluntary dismissal of their claims with respect to two of the three remaining trusts, leaving one trust at issue. On September 30, 2016, plaintiffs moved to certify a class action, and on April 7, 2017, Citibank moved for summary judgment on all remaining claims. Both motions are pending. Additional information concerning this action is publicly available in
court filings under the docket number 14-cv-9373 (S.D.N.Y.) (Furman, J.).
On November 24, 2015, largely the same group of investors filed an action in the New York State Supreme Court, captioned FIXED INCOME SHARES: SERIES M, ET AL. v. CITIBANK N.A., related to the 24 trusts dismissed from the federal court action and one additional trust, asserting claims similar to the action filed in federal court. On June 22, 2016, the court dismissed plaintiffs’ complaint. Plaintiffs filed an amended complaint on August 5, 2016. On June 27, 2017, the court granted in part and denied in part Citibank’s motion to dismiss the amended complaint. Citibank appealed as to the sustained claims, and on January 16, 2018, the New York Appellate Division, First Department, dismissed all of the remaining claims except the claim for breach of contract related to purported discovery of alleged underwriter breaches of representations and warranties. Additional information concerning this action is publicly available in court filings under the docket number 653891/2015 (N.Y. Sup. Ct.) (Ramos, J.).
On August 19, 2015, the Federal Deposit Insurance Corporation (FDIC), as receiver for a financial institution, filed a civil action against Citibank in the United States District Court for the Southern District of New York, captioned FEDERAL DEPOSIT INSURANCE CORPORATION AS RECEIVER FOR GUARANTY BANK v. CITIBANK N.A. The complaint concerns one RMBS trust for which Citibank formerly served as trustee, and alleges that Citibank failed to pursue contractual remedies against the sponsor and servicers of that trust. On September 30, 2016, the court granted Citibank’s motion to dismiss on the grounds that the FDIC lacked standing to pursue its claims. On October 14, 2016, the FDIC filed a motion for reconsideration or relief from judgment from the court’s dismissal order. On July 10, 2017, the court denied the motion for reconsideration but granted the FDIC leave to file an amended complaint. The FDIC filed an amended complaint on December 8, 2017. Additional information concerning this action is publicly available in court filings under the docket number 15-cv-6574 (S.D.N.Y.) (Carter, J.).
Lehman Brothers Bankruptcy Proceedings
On February 8, 2012, Citibank and certain Citigroup affiliates were named as defendants in an adversary proceeding asserting objections to certain proofs of claim totaling approximately $2.6 billion filed by Citibank and those affiliates, and claims under federal bankruptcy and state law to recover $2 billion deposited by Lehman Brothers Holdings Inc. (LBHI) with Citibank against which Citibank asserted a right of setoff. A global settlement between the parties was approved by the bankruptcy court on October 13, 2017. As part of the global settlement, Citibank retained $350 million from LBHI’s deposit at Citibank and returned to LBHI and its affiliates the remaining deposited funds, and LBHI withdrew its remaining objections to the bankruptcy claims filed by Citibank and its affiliates. This action was dismissed by stipulation on November 3, 2017. Additional information concerning this action is publicly available in court filings
under the docket numbers 12-01044 and 08-13555 (Bankr. S.D.N.Y.) (Chapman, J.).
Tribune Company Bankruptcy
Certain Citigroup affiliates have been named as defendants in adversary proceedings related to the Chapter 11 cases of Tribune Company (Tribune) filed in the United States Bankruptcy Court for the District of Delaware, asserting claims arising out of the approximately $11 billion leveraged buyout of Tribune in 2007. On August 2, 2013, the Litigation Trustee, as successor plaintiff to the Official Committee of Unsecured Creditors, filed a fifth amended complaint in the adversary proceeding KIRSCHNER v. FITZSIMONS, ET AL. The complaint seeks to avoid and recover as actual fraudulent transfers the transfers of Tribune stock that occurred as a part of the leveraged buyout. Several Citigroup affiliates are named as “Shareholder Defendants” and are alleged to have tendered Tribune stock to Tribune as a part of the buyout.
Several Citigroup affiliates are named as defendants in certain actions brought by Tribune noteholders, which seek to recover the transfers of Tribune stock that occurred as a part of the leveraged buyout, as state-law constructive fraudulent conveyances. The noteholders’ claims were previously dismissed and the United States Court of Appeals for the Second Circuit affirmed the dismissal on appeal. The noteholders’ petition to the United States Supreme Court for a writ of certiorari is pending.
In the FITZSIMONS action, on February 1, 2017, the Litigation Trustee requested leave to file an interlocutory appeal of Judge Sullivan’s order dismissing the actual fraudulent transfer claim against the shareholder defendants, including several Citigroup affiliates. On February 23, 2017, Judge Sullivan entered an order stating that an interlocutory appeal will be certified after the remaining motions to dismiss are resolved. Those motions remain pending. Additional information concerning these actions is publicly available in court filings under the docket numbers 08-13141 (Bankr. D. Del.) (Carey, J.), 11 MD 02296 (S.D.N.Y.) (Sullivan, J.), 12 MC 2296 (S.D.N.Y.) (Sullivan, J.), 13-3992, 13-3875, 13-4196 (2d Cir.) and 16-317 (U.S.).
Credit Default Swaps Matters
Antitrust and Other Litigation: On June 8, 2017, a complaint was filed in the United States District Court for the Southern District of New York against numerous credit default swap (CDS) market participants, including Citigroup, Citibank, Citigroup Global Markets Inc. (CGMI), and Citigroup Global Markets Ltd. (CGML), under the caption TERA GROUP, INC., ET AL. v. CITIGROUP INC., ET AL. The complaint alleges that defendants colluded to prevent plaintiffs’ electronic CDS trading platform, TeraExchange, from entering the market, resulting in lost profits to plaintiffs. The complaint asserts federal and state antitrust claims, and claims for unjust enrichment and tortious interference with business relations. Plaintiffs seek a finding of joint and several liability, treble damages, attorneys’ fees, interest, and injunctive relief. On September 11, 2017, defendants, including Citigroup, Citibank, CGMI, and CGML, filed motions to dismiss all claims. Additional information concerning this action is
publicly available in court filings under the docket number 17-cv-04302 (S.D.N.Y.) (Sullivan, J.).
Depositary Receipts Conversion Litigation
Citibank was sued by a purported class of persons or entities who, from January 2000 to the present, are or were holders of depositary receipts for which Citibank served as the depositary bank and converted, or caused to be converted, foreign-currency dividends or other distributions into U.S. dollars. On August 15, 2016, the court dismissed certain claims against Citibank as well as all claims against two of its affiliates, leaving one claim against Citibank. Plaintiffs assert that Citibank breached its deposit agreements by charging a spread for the conversions of dividends and other distributions. On June 30, 2017, plaintiffs moved for certification of a damages class consisting of persons or entities who, from January 1, 2006 to the present, were holders of 35 depositary receipts for which Citibank served as the depositary bank and converted, or caused to be converted, foreign currency dividends or other distributions into U.S. dollars. Plaintiffs also moved to certify an injunctive class of persons or entities who currently hold the same 35 depositary receipts. Citibank has opposed certification. Additional information concerning this action is publicly available in court filings under the docket number 15 Civ. 9185 (S.D.N.Y.) (McMahon, C.).
Foreign Exchange Matters
Regulatory Actions: Government and regulatory agencies in the U.S. and in other jurisdictions are conducting investigations or making inquiries regarding Citigroup’s foreign exchange business. Citigroup is fully cooperating with these and related investigations and inquiries.
Antitrust and Other Litigation: Numerous foreign exchange dealers, including Citigroup, Citicorp, CGMI, and Citibank, are named as defendants in putative class actions that are proceeding on a consolidated basis in the United States District Court for the Southern District of New York under the caption IN RE FOREIGN EXCHANGE BENCHMARK RATES ANTITRUST LITIGATION. Plaintiffs allege that they suffered losses as a result of defendants’ alleged manipulation of, and collusion with respect to, the foreign exchange market. Plaintiffs allege violations of the Commodity Exchange Act, the Sherman Act, and/or the Clayton Act, and seek compensatory damages, treble damages, and declaratory and injunctive relief.
On December 15, 2015, the court entered an order preliminarily approving a proposed settlement between the Citi defendants and classes of plaintiffs who traded foreign exchange instruments in the spot market and on exchanges. The proposed settlement provides for the Citi defendants to receive a release in exchange for a payment of approximately $400 million. On January 12, 2018, plaintiffs moved for final approval of the settlements with the Citi defendants and several other defendants in that case. Additional information concerning this action is available in court filings under the consolidated lead docket number 13 Civ. 7789 (S.D.N.Y.) (Schofield, J.).
On May 21, 2015, an action captioned NYPL v.
JPMORGAN CHASE & CO., ET AL. was brought in the United States District Court for the Northern District of California against Citigroup, as well as numerous other foreign exchange dealers for possible consolidation with IN RE FOREIGN EXCHANGE BENCHMARK RATES ANTITRUST LITIGATION. On August 10, 2017, plaintiffs filed a third amended class action complaint in the United States District Court for the Southern District of New York naming Citibank, Citigroup, and Citicorp as defendants. Plaintiffs seek to represent a putative class of “consumers and businesses in the United States who directly purchased supracompetitive foreign currency at Benchmark exchange rates” from defendants. Plaintiffs allege claims under federal and California antitrust and consumer protection laws, and are seeking compensatory damages, treble damages, and declaratory and injunctive relief. On October 16, 2017, defendants completed briefing on their renewed motion to dismiss or to certify the court’s ruling for interlocutory appeal. Additional information concerning this action is publicly available in court filings under the docket numbers 15 Civ. 2290 (N.D. Cal.) (Chhabria, J.) and 15 Civ. 9300 (S.D.N.Y.) (Schofield, J.).
On June 3, 2015, an action captioned ALLEN v. BANK OF AMERICA CORPORATION, ET AL. was brought in the United States District Court for the Southern District of New York against Citigroup and Citibank, as well as numerous other foreign exchange dealers. Plaintiffs seek to represent a putative class of participants, beneficiaries, and named fiduciaries of qualified Employee Retirement Income Security Act (ERISA) plans for whom a defendant provided foreign exchange transactional services or authorized or permitted foreign exchange transactional services involving a plan’s assets in connection with its exercise of authority or control regarding an ERISA plan. Plaintiffs allege violations of ERISA, and seek compensatory damages, restitution, disgorgement, and declaratory and injunctive relief. On September 20, 2016, plaintiffs and settling defendants in IN RE FOREIGN EXCHANGE BENCHMARK RATES ANTITRUST LITIGATION filed a joint stipulation dismissing plaintiffs’ claims with prejudice. The case is currently on appeal to the United States Court of Appeals for the Second Circuit, where briefing and argument are complete. Additional information concerning this action is publicly available in court filings under the docket numbers 13 Civ. 7789 (S.D.N.Y.) (Schofield, J.), 15 Civ. 4285 (S.D.N.Y.) (Schofield, J.), 16-3327 (2d Cir.), and 16-3571 (2d Cir.).
On June 30, 2017, plaintiffs filed a consolidated amended complaint on behalf of purported classes of indirect purchasers of foreign exchange instruments sold by the defendants, naming various financial institutions, including Citigroup, Citibank, Citicorp and CGMI as defendants, captioned CONTANT ET AL. v. BANK OF AMERICA CORPORATION ET AL. Plaintiffs allege that defendants engaged in a conspiracy to fix currency prices in violation of the Sherman Act and various state antitrust laws, and seek unspecified money damages (including treble damages), as well as equitable and injunctive relief. Additional information concerning these actions is publicly available in court filings under the docket numbers 16 Civ. 7512 (S.D.N.Y.) (Schofield,
J.), 17 Civ. 4392 (S.D.N.Y.) (Schofield, J.), and 17 Civ. 3139 (S.D.N.Y.) (Schofield, J.).
Interbank Offered Rates-Related Litigation and Other Matters
Regulatory Actions: A consortium of state attorneys general is conducting an investigation regarding submissions made by panel banks to bodies that publish various interbank offered rates and other benchmark rates. As a member of a number of such panels, Citigroup has received requests for information and documents. Citigroup is cooperating with the investigation and is responding to the requests.
Antitrust and Other Litigation: Citigroup and Citibank, along with other U.S. Dollar (USD) LIBOR panel banks, are defendants in a multi-district litigation (MDL) proceeding before the United States District Court for the Southern District of New York captioned IN RE LIBOR-BASED FINANCIAL INSTRUMENTS ANTITRUST LITIGATION (the LIBOR MDL). On July 27, 2017, Citigroup and Citibank executed a settlement with one class (investors who transacted in Eurodollar futures or options on exchanges), pursuant to which the Citi defendants agreed to pay $33.4 million. On October 6, 2017, Citigroup and Citibank agreed to pay $130 million pursuant to its settlement with the largest plaintiffs’ class (investors who purchased over-the-counter (OTC) derivatives from USD LIBOR panel banks) in IN RE LIBOR-BASED FINANCIAL INSTRUMENTS ANTITRUST LITIGATION.
On January 10, 2018, Citigroup and Citibank executed a settlement agreement with another class (lending institutions with interests in loans tied to USD LIBOR) pursuant to which the Citi defendants will pay $23 million. Additional information concerning these actions and related actions and appeals is publicly available in court filings under the docket numbers 11 MD 2262 (S.D.N.Y.) (Buchwald, J.) and 17-1569 (2d Cir.).
On August 13, 2015, plaintiffs in the class action SULLIVAN v. BARCLAYS PLC, ET AL., pending in the United States District Court for the Southern District of New York, filed a fourth amended complaint naming Citigroup and Citibank as defendants. Plaintiffs claim to have suffered losses as a result of purported EURIBOR manipulation and assert claims under the Commodity Exchange Act, the Sherman Act and the federal civil Racketeer Influenced and Corrupt Organizations (RICO) Act and for unjust enrichment. On February 21, 2017, the court granted in part and denied in part defendants’ motion to dismiss. Additional information concerning this action is publicly available in court filings under the docket number 13 Civ. 2811 (S.D.N.Y.) (Castel, J.).
On July 1, 2016, a putative class action captioned FRONTPOINT ASIAN EVENT DRIVEN FUND, LTD. ET AL v. CITIBANK, N.A. ET AL. was filed in the United States District Court for the Southern District of New York against Citibank, Citigroup and various other banks. Plaintiffs assert claims for violation of the Sherman Act, Clayton Act and RICO Act, as well as state law claims for alleged manipulation of the Singapore Interbank Offered Rate and Singapore Swap Offer Rate. On August 18, 2017, the court granted in part the defendants’ motion to dismiss, dismissing all claims against
foreign bank defendants, antitrust claims asserted by one of the two named plaintiffs, and all RICO, implied covenant, and unjust enrichment claims. The court allowed one antitrust claim to proceed against the U.S. bank defendants, including Citigroup and Citibank. Plaintiffs filed an amended complaint on September 18, 2017. On October 18, 2017, defendants filed a motion to dismiss the amended complaint. Additional information concerning this action is publicly available in court filings under the docket number 16 Civ. 5263 (S.D.N.Y.) (Hellerstein, J.).
On December 26, 2016, Banque Delubac filed a summons against Citigroup, CGML, and Citigroup Europe Plc before the Commercial Court of Aubenas, France alleging that defendants suppressed its LIBOR submissions between 2005 and 2012, and that Banque Delubac’s EURIBOR-linked lending activity was negatively impacted as a result. Plaintiff is seeking compensatory damages for losses on LIBOR-linked loans to customers and for alleged consequential losses to its business. Additional information concerning this action is publicly available in court filings under the case reference SCS BANQUE DELUBAC & CIE v. CITIGROUP INC. ET AL., Commercial Court of Aubenas, RG no. 2017J00043.
Interchange Fee Litigation
Beginning in 2005, several putative class actions were filed against Citigroup and Related Parties, together with Visa, MasterCard and other banks and their affiliates, in various federal district courts and consolidated with other related individual cases in a multi-district litigation proceeding in the United States District Court for the Eastern District of New York (Interchange MDL). This proceeding is captioned IN RE PAYMENT CARD INTERCHANGE FEE AND MERCHANT DISCOUNT ANTITRUST LITIGATION.
The plaintiffs, merchants that accept Visa and MasterCard branded payment cards as well as membership associations that claim to represent certain groups of merchants, allege, among other things, that defendants have engaged in conspiracies to set the price of interchange and merchant discount fees on credit and debit card transactions and to restrain trade through various Visa and MasterCard rules governing merchant conduct, all in violation of Section 1 of the Sherman Act and certain California statutes. Supplemental complaints also have been filed against defendants in the putative class actions alleging that Visa’s and MasterCard’s respective initial public offerings were anticompetitive and violated Section 7 of the Clayton Act, and that MasterCard’s initial public offering constituted a fraudulent conveyance.
On January 14, 2014, the district court entered a final judgment approving the terms of a class settlement providing for, among other things, a total payment to the class of $6.05 billion; a rebate to merchants participating in the damages class settlement of 10 bps on interchange collected for a period of eight months by the Visa and MasterCard networks; and changes to certain network rules. Various objectors appealed from the final class settlement approval order to the United States Court of Appeals for the Second Circuit.
On June 30, 2016, the Court of Appeals reversed the district court’s approval of the class settlement and remanded for further proceedings. Additional information concerning
these consolidated actions and the appeal is publicly available in court filings under the docket numbers MDL 05-1720 (E.D.N.Y.) (Brodie, J.), 12-4671 (2d Cir.) and 16-710 (U.S. Supreme Court).
In addition, following the district court’s approval of the class settlement, and during the pendency of appeals from that approval, numerous merchants, including large national merchants, requested exclusion from the portion of the now vacated settlement involving a settlement class certified with respect to damages claims for past conduct, and some of those opting out filed complaints against Visa, MasterCard, and in some instances one or more issuing banks. One of these suits, 7-ELEVEN, INC., ET AL. v. VISA INC., ET AL., brought on behalf of numerous individual merchants, names Citigroup as a defendant. Additional information concerning these actions is publicly available in court filings under the docket number MDL 05-1720 (E.D.N.Y.) (Brodie, J.).
Interest Rate Swaps Matters
Regulatory Actions: The Commodity Futures Trading Commission is conducting an investigation into the trading and clearing of interest rate swaps by investment banks. Citigroup is cooperating with the investigation.
Antitrust and Other Litigation: Beginning in November 2015, numerous interest rate swap (IRS) market participants, including Citigroup, Citibank, CGMI and CGML, were named as defendants in a number of industry-wide putative class actions. These actions have been consolidated in the United States District Court for the Southern District of New York under the caption IN RE INTEREST RATE SWAPS ANTITRUST LITIGATION. Plaintiffs in these actions allege that defendants colluded to prevent the development of exchange-like trading for IRS, thereby causing the putative classes to suffer losses in connection with their IRS transactions. Plaintiffs assert federal antitrust claims and claims for unjust enrichment. Also consolidated under the same caption are two individual actions filed by swap execution facilities, asserting federal and state antitrust claims as well as claims for unjust enrichment and tortious interference with business relations. Plaintiffs in all of these actions seek treble damages, fees, costs and injunctive relief.
On July 28, 2017, the district court granted in part and denied in part defendants’ motions to dismiss. Additional information concerning these actions is publicly available in court filings under the docket number 16-MD-2704 (S.D.N.Y.) (Engelmayer, J.).
Money Laundering Inquiries
Regulatory Actions: Citibank has received subpoenas from the United States Attorney for the Eastern District of New York in connection with its investigation of alleged bribery, corruption and money laundering associated with the Fédération Internationale de Football Association (FIFA), and the potential involvement of financial institutions in that activity. The subpoenas request information relating to, among other things, banking relationships and transactions at Citibank and its affiliates associated with certain individuals and entities identified as having had involvement with the alleged corrupt conduct. Citi is cooperating with the authorities in this matter.
Oceanografía Fraud and Related Matters
Regulatory Actions: As a result of Citigroup’s announcement in the first quarter of 2014 of a fraud discovered in a Petróleos Mexicanos (Pemex) supplier program involving Oceanografía S.A. de C.V. (OSA), a Mexican oil services company and a key supplier to Pemex, the SEC commenced a formal investigation and the U.S. Department of Justice requested information regarding Banamex’s dealings with OSA. The SEC inquiry has included requests for documents and witness testimony. Citi continues to cooperate fully with these inquiries.
Other Litigation: On February 26, 2016, a complaint was filed against Citigroup in the United States District Court for the Southern District of Florida alleging that it conspired with Oceanografía, S.A. de C.V. (OSA) and others with respect to receivable financings and other financing arrangements related to OSA in a manner that injured bondholders and other creditors of OSA. The complaint asserts claims on behalf of 39 plaintiffs that are characterized in the complaint variously as trade creditors of, investors in, or lenders to OSA. Plaintiffs collectively claim to have lost $1.1 billion as a result of OSA’s bankruptcy. The complaint asserts claims under the federal civil RICO law and seeks treble damages and other relief pursuant to that statute. The complaint also asserts claims for fraud and breach of fiduciary duty.
On August 23, 2016, plaintiffs filed an amended complaint adding common law claims for fraud, aiding and abetting fraud, and conspiracy on behalf of all plaintiffs. Citigroup has moved to dismiss the amended complaint. On January 30, 2018, the court granted Citigroup’s motion to dismiss. Additional information concerning this action is publicly available in court filings under the docket number 16-20725 (S.D. Fla.) (Gayles, J.).
On February 27, 2017, a complaint was filed against Citigroup in the United States District Court for the Southern District of New York by Oceanografía S.A. de C.V. (OSA) and its controlling shareholder, Amado Yáñez Osuna. The complaint alleges that plaintiffs were injured when Citigroup made certain public statements about receivable financings and other financing arrangements related to OSA. The complaint asserts claims for malicious prosecution and tortious interference with existing and prospective business relationships. On December 4, 2017, plaintiffs filed an amended complaint adding CGMI, Citibank and Banco Nacional de México, or Banamex, as defendants and adding causes of action for fraud and breach of contract. Citigroup has moved to dismiss the amended complaint. Additional information concerning this action is publicly available in court filings under the docket number 1:17-cv-01434 (S.D.N.Y.) (Sullivan, J.).
Parmalat Litigation
On July 29, 2004, Dr. Enrico Bondi, the Extraordinary Commissioner appointed under Italian law to oversee the administration of various Parmalat companies, filed a complaint in New Jersey state court against Citigroup and Related Parties alleging, among other things, that the defendants “facilitated” a number of frauds by Parmalat
insiders. On October 20, 2008, following trial, a jury rendered a verdict in Citigroup’s favor on Parmalat’s claims and in favor of Citibank on three counterclaims, awarding Citi $431 million. Parmalat has exhausted all appeals, and the judgment is now final. Additional information concerning this action is publicly available in court filings under the docket number A-2654-08T2 (N.J. Sup. Ct.). Citigroup has taken steps to enforce that judgment in the Italian courts. On August 29, 2014, the Court of Appeal of Bologna affirmed the decision in the full amount of $431 million, to be paid in Parmalat shares. Parmalat appealed the judgment to the Italian Supreme Court.
On June 16, 2015, Parmalat filed a claim in an Italian civil court in Milan claiming damages of €1.8 billion against Citigroup and Related Parties. On January 25, 2018, the Milan court dismissed Parmalat’s claim on grounds that it was duplicative of Parmalat’s previously unsuccessful New Jersey claims.
Referral Hiring Practices Investigations
Government and regulatory agencies in the U.S., including the SEC, are conducting investigations or making inquiries concerning compliance with the Foreign Corrupt Practices Act and other laws with respect to the hiring of candidates referred by or related to foreign government officials. Citigroup is cooperating with the investigations and inquiries.
Shareholder Derivative Litigation
On March 30, 2016, a derivative action captioned OKLAHOMA FIREFIGHTERS PENSION & RETIREMENT SYSTEM, ET AL. v. CORBAT, ET AL. was filed in the Delaware Chancery Court on behalf of Citigroup (as nominal defendant) against certain of Citigroup’s present and former directors and officers. Plaintiffs assert claims for breach of fiduciary duty and waste of corporate assets in connection with defendants’ alleged failure to exercise appropriate oversight and management of Bank Secrecy Act and anti-money laundering laws and regulations and related consent decrees concerning Citigroup subsidiaries, Banamex and Banamex USA (BUSA) as well as defendants’ alleged failures to implement adequate internal controls and exercise adequate oversight with respect to Citigroup subsidiaries’ participation in foreign exchange markets and credit card practices. On December 18, 2017, the court granted the defendants’ motion to dismiss plaintiffs’ amended supplemental complaint. On January 17, 2018, plaintiffs filed a motion to reopen the judgment and for leave to file a second amended complaint in the Delaware Chancery Court, as well as an appeal with the Delaware Supreme Court. Additional information concerning this action is publicly available in court filings under the docket numbers C.A. No. 12151-VCG (Del. Ch.) (Glasscock, Ch.) and 32,2018 (Del.).
Sovereign Securities Matters
Regulatory Actions: Government and regulatory agencies in the U.S. and in other jurisdictions are conducting investigations or making inquiries regarding Citigroup’s sales and trading activities in connection with sovereign securities. Citigroup is fully cooperating with these investigations and inquiries.
Antitrust and Other Litigation: Beginning in July 2015, CGMI and numerous other U.S. Treasury primary dealer banks were named as defendants in a number of substantially similar putative class actions involving allegations that they colluded to manipulate U.S. Treasury securities markets. In December 2015, the cases were consolidated in the United States District Court for the Southern District of New York by the Judicial Panel on Multidistrict Litigation. On August 23, 2017, the court appointed interim co-lead counsel.
Plaintiffs filed a consolidated complaint on November 16, 2017, which alleges that CGMI and other primary dealer defendants colluded to fix Treasury auction bids by sharing competitively sensitive information ahead of the auctions, in violation of the antitrust laws. The consolidated complaint also alleges that CGMI and other primary dealer defendants colluded to boycott and prevent the emergence of an anonymous, all-to-all electronic trading platform in the Treasuries secondary market, and seeks damages, including treble damages where authorized by statute, and injunctive relief. Additional information relating to this action is publicly available in court filings under the docket number 15-MD-2673 (S.D.N.Y.) (Gardephe, J.).
Beginning in May 2016, a number of substantially similar putative class action complaints were filed against a number of financial institutions and traders related to the supranational, sub-sovereign, and agency (SSA) bond market. The actions are based upon defendants’ roles as market makers and traders of SSA bonds and assert claims of alleged collusion under the antitrust laws and unjust enrichment and seek damages, including treble damages where authorized by statute, and disgorgement. In August 2016, these actions were consolidated in the United States District Court for the Southern District of New York, and interim co-lead counsel was appointed in December 2016.
Plaintiffs filed a consolidated complaint on April 7, 2017 that names Citigroup, Citibank, CGMI and CGML among the defendants. Plaintiffs filed an amended consolidated complaint on October 6, 2017, and defendants filed motions to dismiss on December 12, 2017. Additional information relating to this action is publicly available in court filings under the docket number 16-cv-03711 (S.D.N.Y.) (Ramos, J.).
On November 7, 2017, a class action related to the SSA bond market was filed in the Ontario Court of Justice against Citigroup, Citibank, CGMI, CGML, Citibank Canada and Citigroup Global Markets Canada, Inc., among other defendants, asserting claims for breach of contract, breach of the competition act, breach of foreign law, unjust enrichment, and civil conspiracy. Plaintiffs seek compensatory and punitive damages, as well as declaratory relief. Additional information relating to this action is publicly available in court filings under the docket number CV-17-586082-00CP (Ont. S.C.J.).
Settlement Payments
Payments required in settlement agreements described above have been made or are covered by existing litigation accruals.
28. CONDENSED CONSOLIDATING FINANCIAL STATEMENTS
Citigroup amended its Registration Statement on Form S-3 on file with the SEC (File No. 33-192302) to add its wholly owned subsidiary, Citigroup Global Markets Holdings Inc. (CGMHI), as a co-registrant. Any securities issued by CGMHI under the Form S-3 will be fully and unconditionally guaranteed by Citigroup.
The following are the Condensed Consolidating Statements of Income and Comprehensive Income for the years ended December 31, 2017, 2016 and 2015, Condensed Consolidating Balance Sheet as of December 31, 2017 and 2016 and Condensed Consolidating Statement of Cash Flows for the years ended December 31, 2017, 2016 and 2015 for Citigroup Inc., the parent holding company (Citigroup parent company), CGMHI, other Citigroup subsidiaries and eliminations and total consolidating adjustments. “Other Citigroup subsidiaries and eliminations” includes all other subsidiaries of Citigroup, intercompany eliminations and income (loss) from discontinued operations. “Consolidating adjustments” includes Citigroup parent company elimination of distributed and undistributed income of subsidiaries and investment in subsidiaries.
These Condensed Consolidating Financial Statements have been prepared and presented in accordance with SEC Regulation S-X Rule 3-10, “Financial Statements of Guarantors and Issuers of Guaranteed Securities Registered or Being Registered.”
These Condensed Consolidating Financial Statements schedules are presented for purposes of additional analysis, but should be considered in relation to the Consolidated Financial Statements of Citigroup taken as a whole.
Condensed Consolidating Statements of Income and Comprehensive Income
|
|
|
|
|
|
|
|
|
|
|
|
|
|
|
|
|
|
|
|
|
|
Year ended December 31, 2017 |
In millions of dollars |
Citigroup parent company |
|
CGMHI |
|
Other Citigroup subsidiaries and eliminations |
|
Consolidating adjustments |
|
Citigroup consolidated |
Revenues |
|
|
|
|
|
|
|
|
|
Dividends from subsidiaries |
$ |
22,499 |
|
|
$ |
— |
|
|
$ |
— |
|
|
$ |
(22,499 |
) |
|
$ |
— |
|
Interest revenue |
1 |
|
|
5,274 |
|
|
55,929 |
|
|
— |
|
|
61,204 |
|
Interest revenue—intercompany |
3,972 |
|
|
1,178 |
|
|
(5,150 |
) |
|
— |
|
|
— |
|
Interest expense |
4,766 |
|
|
2,340 |
|
|
9,411 |
|
|
— |
|
|
16,517 |
|
Interest expense—intercompany |
829 |
|
|
2,297 |
|
|
(3,126 |
) |
|
— |
|
|
— |
|
Net interest revenue |
$ |
(1,622 |
) |
|
$ |
1,815 |
|
|
$ |
44,494 |
|
|
$ |
— |
|
|
$ |
44,687 |
|
Commissions and fees |
$ |
— |
|
|
$ |
5,139 |
|
|
$ |
7,800 |
|
|
$ |
— |
|
|
$ |
12,939 |
|
Commissions and fees—intercompany |
(2 |
) |
|
182 |
|
|
(180 |
) |
|
— |
|
|
— |
|
Principal transactions |
1,654 |
|
|
1,019 |
|
|
6,495 |
|
|
— |
|
|
9,168 |
|
Principal transactions—intercompany |
934 |
|
|
1,200 |
|
|
(2,134 |
) |
|
— |
|
|
— |
|
Other income |
(2,581 |
) |
|
855 |
|
|
6,381 |
|
|
— |
|
|
4,655 |
|
Other income—intercompany |
5 |
|
|
158 |
|
|
(163 |
) |
|
— |
|
|
— |
|
Total non-interest revenues |
$ |
10 |
|
|
$ |
8,553 |
|
|
$ |
18,199 |
|
|
$ |
— |
|
|
$ |
26,762 |
|
Total revenues, net of interest expense |
$ |
20,887 |
|
|
$ |
10,368 |
|
|
$ |
62,693 |
|
|
$ |
(22,499 |
) |
|
$ |
71,449 |
|
Provisions for credit losses and for benefits and claims |
$ |
— |
|
|
$ |
— |
|
|
$ |
7,451 |
|
|
$ |
— |
|
|
$ |
7,451 |
|
Operating expenses |
|
|
|
|
|
|
|
|
|
Compensation and benefits |
$ |
(107 |
) |
|
$ |
4,403 |
|
|
$ |
16,885 |
|
|
$ |
— |
|
|
$ |
21,181 |
|
Compensation and benefits—intercompany |
120 |
|
|
— |
|
|
(120 |
) |
|
— |
|
|
— |
|
Other operating |
(318 |
) |
|
1,776 |
|
|
18,598 |
|
|
— |
|
|
20,056 |
|
Other operating—intercompany |
(35 |
) |
|
2,219 |
|
|
(2,184 |
) |
|
— |
|
|
— |
|
Total operating expenses |
$ |
(340 |
) |
|
$ |
8,398 |
|
|
$ |
33,179 |
|
|
$ |
— |
|
|
$ |
41,237 |
|
Equity in undistributed income of subsidiaries |
$ |
(18,847 |
) |
|
$ |
— |
|
|
$ |
— |
|
|
$ |
18,847 |
|
|
$ |
— |
|
Income (loss) from continuing operations before income taxes |
$ |
2,380 |
|
|
$ |
1,970 |
|
|
$ |
22,063 |
|
|
$ |
(3,652 |
) |
|
$ |
22,761 |
|
Provision (benefit) for income taxes |
$ |
9,178 |
|
|
$ |
873 |
|
|
$ |
19,337 |
|
|
$ |
— |
|
|
$ |
29,388 |
|
Income (loss) from continuing operations |
$ |
(6,798 |
) |
|
$ |
1,097 |
|
|
$ |
2,726 |
|
|
$ |
(3,652 |
) |
|
$ |
(6,627 |
) |
Loss from discontinued operations, net of taxes |
— |
|
|
— |
|
|
(111 |
) |
|
— |
|
|
(111 |
) |
Net income (loss) before attribution of noncontrolling interests |
$ |
(6,798 |
) |
|
$ |
1,097 |
|
|
$ |
2,615 |
|
|
$ |
(3,652 |
) |
|
$ |
(6,738 |
) |
Noncontrolling interests |
— |
|
|
(1 |
) |
|
61 |
|
|
— |
|
|
60 |
|
Net income (loss) |
$ |
(6,798 |
) |
|
$ |
1,098 |
|
|
$ |
2,554 |
|
|
$ |
(3,652 |
) |
|
$ |
(6,798 |
) |
Comprehensive income |
|
|
|
|
|
|
|
|
|
|
|
|
|
|
Add: Other comprehensive income (loss) |
$ |
(2,791 |
) |
|
$ |
(117 |
) |
|
$ |
(5,969 |
) |
|
$ |
6,086 |
|
|
$ |
(2,791 |
) |
Total Citigroup comprehensive income (loss) |
$ |
(9,589 |
) |
|
$ |
981 |
|
|
$ |
(3,415 |
) |
|
$ |
2,434 |
|
|
$ |
(9,589 |
) |
Add: Other comprehensive income (loss) attributable to noncontrolling interests |
$ |
— |
|
|
$ |
— |
|
|
$ |
114 |
|
|
$ |
— |
|
|
$ |
114 |
|
Add: Net income attributable to noncontrolling interests |
— |
|
|
(1 |
) |
|
61 |
|
|
— |
|
|
60 |
|
Total comprehensive income (loss) |
$ |
(9,589 |
) |
|
$ |
980 |
|
|
$ |
(3,240 |
) |
|
$ |
2,434 |
|
|
$ |
(9,415 |
) |
Condensed Consolidating Statements of Income and Comprehensive Income
|
|
|
|
|
|
|
|
|
|
|
|
|
|
|
|
|
|
|
|
|
|
Year ended December 31, 2016 |
In millions of dollars |
Citigroup parent company |
|
CGMHI |
|
Other Citigroup subsidiaries and eliminations |
|
Consolidating adjustments |
|
Citigroup consolidated |
Revenues |
|
|
|
|
|
|
|
|
|
Dividends from subsidiaries |
$ |
15,570 |
|
|
$ |
— |
|
|
$ |
— |
|
|
$ |
(15,570 |
) |
|
$ |
— |
|
Interest revenue |
7 |
|
|
4,586 |
|
|
53,022 |
|
|
— |
|
|
57,615 |
|
Interest revenue—intercompany |
3,008 |
|
|
545 |
|
|
(3,553 |
) |
|
— |
|
|
— |
|
Interest expense |
4,419 |
|
|
1,418 |
|
|
6,674 |
|
|
— |
|
|
12,511 |
|
Interest expense—intercompany |
209 |
|
|
1,659 |
|
|
(1,868 |
) |
|
— |
|
|
— |
|
Net interest revenue |
$ |
(1,613 |
) |
|
$ |
2,054 |
|
|
$ |
44,663 |
|
|
$ |
— |
|
|
$ |
45,104 |
|
Commissions and fees |
$ |
— |
|
|
$ |
4,340 |
|
|
$ |
7,598 |
|
|
$ |
— |
|
|
$ |
11,938 |
|
Commissions and fees—intercompany |
(20 |
) |
|
246 |
|
|
(226 |
) |
|
— |
|
|
— |
|
Principal transactions |
(1,025 |
) |
|
5,576 |
|
|
3,034 |
|
|
— |
|
|
7,585 |
|
Principal transactions—intercompany |
24 |
|
|
(2,842 |
) |
|
2,818 |
|
|
— |
|
|
— |
|
Other income |
2,599 |
|
|
183 |
|
|
2,466 |
|
|
— |
|
|
5,248 |
|
Other income—intercompany |
(2,095 |
) |
|
305 |
|
|
1,790 |
|
|
— |
|
|
— |
|
Total non-interest revenues |
$ |
(517 |
) |
|
$ |
7,808 |
|
|
$ |
17,480 |
|
|
$ |
— |
|
|
$ |
24,771 |
|
Total revenues, net of interest expense |
$ |
13,440 |
|
|
$ |
9,862 |
|
|
$ |
62,143 |
|
|
$ |
(15,570 |
) |
|
$ |
69,875 |
|
Provisions for credit losses and for benefits and claims |
$ |
— |
|
|
$ |
— |
|
|
$ |
6,982 |
|
|
$ |
— |
|
|
$ |
6,982 |
|
Operating expenses |
|
|
|
|
|
|
|
|
|
Compensation and benefits |
$ |
22 |
|
|
$ |
4,719 |
|
|
$ |
16,229 |
|
|
$ |
— |
|
|
$ |
20,970 |
|
Compensation and benefits—intercompany |
36 |
|
|
— |
|
|
(36 |
) |
|
— |
|
|
— |
|
Other operating |
482 |
|
|
1,634 |
|
|
18,330 |
|
|
— |
|
|
20,446 |
|
Other operating—intercompany |
217 |
|
|
1,333 |
|
|
(1,550 |
) |
|
— |
|
|
— |
|
Total operating expenses |
$ |
757 |
|
|
$ |
7,686 |
|
|
$ |
32,973 |
|
|
$ |
— |
|
|
$ |
41,416 |
|
Equity in undistributed income of subsidiaries |
$ |
871 |
|
|
$ |
— |
|
|
$ |
— |
|
|
$ |
(871 |
) |
|
$ |
— |
|
Income (loss) from continuing operations before income taxes |
$ |
13,554 |
|
|
$ |
2,176 |
|
|
$ |
22,188 |
|
|
$ |
(16,441 |
) |
|
$ |
21,477 |
|
Provision (benefit) for income taxes |
$ |
(1,358 |
) |
|
$ |
746 |
|
|
$ |
7,056 |
|
|
$ |
— |
|
|
$ |
6,444 |
|
Income (loss) from continuing operations |
$ |
14,912 |
|
|
$ |
1,430 |
|
|
$ |
15,132 |
|
|
$ |
(16,441 |
) |
|
$ |
15,033 |
|
Loss from discontinued operations, net of taxes |
— |
|
|
— |
|
|
(58 |
) |
|
— |
|
|
(58 |
) |
Net income (loss) before attribution of noncontrolling interests |
$ |
14,912 |
|
|
$ |
1,430 |
|
|
$ |
15,074 |
|
|
$ |
(16,441 |
) |
|
$ |
14,975 |
|
Noncontrolling interests |
— |
|
|
(13 |
) |
|
76 |
|
|
— |
|
|
63 |
|
Net income (loss) |
$ |
14,912 |
|
|
$ |
1,443 |
|
|
$ |
14,998 |
|
|
$ |
(16,441 |
) |
|
$ |
14,912 |
|
Comprehensive income |
|
|
|
|
|
|
|
|
|
|
|
|
|
|
Add: Other comprehensive income (loss) |
$ |
(3,022 |
) |
|
$ |
(26 |
) |
|
$ |
2,364 |
|
|
$ |
(2,338 |
) |
|
$ |
(3,022 |
) |
Total Citigroup comprehensive income (loss) |
$ |
11,890 |
|
|
$ |
1,417 |
|
|
$ |
17,362 |
|
|
$ |
(18,779 |
) |
|
$ |
11,890 |
|
Add: Other comprehensive income (loss) attributable to noncontrolling interests
|
$ |
— |
|
|
$ |
— |
|
|
$ |
(56 |
) |
|
$ |
— |
|
|
$ |
(56 |
) |
Add: Net income attributable to noncontrolling interests |
— |
|
|
(13 |
) |
|
76 |
|
|
— |
|
|
63 |
|
Total comprehensive income (loss) |
$ |
11,890 |
|
|
$ |
1,404 |
|
|
$ |
17,382 |
|
|
$ |
(18,779 |
) |
|
$ |
11,897 |
|
Condensed Consolidating Statements of Income and Comprehensive Income
|
|
|
|
|
|
|
|
|
|
|
|
|
|
|
|
|
|
|
|
|
|
Year ended December 31, 2015 |
In millions of dollars |
Citigroup parent company |
|
CGMHI |
|
Other Citigroup subsidiaries and eliminations |
|
Consolidating adjustments |
|
Citigroup consolidated |
Revenues |
|
|
|
|
|
|
|
|
|
Dividends from subsidiaries |
$ |
13,500 |
|
|
$ |
— |
|
|
$ |
— |
|
|
$ |
(13,500 |
) |
|
$ |
— |
|
Interest revenue |
9 |
|
|
4,389 |
|
|
54,153 |
|
|
— |
|
|
58,551 |
|
Interest revenue—intercompany |
2,880 |
|
|
272 |
|
|
(3,152 |
) |
|
— |
|
|
— |
|
Interest expense |
4,563 |
|
|
988 |
|
|
6,370 |
|
|
— |
|
|
11,921 |
|
Interest expense—intercompany |
(475 |
) |
|
1,304 |
|
|
(829 |
) |
|
— |
|
|
— |
|
Net interest revenue |
$ |
(1,199 |
) |
|
$ |
2,369 |
|
|
$ |
45,460 |
|
|
$ |
— |
|
|
$ |
46,630 |
|
Commissions and fees |
$ |
— |
|
|
$ |
4,872 |
|
|
$ |
9,613 |
|
|
$ |
— |
|
|
$ |
14,485 |
|
Commissions and fees—intercompany |
— |
|
|
210 |
|
|
(210 |
) |
|
— |
|
|
— |
|
Principal transactions |
1,012 |
|
|
5,532 |
|
|
(536 |
) |
|
— |
|
|
6,008 |
|
Principal transactions—intercompany |
(1,733 |
) |
|
(3,875 |
) |
|
5,608 |
|
|
— |
|
|
— |
|
Other income |
3,294 |
|
|
403 |
|
|
5,534 |
|
|
— |
|
|
9,231 |
|
Other income—intercompany |
(3,054 |
) |
|
1,088 |
|
|
1,966 |
|
|
— |
|
|
— |
|
Total non-interest revenues |
$ |
(481 |
) |
|
$ |
8,230 |
|
|
$ |
21,975 |
|
|
$ |
— |
|
|
$ |
29,724 |
|
Total revenues, net of interest expense |
$ |
11,820 |
|
|
$ |
10,599 |
|
|
$ |
67,435 |
|
|
$ |
(13,500 |
) |
|
$ |
76,354 |
|
Provisions for credit losses and for benefits and claims |
$ |
— |
|
|
$ |
— |
|
|
$ |
7,913 |
|
|
$ |
— |
|
|
$ |
7,913 |
|
Operating expenses |
|
|
|
|
|
|
|
|
|
Compensation and benefits |
$ |
(58 |
) |
|
$ |
5,003 |
|
|
$ |
16,824 |
|
|
$ |
— |
|
|
$ |
21,769 |
|
Compensation and benefits—intercompany |
59 |
|
|
— |
|
|
(59 |
) |
|
— |
|
|
— |
|
Other operating |
271 |
|
|
1,940 |
|
|
19,635 |
|
|
— |
|
|
21,846 |
|
Other operating—intercompany |
247 |
|
|
1,173 |
|
|
(1,420 |
) |
|
— |
|
|
— |
|
Total operating expenses |
$ |
519 |
|
|
$ |
8,116 |
|
|
$ |
34,980 |
|
|
$ |
— |
|
|
$ |
43,615 |
|
Equity in undistributed income of subsidiaries |
$ |
4,601 |
|
|
$ |
— |
|
|
$ |
— |
|
|
$ |
(4,601 |
) |
|
$ |
— |
|
Income (loss) from continuing operations before income taxes |
$ |
15,902 |
|
|
$ |
2,483 |
|
|
$ |
24,542 |
|
|
$ |
(18,101 |
) |
|
$ |
24,826 |
|
Provision (benefit) for income taxes |
$ |
(1,340 |
) |
|
$ |
537 |
|
|
$ |
8,243 |
|
|
$ |
— |
|
|
$ |
7,440 |
|
Income (loss) from continuing operations |
$ |
17,242 |
|
|
$ |
1,946 |
|
|
$ |
16,299 |
|
|
$ |
(18,101 |
) |
|
$ |
17,386 |
|
Loss from discontinued operations, net of taxes |
— |
|
|
— |
|
|
(54 |
) |
|
— |
|
|
(54 |
) |
Net income (loss) before attribution of noncontrolling interests |
$ |
17,242 |
|
|
$ |
1,946 |
|
|
$ |
16,245 |
|
|
$ |
(18,101 |
) |
|
$ |
17,332 |
|
Noncontrolling interests |
— |
|
|
9 |
|
|
81 |
|
|
— |
|
|
90 |
|
Net income (loss) |
$ |
17,242 |
|
|
$ |
1,937 |
|
|
$ |
16,164 |
|
|
$ |
(18,101 |
) |
|
$ |
17,242 |
|
Comprehensive income |
|
|
|
|
|
|
|
|
|
|
|
|
|
|
Add: Other comprehensive income (loss) |
$ |
(6,128 |
) |
|
$ |
(125 |
) |
|
$ |
1,017 |
|
|
$ |
(892 |
) |
|
$ |
(6,128 |
) |
Total Citigroup comprehensive income (loss) |
$ |
11,114 |
|
|
$ |
1,812 |
|
|
$ |
17,181 |
|
|
$ |
(18,993 |
) |
|
$ |
11,114 |
|
Add: Other comprehensive income (loss) attributable to noncontrolling interests
|
$ |
— |
|
|
$ |
— |
|
|
$ |
(83 |
) |
|
$ |
— |
|
|
$ |
(83 |
) |
Add: Net income attributable to noncontrolling interests |
— |
|
|
9 |
|
|
81 |
|
|
— |
|
|
90 |
|
Total comprehensive income (loss) |
$ |
11,114 |
|
|
$ |
1,821 |
|
|
$ |
17,179 |
|
|
$ |
(18,993 |
) |
|
$ |
11,121 |
|
Condensed Consolidating Balance Sheet
|
|
|
|
|
|
|
|
|
|
|
|
|
|
|
|
|
|
|
|
|
|
December 31, 2017 |
In millions of dollars |
Citigroup parent company |
|
|
CGMHI |
|
|
Other Citigroup subsidiaries and eliminations |
|
|
Consolidating adjustments |
|
|
Citigroup consolidated |
|
Assets |
|
|
|
|
|
|
|
|
|
Cash and due from banks |
$ |
— |
|
|
$ |
378 |
|
|
$ |
23,397 |
|
|
$ |
— |
|
|
$ |
23,775 |
|
Cash and due from banks—intercompany |
13 |
|
|
3,750 |
|
|
(3,763 |
) |
|
— |
|
|
— |
|
Federal funds sold and resale agreements |
— |
|
|
182,685 |
|
|
49,793 |
|
|
— |
|
|
232,478 |
|
Federal funds sold and resale agreements—intercompany |
— |
|
|
16,091 |
|
|
(16,091 |
) |
|
— |
|
|
— |
|
Trading account assets |
— |
|
|
139,462 |
|
|
112,094 |
|
|
— |
|
|
251,556 |
|
Trading account assets—intercompany |
38 |
|
|
2,711 |
|
|
(2,749 |
) |
|
— |
|
|
— |
|
Investments |
27 |
|
|
181 |
|
|
352,082 |
|
|
— |
|
|
352,290 |
|
Loans, net of unearned income |
— |
|
|
900 |
|
|
666,134 |
|
|
— |
|
|
667,034 |
|
Loans, net of unearned income—intercompany |
— |
|
|
— |
|
|
— |
|
|
— |
|
|
— |
|
Allowance for loan losses |
— |
|
|
— |
|
|
(12,355 |
) |
|
— |
|
|
(12,355 |
) |
Total loans, net |
$ |
— |
|
|
$ |
900 |
|
|
$ |
653,779 |
|
|
$ |
— |
|
|
$ |
654,679 |
|
Advances to subsidiaries |
$ |
139,722 |
|
|
$ |
— |
|
|
$ |
(139,722 |
) |
|
$ |
— |
|
|
$ |
— |
|
Investments in subsidiaries |
210,537 |
|
|
— |
|
|
— |
|
|
(210,537 |
) |
|
— |
|
Other assets (1)
|
10,844 |
|
|
61,647 |
|
|
255,196 |
|
|
— |
|
|
327,687 |
|
Other assets—intercompany |
14,428 |
|
|
48,832 |
|
|
(63,260 |
) |
|
— |
|
|
— |
|
Total assets |
$ |
375,609 |
|
|
$ |
456,637 |
|
|
$ |
1,220,756 |
|
|
$ |
(210,537 |
) |
|
$ |
1,842,465 |
|
Liabilities and equity |
|
|
|
|
|
|
|
|
|
|
Deposits |
$ |
— |
|
|
$ |
— |
|
|
$ |
959,822 |
|
|
$ |
— |
|
|
$ |
959,822 |
|
Deposits—intercompany |
— |
|
|
— |
|
|
— |
|
|
— |
|
|
— |
|
Federal funds purchased and securities loaned or sold |
— |
|
|
134,888 |
|
|
21,389 |
|
|
— |
|
|
156,277 |
|
Federal funds purchased and securities loaned or sold—intercompany |
— |
|
|
18,597 |
|
|
(18,597 |
) |
|
— |
|
|
— |
|
Trading account liabilities |
— |
|
|
80,801 |
|
|
43,246 |
|
|
— |
|
|
124,047 |
|
Trading account liabilities—intercompany |
15 |
|
|
2,182 |
|
|
(2,197 |
) |
|
— |
|
|
— |
|
Short-term borrowings |
251 |
|
|
3,568 |
|
|
40,633 |
|
|
— |
|
|
44,452 |
|
Short-term borrowings—intercompany |
— |
|
|
32,871 |
|
|
(32,871 |
) |
|
— |
|
|
— |
|
Long-term debt |
152,163 |
|
|
18,048 |
|
|
66,498 |
|
|
— |
|
|
236,709 |
|
Long-term debt—intercompany |
— |
|
|
60,765 |
|
|
(60,765 |
) |
|
— |
|
|
— |
|
Advances from subsidiaries |
19,136 |
|
|
— |
|
|
(19,136 |
) |
|
— |
|
|
— |
|
Other liabilities |
2,673 |
|
|
62,113 |
|
|
54,700 |
|
|
— |
|
|
119,486 |
|
Other liabilities—intercompany |
631 |
|
|
9,753 |
|
|
(10,384 |
) |
|
— |
|
|
— |
|
Stockholders’ equity |
200,740 |
|
|
33,051 |
|
|
178,418 |
|
|
(210,537 |
) |
|
201,672 |
|
Total liabilities and equity |
$ |
375,609 |
|
|
$ |
456,637 |
|
|
$ |
1,220,756 |
|
|
$ |
(210,537 |
) |
|
$ |
1,842,465 |
|
|
|
(1) |
Other assets for Citigroup parent company at December 31, 2017 included $29.7 billion of placements to Citibank and its branches, of which $18.9 billion had a remaining term of less than 30 days.
|
Condensed Consolidating Balance Sheet
|
|
|
|
|
|
|
|
|
|
|
|
|
|
|
|
|
|
|
|
|
|
December 31, 2016 |
In millions of dollars |
Citigroup parent company |
|
CGMHI |
|
Other Citigroup subsidiaries and eliminations |
|
Consolidating adjustments |
|
Citigroup consolidated |
Assets |
|
|
|
|
|
|
|
|
|
Cash and due from banks |
$ |
— |
|
|
$ |
870 |
|
|
$ |
22,173 |
|
|
$ |
— |
|
|
$ |
23,043 |
|
Cash and due from banks—intercompany |
142 |
|
|
3,820 |
|
|
(3,962 |
) |
|
— |
|
|
— |
|
Federal funds sold and resale agreements |
— |
|
|
196,236 |
|
|
40,577 |
|
|
— |
|
|
236,813 |
|
Federal funds sold and resale agreements—intercompany |
— |
|
|
12,270 |
|
|
(12,270 |
) |
|
— |
|
|
— |
|
Trading account assets |
6 |
|
|
121,484 |
|
|
122,435 |
|
|
— |
|
|
243,925 |
|
Trading account assets—intercompany |
1,173 |
|
|
907 |
|
|
(2,080 |
) |
|
— |
|
|
— |
|
Investments |
173 |
|
|
335 |
|
|
352,796 |
|
|
— |
|
|
353,304 |
|
Loans, net of unearned income |
— |
|
|
575 |
|
|
623,794 |
|
|
— |
|
|
624,369 |
|
Loans, net of unearned income—intercompany |
— |
|
|
— |
|
|
— |
|
|
— |
|
|
— |
|
Allowance for loan losses |
— |
|
|
— |
|
|
(12,060 |
) |
|
— |
|
|
(12,060 |
) |
Total loans, net |
$ |
— |
|
|
$ |
575 |
|
|
$ |
611,734 |
|
|
$ |
— |
|
|
$ |
612,309 |
|
Advances to subsidiaries |
$ |
143,154 |
|
|
$ |
— |
|
|
$ |
(143,154 |
) |
|
$ |
— |
|
|
$ |
— |
|
Investments in subsidiaries |
226,279 |
|
|
— |
|
|
— |
|
|
(226,279 |
) |
|
— |
|
Other assets(1)
|
23,734 |
|
|
46,095 |
|
|
252,854 |
|
|
— |
|
|
322,683 |
|
Other assets—intercompany |
27,845 |
|
|
38,207 |
|
|
(66,052 |
) |
|
— |
|
|
— |
|
Total assets |
$ |
422,506 |
|
|
$ |
420,799 |
|
|
$ |
1,175,051 |
|
|
$ |
(226,279 |
) |
|
$ |
1,792,077 |
|
Liabilities and equity |
|
|
|
|
|
|
|
|
|
|
Deposits |
$ |
— |
|
|
$ |
— |
|
|
$ |
929,406 |
|
|
$ |
— |
|
|
$ |
929,406 |
|
Deposits—intercompany |
— |
|
|
— |
|
|
— |
|
|
— |
|
|
— |
|
Federal funds purchased and securities loaned or sold |
— |
|
|
122,320 |
|
|
19,501 |
|
|
— |
|
|
141,821 |
|
Federal funds purchased and securities loaned or sold—intercompany |
— |
|
|
25,417 |
|
|
(25,417 |
) |
|
— |
|
|
— |
|
Trading account liabilities |
— |
|
|
87,714 |
|
|
51,331 |
|
|
— |
|
|
139,045 |
|
Trading account liabilities—intercompany |
1,006 |
|
|
868 |
|
|
(1,874 |
) |
|
— |
|
|
— |
|
Short-term borrowings |
— |
|
|
1,356 |
|
|
29,345 |
|
|
— |
|
|
30,701 |
|
Short-term borrowings—intercompany |
— |
|
|
35,596 |
|
|
(35,596 |
) |
|
— |
|
|
— |
|
Long-term debt |
147,333 |
|
|
8,128 |
|
|
50,717 |
|
|
— |
|
|
206,178 |
|
Long-term debt—intercompany |
— |
|
|
41,287 |
|
|
(41,287 |
) |
|
— |
|
|
— |
|
Advances from subsidiaries |
41,258 |
|
|
— |
|
|
(41,258 |
) |
|
— |
|
|
— |
|
Other liabilities |
3,466 |
|
|
57,430 |
|
|
57,887 |
|
|
— |
|
|
118,783 |
|
Other liabilities—intercompany |
4,323 |
|
|
7,894 |
|
|
(12,217 |
) |
|
— |
|
|
— |
|
Stockholders’ equity |
225,120 |
|
|
32,789 |
|
|
194,513 |
|
|
(226,279 |
) |
|
226,143 |
|
Total liabilities and equity |
$ |
422,506 |
|
|
$ |
420,799 |
|
|
$ |
1,175,051 |
|
|
$ |
(226,279 |
) |
|
$ |
1,792,077 |
|
|
|
(1) |
Other assets for Citigroup parent company at December 31, 2016 included $20.7 billion of placements to Citibank and its branches, of which $6.8 billion had a remaining term of less than 30 days.
|
Condensed Consolidating Statement of Cash Flows
|
|
|
|
|
|
|
|
|
|
|
|
|
|
|
|
|
|
|
|
|
|
Year ended December 31, 2017 |
In millions of dollars |
Citigroup parent company |
|
CGMHI |
|
Other Citigroup subsidiaries and eliminations |
|
Consolidating adjustments |
|
Citigroup consolidated |
Net cash provided by (used in) operating activities of continuing operations |
$ |
34,940 |
|
|
$ |
(33,359 |
) |
|
$ |
(10,168 |
) |
|
$ |
— |
|
|
$ |
(8,587 |
) |
Cash flows from investing activities of continuing operations |
|
|
|
|
|
|
|
|
|
Purchases of investments |
$ |
— |
|
|
$ |
(1 |
) |
|
$ |
(185,739 |
) |
|
$ |
— |
|
|
$ |
(185,740 |
) |
Proceeds from sales of investments |
132 |
|
|
— |
|
|
107,236 |
|
|
— |
|
|
107,368 |
|
Proceeds from maturities of investments |
— |
|
|
— |
|
|
84,369 |
|
|
— |
|
|
84,369 |
|
Change in deposits with banks |
— |
|
|
11,861 |
|
|
(31,151 |
) |
|
— |
|
|
(19,290 |
) |
Change in loans |
— |
|
|
— |
|
|
(58,062 |
) |
|
— |
|
|
(58,062 |
) |
Proceeds from sales and securitizations of loans |
— |
|
|
— |
|
|
8,365 |
|
|
— |
|
|
8,365 |
|
Proceeds from significant disposals |
— |
|
|
— |
|
|
3,411 |
|
|
— |
|
|
3,411 |
|
Change in federal funds sold and resales |
— |
|
|
9,730 |
|
|
(5,395 |
) |
|
— |
|
|
4,335 |
|
Changes in investments and advances—intercompany |
(899 |
) |
|
(2,790 |
) |
|
3,689 |
|
|
— |
|
|
— |
|
Other investing activities |
— |
|
|
(24 |
) |
|
(2,960 |
) |
|
— |
|
|
(2,984 |
) |
Net cash provided by (used in) investing activities of continuing operations |
$ |
(767 |
) |
|
$ |
18,776 |
|
|
$ |
(76,237 |
) |
|
$ |
— |
|
|
$ |
(58,228 |
) |
Cash flows from financing activities of continuing operations |
|
|
|
|
|
|
|
|
|
Dividends paid |
$ |
(3,797 |
) |
|
$ |
— |
|
|
$ |
— |
|
|
$ |
— |
|
|
$ |
(3,797 |
) |
Treasury stock acquired |
(14,541 |
) |
|
— |
|
|
— |
|
|
— |
|
|
(14,541 |
) |
Proceeds (repayments) from issuance of long-term debt, net |
6,544 |
|
|
4,909 |
|
|
15,521 |
|
|
— |
|
|
26,974 |
|
Proceeds (repayments) from issuance of long-term debt—intercompany, net |
— |
|
|
(2,031 |
) |
|
2,031 |
|
|
— |
|
|
— |
|
Change in deposits |
— |
|
|
— |
|
|
30,416 |
|
|
— |
|
|
30,416 |
|
Change in federal funds purchased and repos |
— |
|
|
5,748 |
|
|
8,708 |
|
|
— |
|
|
14,456 |
|
Change in short-term borrowings |
49 |
|
|
2,212 |
|
|
11,490 |
|
|
— |
|
|
13,751 |
|
Net change in short-term borrowings and other advances—intercompany |
(22,152 |
) |
|
3,931 |
|
|
18,221 |
|
|
— |
|
|
— |
|
Capital contributions from parent |
— |
|
|
(748 |
) |
|
748 |
|
|
— |
|
|
— |
|
Other financing activities |
(405 |
) |
|
— |
|
|
— |
|
|
— |
|
|
(405 |
) |
Net cash provided by (used in) financing activities of continuing operations |
$ |
(34,302 |
) |
|
$ |
14,021 |
|
|
$ |
87,135 |
|
|
$ |
— |
|
|
$ |
66,854 |
|
Effect of exchange rate changes on cash and due from banks |
$ |
— |
|
|
$ |
— |
|
|
$ |
693 |
|
|
$ |
— |
|
|
$ |
693 |
|
Change in cash and due from banks |
$ |
(129 |
) |
|
$ |
(562 |
) |
|
$ |
1,423 |
|
|
$ |
— |
|
|
$ |
732 |
|
Cash and due from banks at beginning of period |
142 |
|
|
4,690 |
|
|
18,211 |
|
|
— |
|
|
23,043 |
|
Cash and due from banks at end of period |
$ |
13 |
|
|
$ |
4,128 |
|
|
$ |
19,634 |
|
|
$ |
— |
|
|
$ |
23,775 |
|
Supplemental disclosure of cash flow information for continuing operations |
|
|
|
|
|
|
|
|
|
|
|
|
|
|
Cash paid during the year for income taxes |
$ |
(3,730 |
) |
|
$ |
678 |
|
|
$ |
5,135 |
|
|
$ |
— |
|
|
$ |
2,083 |
|
Cash paid during the year for interest |
4,151 |
|
|
4,513 |
|
|
7,011 |
|
|
— |
|
|
15,675 |
|
Non-cash investing activities |
|
|
|
|
|
|
|
|
|
|
|
|
|
|
Transfers to loans HFS from loans |
$ |
— |
|
|
$ |
— |
|
|
$ |
5,900 |
|
|
$ |
— |
|
|
$ |
5,900 |
|
Transfers to OREO and other repossessed assets |
— |
|
|
— |
|
|
113 |
|
|
— |
|
|
113 |
|
Condensed Consolidating Statement of Cash Flows
|
|
|
|
|
|
|
|
|
|
|
|
|
|
|
|
|
|
|
|
|
|
Year ended December 31, 2016 |
In millions of dollars |
Citigroup parent company |
|
CGMHI |
|
Other Citigroup subsidiaries and eliminations |
|
Consolidating adjustments |
|
Citigroup consolidated |
Net cash provided by operating activities of continuing operations |
$ |
12,777 |
|
|
$ |
20,662 |
|
|
$ |
20,493 |
|
|
$ |
— |
|
|
$ |
53,932 |
|
Cash flows from investing activities of continuing operations |
|
|
|
|
|
|
|
|
|
Purchases of investments |
$ |
— |
|
|
$ |
(4 |
) |
|
$ |
(211,398 |
) |
|
$ |
— |
|
|
$ |
(211,402 |
) |
Proceeds from sales of investments |
3,024 |
|
|
— |
|
|
129,159 |
|
|
— |
|
|
132,183 |
|
Proceeds from maturities of investments |
234 |
|
|
— |
|
|
65,291 |
|
|
— |
|
|
65,525 |
|
Change in deposits with banks |
— |
|
|
(3,643 |
) |
|
(21,668 |
) |
|
— |
|
|
(25,311 |
) |
Change in loans |
— |
|
|
— |
|
|
(39,761 |
) |
|
— |
|
|
(39,761 |
) |
Proceeds from sales and securitizations of loans |
— |
|
|
— |
|
|
18,140 |
|
|
— |
|
|
18,140 |
|
Proceeds from significant disposals |
— |
|
|
— |
|
|
265 |
|
|
— |
|
|
265 |
|
Change in federal funds sold and resales |
— |
|
|
(15,293 |
) |
|
(1,845 |
) |
|
— |
|
|
(17,138 |
) |
Changes in investments and advances—intercompany |
(18,083 |
) |
|
(5,574 |
) |
|
23,657 |
|
|
— |
|
|
— |
|
Other investing activities |
— |
|
|
— |
|
|
(2,089 |
) |
|
— |
|
|
(2,089 |
) |
Net cash used in investing activities of continuing operations |
$ |
(14,825 |
) |
|
$ |
(24,514 |
) |
|
$ |
(40,249 |
) |
|
$ |
— |
|
|
$ |
(79,588 |
) |
Cash flows from financing activities of continuing operations |
|
|
|
|
|
|
|
|
|
Dividends paid |
$ |
(2,287 |
) |
|
$ |
— |
|
|
$ |
— |
|
|
$ |
— |
|
|
$ |
(2,287 |
) |
Issuance of preferred stock |
2,498 |
|
|
— |
|
|
— |
|
|
— |
|
|
2,498 |
|
Treasury stock acquired |
(9,290 |
) |
|
— |
|
|
— |
|
|
— |
|
|
(9,290 |
) |
Proceeds (repayments) from issuance of long-term debt, net |
7,005 |
|
|
5,916 |
|
|
(4,575 |
) |
|
— |
|
|
8,346 |
|
Proceeds (repayments) from issuance of long-term debt—intercompany, net |
— |
|
|
(9,453 |
) |
|
9,453 |
|
|
— |
|
|
— |
|
Change in deposits |
— |
|
|
— |
|
|
24,394 |
|
|
— |
|
|
24,394 |
|
Change in federal funds purchased and repos |
— |
|
|
3,236 |
|
|
(7,911 |
) |
|
— |
|
|
(4,675 |
) |
Change in short-term borrowings |
(164 |
) |
|
1,168 |
|
|
8,618 |
|
|
— |
|
|
9,622 |
|
Net change in short-term borrowings and other advances—intercompany |
4,620 |
|
|
680 |
|
|
(5,300 |
) |
|
— |
|
|
— |
|
Capital contributions from parent |
— |
|
|
5,000 |
|
|
(5,000 |
) |
|
— |
|
|
— |
|
Other financing activities |
(316 |
) |
|
— |
|
|
— |
|
|
— |
|
|
(316 |
) |
Net cash provided by financing activities of continuing operations |
$ |
2,066 |
|
|
$ |
6,547 |
|
|
$ |
19,679 |
|
|
$ |
— |
|
|
$ |
28,292 |
|
Effect of exchange rate changes on cash and due from banks |
$ |
— |
|
|
$ |
— |
|
|
$ |
(493 |
) |
|
$ |
— |
|
|
$ |
(493 |
) |
Change in cash and due from banks |
$ |
18 |
|
|
$ |
2,695 |
|
|
$ |
(570 |
) |
|
$ |
— |
|
|
$ |
2,143 |
|
Cash and due from banks at beginning of period |
124 |
|
|
1,995 |
|
|
18,781 |
|
|
— |
|
|
20,900 |
|
Cash and due from banks at end of period |
$ |
142 |
|
|
$ |
4,690 |
|
|
$ |
18,211 |
|
|
$ |
— |
|
|
$ |
23,043 |
|
Supplemental disclosure of cash flow information for continuing operations |
|
|
|
|
|
|
|
|
|
|
|
|
|
|
Cash paid during the year for income taxes |
$ |
351 |
|
|
$ |
92 |
|
|
$ |
3,916 |
|
|
$ |
— |
|
|
$ |
4,359 |
|
Cash paid during the year for interest |
4,397 |
|
|
3,115 |
|
|
4,555 |
|
|
— |
|
|
12,067 |
|
Non-cash investing activities |
|
|
|
|
|
|
|
|
|
Transfers to loans held-for-sale from loans |
$ |
— |
|
|
$ |
— |
|
|
$ |
13,900 |
|
|
$ |
— |
|
|
$ |
13,900 |
|
Transfers to OREO and other repossessed assets |
— |
|
|
— |
|
|
165 |
|
|
— |
|
|
165 |
|
Condensed Consolidating Statements of Cash Flows
|
|
|
|
|
|
|
|
|
|
|
|
|
|
|
|
|
|
|
|
|
|
Year ended December 31, 2015 |
In millions of dollars |
Citigroup parent company |
|
CGMHI |
|
Other Citigroup subsidiaries and eliminations |
|
Consolidating adjustments |
|
Citigroup consolidated |
Net cash provided by (used in) operating activities of continuing operations |
$ |
27,825 |
|
|
$ |
12,336 |
|
|
$ |
(424 |
) |
|
$ |
— |
|
|
$ |
39,737 |
|
Cash flows from investing activities of continuing operations |
|
|
|
|
|
|
|
|
|
Purchases of investments |
$ |
— |
|
|
$ |
(4 |
) |
|
$ |
(242,358 |
) |
|
$ |
— |
|
|
$ |
(242,362 |
) |
Proceeds from sales of investments |
— |
|
|
53 |
|
|
141,417 |
|
|
— |
|
|
141,470 |
|
Proceeds from maturities of investments |
237 |
|
|
— |
|
|
81,810 |
|
|
— |
|
|
82,047 |
|
Change in deposits with banks |
— |
|
|
(8,414 |
) |
|
23,902 |
|
|
— |
|
|
15,488 |
|
Change in loans |
— |
|
|
— |
|
|
1,353 |
|
|
— |
|
|
1,353 |
|
Proceeds from sales and securitizations of loans |
— |
|
|
— |
|
|
9,610 |
|
|
— |
|
|
9,610 |
|
Change in federal funds sold and resales |
— |
|
|
8,037 |
|
|
14,858 |
|
|
— |
|
|
22,895 |
|
Proceeds from significant disposals |
— |
|
|
— |
|
|
5,932 |
|
|
— |
|
|
5,932 |
|
Payments due to transfers of net liabilities associated with significant disposals |
— |
|
|
— |
|
|
(18,929 |
) |
|
— |
|
|
(18,929 |
) |
Changes in investments and advances—intercompany |
(35,548 |
) |
|
1,044 |
|
|
34,504 |
|
|
— |
|
|
— |
|
Other investing activities |
3 |
|
|
(101 |
) |
|
(2,523 |
) |
|
— |
|
|
(2,621 |
) |
Net cash provided by (used in) investing activities of continuing operations |
$ |
(35,308 |
) |
|
$ |
615 |
|
|
$ |
49,576 |
|
|
$ |
— |
|
|
$ |
14,883 |
|
Cash flows from financing activities of continuing operations |
|
|
|
|
|
|
|
|
|
Dividends paid |
$ |
(1,253 |
) |
|
$ |
— |
|
|
$ |
— |
|
|
$ |
— |
|
|
$ |
(1,253 |
) |
Issuance of preferred stock |
6,227 |
|
|
— |
|
|
— |
|
|
— |
|
|
6,227 |
|
Treasury stock acquired |
(5,452 |
) |
|
— |
|
|
— |
|
|
— |
|
|
(5,452 |
) |
Proceeds (repayments) from issuance of long-term debt, net |
127 |
|
|
(139 |
) |
|
(8,212 |
) |
|
— |
|
|
(8,224 |
) |
Proceeds (repayments) from issuance of long-term debt—intercompany, net |
— |
|
|
12,557 |
|
|
(12,557 |
) |
|
— |
|
|
— |
|
Change in deposits |
— |
|
|
— |
|
|
8,555 |
|
|
— |
|
|
8,555 |
|
Change in federal funds purchased and repos |
— |
|
|
(27,442 |
) |
|
500 |
|
|
— |
|
|
(26,942 |
) |
Change in short-term borrowings |
(845 |
) |
|
(1,737 |
) |
|
(34,674 |
) |
|
— |
|
|
(37,256 |
) |
Net change in short-term borrowings and other advances—intercompany |
9,106 |
|
|
4,054 |
|
|
(13,160 |
) |
|
— |
|
|
— |
|
Other financing activities |
(428 |
) |
|
— |
|
|
— |
|
|
— |
|
|
(428 |
) |
Net cash provided by (used in) financing activities of continuing operations |
$ |
7,482 |
|
|
$ |
(12,707 |
) |
|
$ |
(59,548 |
) |
|
$ |
— |
|
|
$ |
(64,773 |
) |
Effect of exchange rate changes on cash and due from banks |
$ |
— |
|
|
$ |
— |
|
|
$ |
(1,055 |
) |
|
$ |
— |
|
|
$ |
(1,055 |
) |
Change in cash and due from banks |
$ |
(1 |
) |
|
$ |
244 |
|
|
$ |
(11,451 |
) |
|
$ |
— |
|
|
$ |
(11,208 |
) |
Cash and due from banks at beginning of period |
125 |
|
|
1,751 |
|
|
30,232 |
|
|
— |
|
|
32,108 |
|
Cash and due from banks at end of period |
$ |
124 |
|
|
$ |
1,995 |
|
|
$ |
18,781 |
|
|
$ |
— |
|
|
$ |
20,900 |
|
Supplemental disclosure of cash flow information for continuing operations |
|
|
|
|
|
|
|
|
|
Cash paid during the year for income taxes |
$ |
111 |
|
|
$ |
175 |
|
|
$ |
4,692 |
|
|
$ |
— |
|
|
$ |
4,978 |
|
Cash paid during the year for interest |
4,916 |
|
|
2,346 |
|
|
4,769 |
|
|
— |
|
|
12,031 |
|
|
|
|
|
|
|
|
|
|
|
|
|
|
|
|
|
|
|
|
|
|
Non-cash investing activities |
|
|
|
|
|
|
|
|
|
Decrease in net loans associated with significant disposals reclassified to HFS |
$ |
— |
|
|
$ |
— |
|
|
$ |
(9,063 |
) |
|
$ |
— |
|
|
$ |
(9,063 |
) |
Decrease in investments associated with significant disposals reclassified to HFS |
— |
|
|
— |
|
|
(1,402 |
) |
|
— |
|
|
(1,402 |
) |
Decrease in goodwill and intangible assets associated with significant disposals reclassified to HFS |
— |
|
|
— |
|
|
(223 |
) |
|
— |
|
|
(223 |
) |
Decrease in deposits with banks with significant disposals reclassified to HFS |
— |
|
|
— |
|
|
(404 |
) |
|
— |
|
|
(404 |
) |
Transfers to loans held-for-sale from loans |
— |
|
|
— |
|
|
28,600 |
|
|
— |
|
|
28,600 |
|
Transfers to OREO and other repossessed assets |
— |
|
|
— |
|
|
276 |
|
|
— |
|
|
276 |
|
Non-cash financing activities |
|
|
|
|
|
|
|
|
|
|
Decrease in long-term debt associated with significant disposals
reclassified to HFS
|
$ |
— |
|
|
$ |
— |
|
|
$ |
(4,673 |
) |
|
$ |
— |
|
|
$ |
(4,673 |
) |
29. SELECTED QUARTERLY FINANCIAL DATA (UNAUDITED)
|
|
|
|
|
|
|
|
|
|
|
|
|
|
|
|
|
|
|
|
|
|
|
|
|
|
|
2017 |
2016 |
In millions of dollars, except per share amounts |
Fourth(1)
|
Third |
Second |
First |
Fourth |
Third |
Second |
First |
Revenues, net of interest expense |
$ |
17,255 |
|
$ |
18,173 |
|
$ |
17,901 |
|
$ |
18,120 |
|
$ |
17,012 |
|
$ |
17,760 |
|
$ |
17,548 |
|
$ |
17,555 |
|
Operating expenses |
10,083 |
|
10,171 |
|
10,506 |
|
10,477 |
|
10,120 |
|
10,404 |
|
10,369 |
|
10,523 |
|
Provisions for credit losses and for benefits and claims |
2,073 |
|
1,999 |
|
1,717 |
|
1,662 |
|
1,792 |
|
1,736 |
|
1,409 |
|
2,045 |
|
Income from continuing operations before income taxes |
$ |
5,099 |
|
$ |
6,003 |
|
$ |
5,678 |
|
$ |
5,981 |
|
$ |
5,100 |
|
$ |
5,620 |
|
$ |
5,770 |
|
$ |
4,987 |
|
Income taxes |
23,864 |
|
1,866 |
|
1,795 |
|
1,863 |
|
1,509 |
|
1,733 |
|
1,723 |
|
1,479 |
|
Income (loss) from continuing operations |
$ |
(18,765 |
) |
$ |
4,137 |
|
$ |
3,883 |
|
$ |
4,118 |
|
$ |
3,591 |
|
$ |
3,887 |
|
$ |
4,047 |
|
$ |
3,508 |
|
Income (loss) from discontinued operations, net of taxes |
(109 |
) |
(5 |
) |
21 |
|
(18 |
) |
(3 |
) |
(30 |
) |
(23 |
) |
(2 |
) |
Net income before attribution of noncontrolling interests |
$ |
(18,874 |
) |
$ |
4,132 |
|
$ |
3,904 |
|
$ |
4,100 |
|
$ |
3,588 |
|
$ |
3,857 |
|
$ |
4,024 |
|
$ |
3,506 |
|
Noncontrolling interests |
19 |
|
(1 |
) |
32 |
|
10 |
|
15 |
|
17 |
|
26 |
|
5 |
|
Citigroup’s net income (loss) |
$ |
(18,893 |
) |
$ |
4,133 |
|
$ |
3,872 |
|
$ |
4,090 |
|
$ |
3,573 |
|
$ |
3,840 |
|
$ |
3,998 |
|
$ |
3,501 |
|
Earnings per share(2)
|
|
|
|
|
|
|
|
|
|
|
|
|
|
|
|
|
Basic |
|
|
|
|
|
|
|
|
|
|
|
|
|
|
|
|
Income (loss) from continuing operations |
$ |
(7.33 |
) |
$ |
1.42 |
|
$ |
1.27 |
|
$ |
1.36 |
|
$ |
1.14 |
|
$ |
1.25 |
|
$ |
1.25 |
|
$ |
1.11 |
|
Net income (loss) |
(7.38 |
) |
1.42 |
|
1.28 |
|
1.35 |
|
1.14 |
|
1.24 |
|
1.24 |
|
1.10 |
|
Diluted |
|
|
|
|
|
|
|
|
|
|
|
|
|
|
|
|
Income (loss) from continuing operations |
(7.33 |
) |
1.42 |
|
1.27 |
|
1.36 |
|
1.14 |
|
1.25 |
|
1.25 |
|
1.11 |
|
Net income (loss) |
(7.38 |
) |
1.42 |
|
1.28 |
|
1.35 |
|
1.14 |
|
1.24 |
|
1.24 |
|
1.10 |
|
Common stock price per share |
|
|
|
|
|
|
|
|
|
|
|
|
|
|
|
|
High close during the quarter |
77.10 |
|
72.74 |
|
66.98 |
|
61.54 |
|
61.09 |
|
47.90 |
|
47.33 |
|
51.13 |
|
Low close during the quarter |
71.33 |
|
65.95 |
|
57.72 |
|
55.68 |
|
47.03 |
|
40.78 |
|
38.48 |
|
34.98 |
|
Quarter end |
74.41 |
|
72.74 |
|
66.88 |
|
59.82 |
|
59.43 |
|
47.23 |
|
42.39 |
|
41.75 |
|
Dividends per share of common stock |
0.32 |
|
0.32 |
|
0.16 |
|
0.16 |
|
0.16 |
|
0.16 |
|
0.05 |
|
0.05 |
|
This Note to the Consolidated Financial Statements is unaudited due to the Company’s individual quarterly results not being subject to an audit.
|
|
(1) |
The fourth quarter of 2017 includes the impact of Tax Reform. See Notes 1 and 9 to the Consolidated Financial Statements. |
|
|
(2) |
Due to averaging of shares, quarterly earnings per share may not sum to the totals reported for the full year. |
[End of Consolidated Financial Statements and Notes to Consolidated Financial Statements]
FINANCIAL DATA SUPPLEMENT
RATIOS
|
|
|
|
|
|
|
|
|
2017 |
2016 |
2015 |
Citigroup’s net income to average assets(1)
|
0.84 |
% |
0.82 |
% |
0.95 |
% |
Return on average common stockholders’ equity(1)(2)
|
7.0 |
|
6.6 |
|
8.1 |
|
Return on average total stockholders’ equity(1)(3)
|
7.0 |
|
6.5 |
|
7.9 |
|
Total average equity to average assets(4)
|
12.1 |
|
12.6 |
|
11.9 |
|
Dividend payout ratio(1)(5)
|
18.0 |
|
8.9 |
|
3.0 |
|
|
|
(1) |
2017 excludes the impact of Tax Reform. See “Impact of Tax Reform” above. |
|
|
(2) |
Based on Citigroup’s net income less preferred stock dividends as a percentage of average common stockholders’ equity. |
|
|
(3) |
Based on Citigroup’s net income as a percentage of average total Citigroup stockholders’ equity. |
|
|
(4) |
Based on average Citigroup stockholders’ equity as a percentage of average assets. |
|
|
(5) |
Dividends declared per common share as a percentage of net income per diluted share. |
AVERAGE DEPOSIT LIABILITIES IN OFFICES OUTSIDE THE U.S.(1)
|
|
|
|
|
|
|
|
|
|
|
|
|
|
|
|
|
|
|
2017 |
|
2016 |
|
2015 |
In millions of dollars at year end except ratios |
Average
interest rate |
Average
balance |
Average
interest rate |
Average
balance |
Average
interest rate |
Average
balance |
Banks |
0.49 |
% |
$ |
36,063 |
|
0.34 |
% |
$ |
36,983 |
|
0.44 |
% |
$ |
46,664 |
|
Other demand deposits |
0.52 |
|
293,389 |
|
0.49 |
|
278,745 |
|
0.44 |
|
249,498 |
|
Other time and savings deposits(2)
|
1.23 |
|
191,363 |
|
1.16 |
|
189,049 |
|
1.24 |
|
198,733 |
|
Total |
0.78 |
% |
$ |
520,815 |
|
0.73 |
% |
$ |
504,777 |
|
0.76 |
% |
$ |
494,895 |
|
|
|
(1) |
Interest rates and amounts include the effects of risk management activities and also reflect the impact of the local interest rates prevailing in certain countries. |
|
|
(2) |
Primarily consists of certificates of deposit and other time deposits in denominations of $100,000 or more. |
MATURITY PROFILE OF TIME DEPOSITS IN U.S. OFFICES
|
|
|
|
|
|
|
|
|
|
|
|
|
|
|
|
|
|
|
In millions of dollars at December 31, 2017 |
Under 3
months |
Over 3 to 6
months |
Over 6 to 12
months |
Over 12
months |
Over $100,000 |
|
|
|
|
Certificates of deposit |
$ |
13,087 |
|
$ |
2,956 |
|
$ |
795 |
|
$ |
1,471 |
|
Other time deposits |
4,221 |
|
603 |
|
15 |
|
280 |
|
Over $250,000 |
|
|
|
|
Certificates of deposit |
$ |
12,692 |
|
$ |
2,633 |
|
$ |
412 |
|
$ |
951 |
|
Other time deposits |
4,219 |
|
603 |
|
15 |
|
9 |
|
SUPERVISION, REGULATION AND OTHER
SUPERVISION AND REGULATION
Citi is subject to regulation under U.S. federal and state laws, as well as applicable laws in the other jurisdictions in which it does business.
General
Citigroup is a registered bank holding company and financial holding company and is regulated and supervised by the Federal Reserve Board. Citigroup’s nationally chartered subsidiary banks, including Citibank, are regulated and supervised by the Office of the Comptroller of the Currency (OCC) and its state-chartered depository institution by the relevant state’s banking department and the Federal Deposit Insurance Corporation (FDIC). The FDIC also has examination authority for banking subsidiaries whose deposits it insures. Overseas branches of Citibank are regulated and supervised by the Federal Reserve Board and OCC and overseas subsidiary banks by the Federal Reserve Board. These overseas branches and subsidiary banks are also regulated and supervised by regulatory authorities in the host countries. In addition, the Consumer Financial Protection Bureau (CFPB) regulates consumer financial products and services. Citi is also subject to laws and regulations concerning the collection, use, sharing and disposition of certain customer, employee and other personal and confidential information, including those imposed by the Gramm-Leach-Bliley Act, the Fair Credit Reporting Act and the EU Data Protection Directive. For more information on U.S. and foreign regulation affecting or potentially affecting Citi and its subsidiaries, see “Risk Factors” above.
Other Bank and Bank Holding Company Regulation
Citi, including its banking subsidiaries, is subject to regulatory limitations, including requirements for banks to maintain reserves against deposits, requirements as to risk-based capital and leverage (see “Capital Resources” above and Note 18 to the Consolidated Financial Statements), restrictions on the types and amounts of loans that may be made and the interest that may be charged and limitations on investments that can be made and services that can be offered. The Federal Reserve Board may also expect Citi to commit resources to its subsidiary banks in certain circumstances. Citi is also subject to anti-money laundering and financial transparency laws, including standards for verifying client identification at account opening and obligations to monitor client transactions and report suspicious activities.
Securities and Commodities Regulation
Citi conducts securities underwriting, brokerage and dealing activities in the U.S. through Citigroup Global Markets Inc. (CGMI), its primary broker-dealer, and other broker-dealer subsidiaries, which are subject to regulations of the U.S. Securities and Exchange Commission (SEC), the Financial Industry Regulatory Authority and certain exchanges. Citi conducts similar securities activities outside the U.S., subject to local requirements, through various subsidiaries and affiliates, principally Citigroup Global Markets Limited in
London (CGML), which is regulated principally by the U.K. Financial Conduct Authority, and Citigroup Global Markets Japan Inc. in Tokyo, which is regulated principally by the Financial Services Agency of Japan.
Citi also has subsidiaries that are members of futures exchanges. In the U.S., CGMI is a member of the principal U.S. futures exchanges, and Citi has subsidiaries that are registered as futures commission merchants and commodity pool operators with the Commodity Futures Trading Commission (CFTC). Citibank, CGMI, Citigroup Energy Inc. and CGML, also are registered as swap dealers with the CFTC. CGMI is also subject to SEC and CFTC rules that specify uniform minimum net capital requirements. Compliance with these rules could limit those operations of CGMI that require the intensive use of capital and also limits the ability of broker-dealers to transfer large amounts of capital to parent companies and other affiliates. See also “Capital Resources” and Note 18 to the Consolidated Financial Statements for a further discussion of capital considerations of Citi’s non-banking subsidiaries.
Transactions with Affiliates
Transactions between Citi’s U.S. subsidiary depository institutions and their non-bank affiliates are regulated by the Federal Reserve Board, and are generally required to be on arm’s-length terms. See also “Managing Global Risk—Liquidity Risk” above.
COMPETITION
The financial services industry is highly competitive. Citi’s competitors include a variety of financial services and advisory companies. Citi competes for clients and capital (including deposits and funding in the short- and long-term debt markets) with some of these competitors globally and with others on a regional or product basis. Citi’s competitive position depends on many factors, including, among others, the value of Citi’s brand name, reputation, the types of clients and geographies served; the quality, range, performance, innovation and pricing of products and services; the effectiveness of and access to distribution channels, technology advances, customer service and convenience; the effectiveness of transaction execution, interest rates and lending limits; and regulatory constraints. Citi’s ability to compete effectively also depends upon its ability to attract new employees and retain and motivate existing employees, while managing compensation and other costs. For additional information on competitive factors and uncertainties impacting Citi’s businesses, see “Risk Factors—Operational Risks” above.
PROPERTIES
Citi’s principal executive offices are currently in New York City at 388 Greenwich Street and are owned and fully occupied by Citi.
Citigroup Global Markets Holdings Inc.’s principal executive offices are in New York City at 388 Greenwich Street and 390 Greenwich Street. Both locations are owned and fully occupied by Citi.
Citigroup’s principal executive offices in EMEA are at 25 and 33 Canada Square in London’s Canary Wharf, with both buildings subject to long-term leases.
In Asia, Citi’s principal executive offices are in leased premises at Champion Tower in Hong Kong. Citi has other significant leased premises, including in Singapore, Kuala Lumpur, Manila and Japan. Citi has major or full ownership interests in country headquarter locations in Shanghai, Seoul and Mumbai.
Citi’s principal executive offices in Mexico, which also serve as the headquarters of Citibanamex, are in Mexico City. Citi’s principal executive offices for Latin America (other than Mexico) are in leased premises in Miami.
Citi also owns or leases over 55 million square feet of real estate in 95 countries, consisting of over 7,700 properties.
Citi continues to evaluate its global real estate footprint and space requirements and may determine from time to time that certain of its premises are no longer necessary. There is no assurance that Citi will be able to dispose of any excess premises or that it will not incur charges in connection with such dispositions, which could be material to Citi’s operating results in a given period.
Citi has developed programs for its properties to achieve long-term energy efficiency objectives and reduce its greenhouse gas emissions to lessen its impact on climate change. These activities could help to mitigate, but will not eliminate, Citi’s potential risk from future climate change regulatory requirements.
For further information concerning leases, see Note 26 to the Consolidated Financial Statements.
DISCLOSURE PURSUANT TO SECTION 219 OF THE IRAN THREAT REDUCTION AND SYRIA HUMAN RIGHTS ACT
Pursuant to Section 219 of the Iran Threat Reduction and Syria Human Rights Act of 2012 (Section 219), which added Section 13(r) to the Securities Exchange Act of 1934, as amended, Citi is required to disclose in its annual or quarterly reports, as applicable, whether it or any of its affiliates knowingly engaged in certain activities, transactions or dealings relating to Iran or with individuals or entities that are subject to sanctions under U.S. law. Disclosure is generally required even where the activities, transactions or dealings were conducted in compliance with applicable law. Citi, in its related quarterly report on Form 10-Q, previously disclosed reportable activities pursuant to Section 219 for the first, second and third quarters of 2017.
During the fourth quarter of 2017, Bank Handlowy w Warszawie S.A., a Citibank subsidiary located in Poland, processed two funds transfers involving the Iranian Embassy in Poland. The value of both funds transfers was EUR 60 each for a total of EUR 120 (approximately $70.48 per transfer for a total of $140.96). These payments were for visa-related fees, which are permissible under the travel exemption in the Iranian Transactions and Sanctions Regulations. Bank Handlowy w Warszawie realized EUR 2.36 (approximately $2.93) in fees for processing a foreign currency payment.
UNREGISTERED SALES OF EQUITY, PURCHASES OF EQUITY SECURITIES, DIVIDENDS
Unregistered Sales of Equity Securities
None.
Equity Security Repurchases
The following table summarizes Citi’s equity security repurchases, which consisted entirely of common stock repurchases, during the three months ended December 31, 2017:
|
|
|
|
|
|
|
|
|
|
In millions, except per share amounts |
Total shares
purchased
|
Average
price paid
per share
|
Approximate dollar
value of shares that
may yet be purchased
under the plan or
programs
|
October 2017 |
|
|
|
Open market repurchases(1)
|
24.0 |
|
$ |
73.69 |
|
$ |
8,342 |
|
Employee transactions(2)
|
— |
|
— |
|
N/A |
|
November 2017 |
|
|
|
Open market repurchases(1)
|
25.3 |
|
72.63 |
|
6,504 |
|
Employee transactions(2)
|
— |
|
— |
|
N/A |
|
December 2017 |
|
|
|
Open market repurchases(1)
|
24.9 |
|
75.50 |
|
4,625 |
|
Employee transactions(2)
|
— |
|
— |
|
N/A |
|
Total for 4Q17 and remaining program balance as of December 31, 2017 |
74.2 |
|
$ |
73.94 |
|
$ |
4,625 |
|
|
|
(1) |
Represents repurchases under the $15.6 billion 2017 common stock repurchase program (2017 Repurchase Program) that was approved by Citigroup’s Board of Directors and announced on June 28, 2017. The 2017 Repurchase Program was part of the planned capital actions included by Citi in its 2017 Comprehensive Capital Analysis and Review (CCAR). Shares repurchased under the 2017 Repurchase Program were added to treasury stock. |
|
|
(2) |
Consisted of shares added to treasury stock related to (i) certain activity on employee stock option program exercises where the employee delivers existing shares to cover the option exercise, or (ii) under Citi’s employee restricted or deferred stock programs where shares are withheld to satisfy tax requirements. |
N/A Not applicable
Dividends
In addition to Board of Directors’ approval, Citi’s ability to pay common stock dividends substantially depends on regulatory approval, including an annual regulatory review of the results of the CCAR process required by the Federal Reserve Board and the supervisory stress tests required under the Dodd-Frank Act. For additional information regarding Citi’s capital planning and stress testing, see “Capital Resources—Current Regulatory Capital Standards—Stress Testing Component of Capital Planning” and “Risk Factors—Strategic Risks” above. Any dividend on Citi’s outstanding common stock would also need to be made in compliance with Citi’s obligations to its outstanding preferred stock.
For information on the ability of Citigroup’s subsidiary depository institutions to pay dividends, see Note 18 to the Consolidated Financial Statements.
PERFORMANCE GRAPH
Comparison of Five-Year Cumulative Total Return
The following graph and table compare the cumulative total return on Citi’s common stock, which is listed on the NYSE under the ticker symbol “C” and held by X common stockholders of record as of January 31, 2018, with the cumulative total return of the S&P 500 Index and the S&P Financial Index over the five-year period through December 31, 2017. The graph and table assume that $100 was invested on December 31, 2012 in Citi’s common stock, the S&P 500 Index and the S&P Financial Index, and that all dividends were reinvested.
|
|
|
Comparison of Five-Year Cumulative Total Return
For the years ended
|
|
|
|
|
|
|
|
|
DATE |
CITI |
S&P 500 |
S&P FINANCIALS |
31-Dec-2012 |
100.0 |
|
100.0 |
|
100.0 |
|
31-Dec-2013 |
131.8 |
|
132.4 |
|
135.6 |
|
31-Dec-2014 |
137.0 |
|
150.5 |
|
156.2 |
|
31-Dec-2015 |
131.4 |
|
152.6 |
|
153.9 |
|
31-Dec-2016 |
152.3 |
|
170.8 |
|
188.9 |
|
|
31-Dec-2017
|
193.5 |
|
208.1 |
|
230.9 |
|
CORPORATE INFORMATION
CITIGROUP EXECUTIVE OFFICERS
Citigroup’s executive officers as of February 23, 2018 are:
|
|
|
|
Name |
Age |
Position and office held |
Raja J. Akram |
45 |
Controller and Chief Accounting Officer |
Francisco Aristeguieta |
52 |
CEO, Asia Pacific |
Stephen Bird |
51 |
CEO, Global Consumer Banking |
Don Callahan |
61 |
Head of Operations and Technology |
Michael L. Corbat |
57 |
Chief Executive Officer |
James C. Cowles |
62 |
CEO, Europe, Middle East and Africa |
Barbara Desoer |
65 |
CEO, Citibank, N.A. |
James A. Forese |
55 |
President;
CEO, Institutional Clients Group
|
Jane Fraser |
50 |
CEO, Latin America |
John C. Gerspach |
64 |
Chief Financial Officer |
Bradford Hu |
54 |
Chief Risk Officer |
William J. Mills |
62 |
CEO, North America |
J. Michael Murray |
53 |
Head of Human Resources |
Rohan Weerasinghe |
67 |
General Counsel and Corporate Secretary |
Each executive officer has held executive or management positions with Citigroup for at least five years, except that:
|
|
• |
Mr. Akram joined Citi in 2006 and assumed his current position in November 2017. Previously, he had served as Deputy Controller since April 2017. He held a number of other roles in Citi Finance, including Lead Finance Officer for Treasury and Trade Solutions, Brazil Country Controller, Brazil Country Finance Officer and head of the Corporate Accounting Policy team supporting M&A activities. |
|
|
• |
Ms. Desoer joined Citibank, N.A. as Chief Operating Officer in October 2013 and assumed her current position in April 2014. Prior to joining Citi, Ms. Desoer had a 35-year career at Bank of America, where she was President, Bank of America Home Loans, a Global Technology & Operations Executive, and President, Consumer Products, among other roles. |
Code of Conduct, Code of Ethics
Citi has a Code of Conduct that maintains its commitment to the highest standards of conduct. The Code of Conduct is supplemented by a Code of Ethics for Financial Professionals (including accounting, controllers, financial reporting operations, financial planning and analysis, treasury, tax, strategy and M&A, investor relations and regional/product finance professionals and administrative staff) that applies worldwide. The Code of Ethics for Financial Professionals applies to Citi’s principal executive officer, principal financial officer and principal accounting officer. Amendments and waivers, if any, to the Code of Ethics for Financial Professionals will be disclosed on Citi’s website, www.citigroup.com.
Both the Code of Conduct and the Code of Ethics for Financial Professionals can be found on the Citi website by clicking on “About Us,” and then “Corporate Governance.” Citi’s Corporate Governance Guidelines can also be found there, as well as the charters for the Audit Committee, the Ethics and Culture Committee, the Nomination, Governance and Public Affairs Committee, the Operations and Technology Committee, the Personnel and Compensation Committee and the Risk Management Committee of the Board. These materials are also available by writing to Citigroup Inc., Corporate Governance, 601 Lexington Avenue, 19th Floor, New York, New York 10022.
CITIGROUP BOARD OF DIRECTORS
|
|
|
|
|
|
Michael L. Corbat
Chief Executive Officer
Citigroup Inc.
Ellen M. Costello
Former President, CEO,
BMO Financial Corporation, and Former U.S. Country Head
BMO Financial Group
John C. Dugan
Former Chairman
Financial Institutions Group
Covington & Burling LLP
Duncan P. Hennes
Co-Founder and Partner of
Atrevida Partners, LLC
|
Peter Blair Henry
Dean Emeritus and W. R. Berkley Professor of Economics and Finance
New York University
Leonard N. Stern School of Business
Franz B. Humer
Former Chairman
Roche Holding Ltd.
S. Leslie Ireland
Former Assistant Secretary for Intelligence and Analysis
U.S. Department of the Treasury
Renée J. James
Chairman and CEO
Ampere Computing and Operating Executive
The Carlyle Group
|
Eugene M. McQuade
Former Vice Chairman
Citigroup Inc. and
Former Chief Executive Officer Citibank, N.A.
Michael E. O’Neill
Chairman
Citigroup Inc.
Gary M. Reiner
Operating Partner
General Atlantic LLC
Anthony M. Santomero
Former President
Federal Reserve Bank of
Philadelphia
|
Diana L. Taylor
Vice Chair
Solera Capital, LLC
James S. Turley
Former Chairman and CEO
Ernst & Young
Deborah C. Wright
Former Chairman
Carver Bancorp, Inc.
Ernesto Zedillo Ponce de Leon
Director, Center for the
Study of Globalization and
Professor in the Field
of International
Economics and Politics,
Yale University
|
Signatures
Pursuant to the requirements of Section 13 or 15(d) of the Securities Exchange Act of 1934, the registrant has duly caused this report to be signed on its behalf by the undersigned, thereunto duly authorized, on the 23rd day of February, 2018.
Citigroup Inc.
(Registrant)
/s/ John C. Gerspach
John C. Gerspach
Chief Financial Officer
Pursuant to the requirements of the Securities Exchange Act of 1934, this report has been signed below by the following persons on behalf of the registrant and in the capacities indicated on the 23rd day of February, 2018.
Citigroup’s Principal Executive Officer and a Director:
/s/ Michael L. Corbat
Michael L. Corbat
Citigroup’s Principal Financial Officer:
/s/ John C. Gerspach
John C. Gerspach
Citigroup’s Principal Accounting Officer:
/s/ Raja J. Akram
Raja J. Akram
The Directors of Citigroup listed below executed a power of attorney appointing John C. Gerspach their attorney-in-fact, empowering him to sign this report on their behalf.
|
|
|
Ellen M. Costello |
Michael E. O’Neill |
John C. Dugan |
Anthony M. Santomero |
Duncan P. Hennes |
Diana L. Taylor
|
Peter Blair Henry |
James S. Turley |
Franz B. Humer |
Deborah C. Wright |
S. Leslie Ireland |
Ernesto Zedillo Ponce de Leon |
Eugene M. McQuade |
|
/s/ John C. Gerspach
John C. Gerspach
EXHIBIT INDEX
|
|
|
|
Exhibit |
|
|
Number |
|
Description of Exhibit |
|
|
|
|
|
|
|
|
|
|
|
|
|
|
|
|
|
|
|
|
|
|
|
|
|
|
|
|
|
|
|
|
|
|
|
|
|
|
|
|
|
|
|
|
|
|
|
|
|
|
|
|
|
|
|
|
|
|
|
|
4.09 |
|
Indenture, dated as of March 15, 1987, between Primerica Corporation, a New Jersey corporation, and The Bank of New York, as trustee, incorporated by reference to Exhibit 4.01 to the Company’s Registration Statement on Form S-3 filed December 8, 1992 (No. 03355542). |
|
|
|
4.10 |
|
First Supplemental Indenture, dated as of December 15, 1988, among Primerica Corporation, Primerica Holdings, Inc. and The Bank of New York, as trustee, incorporated by reference to Exhibit 4.02 to the Company’s Registration Statement on Form S-3 filed December 8, 1992 (No. 03355542). |
|
|
|
|
|
|
|
4.11 |
|
Second Supplemental Indenture, dated as of January 31, 1991, between Primerica Holdings, Inc. and The Bank of New York, as trustee, incorporated by reference to Exhibit 4.03 to the Company’s Registration Statement on Form S-3 filed December 8, 1992 (No. 03355542). |
|
|
|
4.12 |
|
Third Supplemental Indenture, dated as of December 9, 1992, among Primerica Holdings, Inc., Primerica Corporation and The Bank of New York, as trustee, incorporated by reference to Exhibit 5 to the Company’s Form 8-A dated December 21, 1992, with respect to its 7 3/4% Notes Due June 15, 1999 (No. 001-09924). |
|
|
|
|
|
|
|
|
|
|
|
|
|
|
|
|
|
|
|
|
|
|
|
|
|
|
|
|
|
|
|
|
|
|
|
|
|
|
|
|
|
|
|
|
|
|
|
|
|
|
|
|
|
|
|
|
|
|
|
|
|
|
|
|
|
|
|
|
|
|
|
|
|
|
|
|
|
|
|
|
|
|
|
|
|
|
|
|
|
|
|
|
|
|
|
|
|
|
|
|
|
|
|
|
|
|
|
|
|
|
|
|
|
|
|
|
|
|
|
|
|
|
|
|
|
|
|
|
|
|
|
|
|
|
|
|
|
|
|
|
|
|
|
|
|
|
|
|
|
|
|
|
|
|
|
|
|
|
|
|
|
|
|
|
|
|
|
|
|
10.09.1* |
|
Citicorp Deferred Compensation Plan, effective October 1995, incorporated by reference to Exhibit 10 to Citicorp’s Registration Statement on Form S-8 filed February 15, 1996 (File No. 333-00983). |
|
|
|
The total amount of securities authorized pursuant to any instrument defining rights of holders of long-term debt of the Company does not exceed 10% of the total assets of the Company and its consolidated subsidiaries. The Company will furnish copies of any such instrument to the SEC upon request.
Copies of any of the exhibits referred to above will be furnished at a cost of $0.25 per page (although no charge will be made for the 2017 Annual Report on Form 10-K) to security holders who make written request to Citigroup Inc., Corporate Governance, 153 East 53rd Street, 19th Floor, New York, New York 10022.
* Denotes a management contract or compensatory plan or arrangement.
+ Filed herewith.