Citigroup Inc 8-K 2020-10-13
Sign in or join
Add a note by highlighting text or Replying to an existing note.
Add a note by highlighting text or Replying to an existing note.
Exhibit 99.1
|
For Immediate Release Citigroup Inc. (NYSE: C) October 13, 2020 |
|
|
|
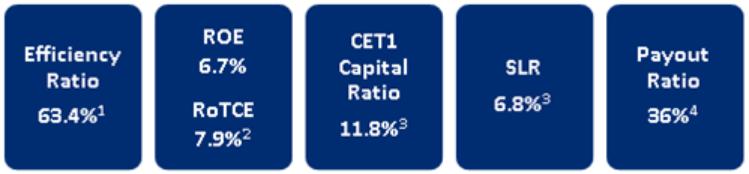
THIRD QUARTER 2020 RESULTS AND KEY METRICS
|
|
CEO COMMENTARY |
|
NET INCOME OF $3.2 BILLION ($1.40 PER SHARE) REVENUES OF $17.3 BILLION RETURNED $1.1 BILLION OF CAPITAL TO COMMON SHAREHOLDERS THROUGH DIVIDENDS BOOK VALUE PER SHARE OF $84.48 TANGIBLE BOOK VALUE PER SHARE OF $71.955 New York, October 13, 2020 – Citigroup Inc. today reported net income for the third quarter 2020 of $3.2 billion, or $1.40 per diluted share, on revenues of $17.3 billion. This compared to net income of $4.9 billion, or $2.07 per diluted share, on revenues of $18.6 billion for the third quarter 2019. Revenues decreased 7% from the prior-year period, primarily reflecting lower revenues in Global Consumer Banking (GCB) and Corporate / Other, partially offset by growth in Fixed Income Markets, Investment Banking, Equity Markets and the Private Bank in the Institutional Clients Group (ICG). Net income declined 34% from the prior-year period, largely driven by the lower revenues, an increase in expenses and higher credit costs. Results include a $400 million civil money penalty in connection with consent orders recorded in Corporate / Other. Earnings per share of $1.40 decreased 32% from the prior-year period, primarily reflecting the decline in net income. Percentage comparisons throughout this press release are calculated for the third quarter 2020 versus the third quarter 2019, unless otherwise specified. |
|
Michael Corbat, Citi CEO, said, “We continue to navigate the effects of the COVID-19 pandemic extremely well. Credit costs have stabilized; deposits continued to increase; and revenues are up 3% year-to-date. Our Institutional Clients Group again had very strong performance, especially in Markets, Investment Banking and the Private Bank. The backbone of our global network, Treasury and Trade Solutions experienced strong client engagement in the face of low interest rates. Although Global Consumer Banking revenues remained lower as a result of the pandemic, we did see higher activity in our mortgage and wealth management products. “Our capital position strengthened during the quarter with our Common Equity Tier 1 ratio increasing to 11.8% and our Tangible Book Value per share increasing to $71.95. We remain committed to returning capital to our shareholders, subject to the industry-wide approach determined by the Federal Reserve. “We are committed to thoroughly addressing the issues contained in the Consent Orders we entered into last week with the Federal Reserve and the Office of the Comptroller of the Currency. These investments will not only further enhance our safety and soundness, they will result in a digital infrastructure that will improve our ability to serve our clients and customers and make us more competitive,” Mr. Corbat concluded. |
1
Citigroup |
|
3Q'20 |
|
2Q'20 |
|
3Q'19 |
|
QoQ% |
|
YoY% |
||||||||||||
Global Consumer Banking |
|
7,173 |
|
7,339 |
|
8,289 |
|
(2)% |
|
(13)% |
||||||||||||
Institutional Clients Group |
|
10,353 |
|
12,137 |
|
9,851 |
|
(15)% |
|
5% |
||||||||||||
Corporate / Other |
|
(224) |
|
290 |
|
434 |
|
NM |
|
NM |
||||||||||||
Total Revenues |
|
$ |
17,302 |
|
$ |
19,766 |
|
$ |
18,574 |
|
(12)% |
|
(7)% |
|||||||||
|
|
|
|
|
|
|
|
|
|
|
||||||||||||
Expenses |
|
$ |
10,964 |
|
$ |
10,415 |
|
$ |
10,464 |
|
5% |
|
5% |
|||||||||
|
|
|
|
|
|
|
|
|
|
|
||||||||||||
Net Credit Losses |
|
1,919 |
|
2,206 |
|
1,913 |
|
(13)% |
|
- |
||||||||||||
Net ACL Build / (Release)(a) |
|
314 |
|
5,603 |
|
158 |
|
(94)% |
|
99% |
||||||||||||
Other Provisions(b) |
|
29 |
|
94 |
|
17 |
|
(69)% |
|
71% |
||||||||||||
Total Cost of Credit |
|
$ |
2,262 |
|
$ |
7,903 |
|
$ |
2,088 |
|
(71)% |
|
8% |
|||||||||
|
|
|
|
|
|
|
|
|
|
|
||||||||||||
Income from Continuing Operations Before Taxes |
|
$ |
4,076 |
|
$ |
1,448 |
|
$ |
6,022 |
|
NM |
|
(32)% |
|||||||||
Provision for Income Taxes |
|
815 |
|
131 |
|
1,079 |
|
NM |
|
(24)% |
||||||||||||
Income from Continuing Operations |
|
$ |
3,261 |
|
$ |
1,317 |
|
$ |
4,943 |
|
NM |
|
(34)% |
|||||||||
Net Income (Loss) from Discontinued Operations |
|
(7) |
|
(1) |
|
(15) |
|
NM |
|
53% |
||||||||||||
Non-Controlling Interest |
|
24 |
|
- |
|
15 |
|
NM |
|
60% |
||||||||||||
Citigroup Net Income |
|
$ |
3,230 |
|
$ |
1,316 |
|
$ |
4,913 |
|
NM |
|
(34)% |
|||||||||
|
|
|
|
|
|
|
|
|
|
|
||||||||||||
|
|
|
|
|
|
|
|
|
|
|
||||||||||||
Revenues |
|
|
|
|
|
|
|
|
|
|
||||||||||||
North America |
|
8,447 |
|
9,729 |
|
8,423 |
|
(13)% |
|
- |
||||||||||||
EMEA |
|
3,085 |
|
3,392 |
|
3,138 |
|
(9)% |
|
(2)% |
||||||||||||
Latin America |
|
2,168 |
|
2,257 |
|
2,563 |
|
(4)% |
|
(15)% |
||||||||||||
Asia |
|
3,826 |
|
4,098 |
|
4,016 |
|
(7)% |
|
(5)% |
||||||||||||
Corporate / Other |
|
(224) |
|
290 |
|
434 |
|
NM |
|
NM |
||||||||||||
|
|
|
|
|
|
|
|
|
|
|
||||||||||||
|
|
|
|
|
|
|
|
|
|
|
||||||||||||
EOP Assets ($B) |
|
2,234 |
|
2,233 |
|
2,015 |
|
- |
|
11% |
||||||||||||
EOP Loans ($B) |
|
667 |
|
685 |
|
692 |
|
(3)% |
|
(4)% |
||||||||||||
EOP Deposits ($B) |
|
1,263 |
|
1,234 |
|
1,088 |
|
2% |
|
16% |
||||||||||||
|
|
|
|
|
|
|
|
|
|
|
||||||||||||
|
|
|
|
|
|
|
|
|
|
|
||||||||||||
Common Equity Tier 1 Capital Ratio(3) |
|
11.8% |
|
11.6% |
|
11.6% |
|
|
|
|
||||||||||||
Supplementary Leverage Ratio(3) |
|
6.8% |
|
6.7% |
|
6.3% |
|
|
|
|
||||||||||||
Return on Average Common Equity |
|
6.7% |
|
2.4% |
|
10.4% |
|
|
|
|||||||||||||
Book Value per Share |
|
$ |
84.48 |
|
$ |
83.41 |
|
$ |
81.02 |
|
1% |
|
4% |
|||||||||
Tangible Book Value per Share |
|
$ |
71.95 |
|
$ |
71.15 |
|
$ |
69.03 |
|
1% |
|
4% |
|||||||||
Note: Please refer to the Appendices and Footnotes at the end of this press release for additional information.
(a) Includes credit reserve build / (release) for loans and provision for credit losses on unfunded lending commitments.
(b) Includes provisions for benefits and claims, HTM debt securities and other assets.
Citigroup
Citigroup revenues of $17.3 billion in the third quarter 2020 decreased 7%, primarily reflecting the lower revenues in GCB and Corporate / Other, partially offset by the higher revenues in Fixed Income Markets, Investment Banking, Equity Markets and the Private Bank.
Citigroup operating expenses of $11.0 billion in the third quarter 2020 increased 5%, as the civil money penalty, investments in infrastructure, risk management and controls, higher compensation and COVID-19 related expenses more than offset efficiency savings and reductions in marketing and other discretionary spending.
Citigroup cost of credit of $2.3 billion in the third quarter 2020 increased 8%, largely reflecting an increase in ICG allowance for credit loss (ACL) reserves, partially offset by decreases in GCB and Corporate / Other.
Citigroup net income of $3.2 billion in the third quarter 2020 declined 34%, driven by the lower revenues, the higher expenses, the higher cost of credit and a higher effective tax rate. Citigroup’s effective tax rate was 20% in the current quarter compared to 18% in the third quarter 2019, reflecting the impact of the non-deductible civil money penalty this quarter.
2
Citigroup’s allowance for credit losses on loans was $26.4 billion at quarter end, or 4.00% of total loans, compared to $12.5 billion, or 1.82% of total loans, at the end of the prior-year period. Total non-accrual assets grew 40% from the prior-year period to $5.3 billion. Consumer non-accrual loans declined 9% to $1.7 billion, while corporate non-accrual loans of $3.6 billion increased 94% from the prior-year period.
Citigroup’s end-of-period loans were $667 billion as of quarter end, down 4% from the prior-year period, as reported and excluding the impact of foreign exchange translation6, driven by declines across GCB and ICG, and the continued wind-down of legacy assets in Corporate / Other.
Citigroup’s end-of-period deposits were $1.3 trillion as of quarter end, an increase of 16% from the prior-year period, as reported and in constant dollars6, driven by a 17% increase in GCB and a 16% increase in ICG.
Citigroup’s book value per share of $84.48 and tangible book value per share of $71.95 each increased 4% versus the prior-year period, driven by net income. At quarter end, Citigroup’s CET1 Capital ratio was 11.8%, up from the prior quarter, driven by net income, partially offset by an increase in risk-weighted assets. Citigroup’s SLR for the third quarter 2020 was 6.8%, an increase from the prior quarter. During the quarter, Citigroup returned a total of $1.1 billion to common shareholders in the form of dividends.
3
|
Global Consumer Banking ($ in millions, except as otherwise noted) |
|
3Q'20 |
|
2Q'20 |
|
3Q'19 |
|
QoQ% |
|
YoY% |
|||
North America |
|
4,527 |
|
4,742 |
|
5,179 |
|
(5)% |
|
(13)% |
|||
Latin America |
|
|
1,027 |
|
|
1,050 |
|
|
1,269 |
|
(2)% |
|
(19)% |
Asia(a) |
|
|
1,619 |
|
|
1,547 |
|
|
1,841 |
|
5% |
|
(12)% |
Total Revenues |
|
$ |
7,173 |
|
$ |
7,339 |
|
$ |
8,289 |
|
(2)% |
|
(13)% |
|
|
|
|
|
|
|
|
|
|
|
|
|
|
Expenses |
|
$ |
4,217 |
|
$ |
4,013 |
|
$ |
4,368 |
|
5% |
|
(3)% |
|
|
|
|
|
|
|
|
|
|
|
|
|
|
Net Credit Losses |
|
|
1,598 |
|
|
1,887 |
|
|
1,802 |
|
(15)% |
|
(11)% |
Net ACL Build / (Release)(b) |
|
|
(83) |
|
|
1,960 |
|
|
131 |
|
NM |
|
NM |
Other Provisions(c) |
|
|
45 |
|
|
38 |
|
|
17 |
|
18% |
|
NM |
Total Cost of Credit |
|
$ |
1,560 |
|
$ |
3,885 |
|
$ |
1,950 |
|
(60)% |
|
(20)% |
|
|
|
|
|
|
|
|
|
|
|
|
|
|
Net Income (Loss) |
|
$ |
1,058 |
|
$ |
(396) |
|
$ |
1,501 |
|
NM |
|
(30)% |
|
|
|
|
|
|
|
|
|
|
|
|
|
|
|
|
|
|
|
|
|
|
|
|
|
|
|
|
Retail Banking |
|
|
2,916 |
|
|
2,836 |
|
|
3,117 |
|
3% |
|
(6)% |
Cards |
|
|
4,257 |
|
|
4,503 |
|
|
5,172 |
|
(5)% |
|
(18)% |
Total Revenues |
|
$ |
7,173 |
|
$ |
7,339 |
|
$ |
8,289 |
|
(2)% |
|
(13)% |
|
|
|
|
|
|
|
|
|
|
|
|
|
|
|
|
|
|
|
|
|
|
|
|
|
|
|
|
Key Indicators ($B) |
|
|
|
|
|
|
|
|
|
|
|
|
|
Retail Banking Average Loans |
|
|
126 |
|
|
122 |
|
|
120 |
|
3% |
|
5% |
Retail Banking Average Deposits |
|
|
320 |
|
|
302 |
|
|
277 |
|
6% |
|
16% |
Investment AUMs |
|
|
199 |
|
|
187 |
|
|
193 |
|
7% |
|
3% |
Cards Average Loans |
|
|
147 |
|
|
150 |
|
|
165 |
|
(2)% |
|
(11)% |
Cards Purchase Sales |
|
|
127 |
|
|
108 |
|
|
142 |
|
17% |
|
(10)% |
Note: Please refer to the Appendices and Footnotes at the end of this press release for additional information.
(a) Asia GCB includes the results of operations of GCB activities in certain EMEA countries for all periods presented.
(b) Includes credit reserve build / (release) for loans and provision for credit losses on unfunded lending commitments.
(c) Includes provisions for benefits and claims, HTM debt securities and other assets.
Global Consumer Banking
GCB revenues of $7.2 billion decreased 13% on a reported basis and 12% in constant dollars, as strong deposit growth and momentum in Asia wealth management was more than offset by lower card volumes and lower interest rates across all regions, reflecting continued impact from the COVID-19 pandemic.
North America GCB revenues of $4.5 billion decreased 13%. Citi-Branded Cards revenues of $2.1 billion decreased 12%, reflecting lower purchase sales and higher payment rates driving lower average loans. Citi Retail Services revenues of $1.4 billion decreased 21%, reflecting lower average loans as well as higher partner payments. Retail Banking revenues of $1.1 billion decreased 2%, as the benefit of stronger deposit volumes and an improvement in mortgage revenues were more than offset by lower deposit spreads.
Latin America GCB revenues of $1.0 billion declined 19% on a reported basis and 10% in constant dollars, driven by lower average loans and lower interest rates, partially offset by strong deposit growth.
Asia GCB revenues of $1.6 billion declined 12% on a reported basis and 13% in constant dollars, as lower card purchase sales and lower interest rates were partially offset by strong investment revenues.
GCB operating expenses of $4.2 billion decreased 3% on a reported basis and 2% in constant dollars, as lower volume-related expenses, reductions in marketing and other discretionary spending and efficiency savings were partially offset by increases in COVID-19 related expenses.
GCB cost of credit of $1.6 billion decreased 20% on a reported basis and 19% in constant dollars, including an ACL release driven by reduced loan volumes and lower net credit losses given high levels of liquidity in the U.S., lower spending and the benefits of relief programs.
4
GCB net income of $1.1 billion declined 30% from the prior-year period on a reported basis and 29% in constant dollars, driven by the lower revenues, partially offset by the lower cost of credit and the lower expenses.
Institutional Clients Group |
|
3Q'20 |
|
2Q'20 |
|
3Q'19 |
|
QoQ% |
|
YoY% |
|||
Treasury & Trade Solutions |
|
|
2,394 |
|
|
2,307 |
|
|
2,559 |
|
4% |
|
(6)% |
Investment Banking |
|
|
1,387 |
|
|
1,759 |
|
|
1,228 |
|
(21)% |
|
13% |
Private Bank(a) |
|
|
938 |
|
|
956 |
|
|
867 |
|
(2)% |
|
8% |
Corporate Lending(a) |
|
|
538 |
|
|
646 |
|
|
715 |
|
(17)% |
|
(25)% |
Total Banking |
|
|
5,257 |
|
|
5,668 |
|
|
5,369 |
|
(7)% |
|
(2)% |
Fixed Income Markets |
|
|
3,788 |
|
|
5,595 |
|
|
3,211 |
|
(32)% |
|
18% |
Equity Markets |
|
|
875 |
|
|
770 |
|
|
760 |
|
14% |
|
15% |
Securities Services |
|
|
631 |
|
|
619 |
|
|
664 |
|
2% |
|
(5)% |
Other |
|
|
(74) |
|
|
(84) |
|
|
(120) |
|
12% |
|
38% |
Total Markets & Securities Services |
|
|
5,220 |
|
|
6,900 |
|
|
4,515 |
|
(24)% |
|
16% |
Product Revenues(a) |
|
$ |
10,477 |
|
$ |
12,568 |
|
$ |
9,884 |
|
(17)% |
|
6% |
Gain / (Loss) on Loan Hedges |
|
|
(124) |
|
|
(431) |
|
|
(33) |
|
71% |
|
NM |
Total Revenues |
|
$ |
10,353 |
|
$ |
12,137 |
|
$ |
9,851 |
|
(15)% |
|
5% |
|
|
|
|
|
|
|
|
|
|
|
|
|
|
Expenses |
|
$ |
5,778 |
|
$ |
5,933 |
|
$ |
5,611 |
|
(3)% |
|
3% |
|
|
|
|
|
|
|
|
|
|
|
|
|
|
Net Credit Losses |
|
|
326 |
|
|
324 |
|
|
110 |
|
1% |
|
NM |
Net ACL Build / (Release)(b) |
|
|
529 |
|
|
3,477 |
|
|
43 |
|
(85)% |
|
NM |
Other Provisions(c) |
|
|
(17) |
|
|
53 |
|
|
- |
|
NM |
|
NM |
Total Cost of Credit |
|
$ |
838 |
|
$ |
3,854 |
|
$ |
153 |
|
(78)% |
|
NM |
|
|
|
|
|
|
|
|
|
|
|
|
|
|
Net Income |
|
$ |
2,895 |
|
$ |
1,875 |
|
$ |
3,221 |
|
54% |
|
(10)% |
|
|
|
|
|
|
|
|
|
|
|
|
|
|
|
|
|
|
|
|
|
|
|
|
|
|
|
|
Revenues |
|
|
|
|
|
|
|
|
|
|
|
|
|
North America |
|
|
3,920 |
|
|
4,987 |
|
|
3,244 |
|
(21)% |
|
21% |
EMEA |
|
|
3,085 |
|
|
3,392 |
|
|
3,138 |
|
(9)% |
|
(2)% |
Latin America |
|
|
1,141 |
|
|
1,207 |
|
|
1,294 |
|
(5)% |
|
(12)% |
Asia |
|
|
2,207 |
|
|
2,551 |
|
|
2,175 |
|
(13)% |
|
1% |
Note: Please refer to the Appendices and Footnotes at the end of this press release for additional information.
(a) Excludes gain / (loss) on credit derivatives as well as the mark-to-market on loans at fair value. For additional information, please refer to Footnote 7.
(b) Includes credit reserve build / (release) for loans and provision for credit losses on unfunded lending commitments.
(c) Includes provisions for benefits and claims, HTM debt securities and other assets.
Institutional Clients Group
ICG revenues of $10.4 billion increased 5%, as strong performance in Fixed Income Markets, Investment Banking, Equity Markets and the Private Bank was partially offset by lower revenues in Corporate Lending, Treasury and Trade Solutions and Securities Services.
Banking revenues of $5.1 billion decreased 4% versus the prior year (including gain / (loss) on loan hedges)7. Treasury and Trade Solutions revenues of $2.4 billion declined 6% on a reported basis and 4% in constant dollars, as strong client engagement and growth in deposits were more than offset by the impact of lower interest rates and reduced commercial card spend. Investment Banking revenues of $1.4 billion increased 13%, reflecting solid growth in capital markets, particularly in equity underwriting. Advisory revenues decreased 41% to $163 million, while equity underwriting revenues increased 96% to $484 million and debt underwriting revenues increased 5% to $740 million. Private Bank revenues of $938 million increased 8% (excluding gain / (loss) on loan hedges), driven by increased capital markets activity, improved managed investments revenues as well as higher lending and deposit volumes, partially offset by lower deposit spreads. Corporate Lending revenues of $538 million declined 25% (excluding gain / (loss) on loan hedges), as higher loan volumes were more than offset by lower spreads.
Markets and Securities Services revenues of $5.2 billion increased 16%. Fixed Income Markets revenues of $3.8 billion increased 18%, driven by strong performance across spread products and commodities. Equity Markets revenues of $875 million increased 15%, as solid performance in cash equities and derivatives was partially offset by lower revenues in prime finance. Securities Services revenues of $631 million decreased 5% on a reported basis and 4% in constant dollars, as higher deposit volumes were more than offset by lower spreads.
5
ICG net income of $2.9 billion decreased 10%, as the revenue growth was more than offset by higher cost of credit and expenses. ICG operating expenses increased 3% to $5.8 billion, driven by continued investments in infrastructure, risk management and controls, as well as higher compensation costs. ICG cost of credit included net credit losses of $326 million, compared to $110 million in the prior-year period, and an ACL build of $529 million compared to a build of $43 million in the prior-year period, reflecting the continuing uncertainty surrounding the macroeconomic outlook.
Corporate / Other |
|
3Q'20 |
|
2Q'20 |
|
3Q'19 |
|
QoQ% |
|
YoY% |
|||
Revenues |
|
$ |
(224) |
|
$ |
290 |
|
$ |
434 |
|
NM |
|
NM |
|
|
|
|
|
|
|
|
|
|
|
|
|
|
Expenses |
|
$ |
969 |
|
$ |
469 |
|
$ |
485 |
|
NM |
|
100% |
|
|
|
|
|
|
|
|
|
|
|
|
|
|
Net Credit Losses |
|
|
(5) |
|
|
(5) |
|
|
1 |
|
- |
|
NM |
Net ACL Build / (Release)(a) |
|
|
(132) |
|
|
166 |
|
|
(16) |
|
NM |
|
NM |
Other Provisions(b) |
|
|
1 |
|
|
3 |
|
|
- |
|
(67)% |
|
100% |
Total Cost of Credit |
|
$ |
(136) |
|
$ |
164 |
|
$ |
(15) |
|
NM |
|
NM |
|
|
|
|
|
|
|
|
|
|
|
|
|
|
Income (Loss) from Continuing Operations before Taxes |
|
$ |
(1,057) |
|
$ |
(343) |
|
$ |
(36) |
|
NM |
|
NM |
|
|
|
|
|
|
|
|
|
|
|
|
|
|
Income Taxes (Benefits) |
|
|
(341) |
|
|
(178) |
|
|
(247) |
|
(92)% |
|
(38)% |
|
|
|
|
|
|
|
|
|
|
|
|
|
|
Net Income (Loss) |
|
$ |
(723) |
|
$ |
(163) |
|
$ |
191 |
|
NM |
|
NM |
(a) Includes credit reserve build / (release) for loans and provision for credit losses on unfunded lending commitments.
(b) Includes provisions for benefits and claims, HTM debt securities and other assets.
Corporate / Other
Corporate / Other revenues of $(224) million compared to $434 million in the prior-year period, reflecting the wind-down of legacy assets, the impact of lower rates and marks on securities.
Corporate / Other expenses of $969 million increased significantly, as the wind-down of legacy assets was more than offset by the civil money penalty, investments in infrastructure, risk management and controls, and incremental costs associated with COVID-19.
Corporate / Other loss from continuing operations before taxes of $(1.1) billion compared to a loss of $(36) million in the prior-year period, driven by the lower revenues and the increased expenses, partially offset by a larger ACL release on the legacy portfolio.
6
Citigroup will host a conference call today at 10:00 AM (ET). A live webcast of the presentation, as well as financial results and presentation materials, will be available at https://www.citigroup.com/citi/investor. Dial-in numbers for the conference call are as follows: (866) 516-9582 in the U.S. and Canada; (973) 409-9210 outside of the U.S. and Canada. The conference code for both numbers is 9492234.
Additional financial, statistical and business-related information, as well as business and segment trends, is included in a Quarterly Financial Data Supplement. Both this earnings release and Citigroup’s Third Quarter 2020 Quarterly Financial Data Supplement are available on Citigroup’s website at www.citigroup.com.
Citigroup, the leading global bank, has approximately 200 million customer accounts and does business in more than 160 countries and jurisdictions. Citigroup provides consumers, corporations, governments and institutions with a broad range of financial products and services, including consumer banking and credit, corporate and investment banking, securities brokerage, transaction services, and wealth management.
Additional information may be found at www.citigroup.com | Twitter: @Citi | YouTube: www.youtube.com/citi | Blog: http://blog.citigroup.com | Facebook: www.facebook.com/citi | LinkedIn: www.linkedin.com/company/citi
Certain statements in this release are “forward-looking statements” within the meaning of the rules and regulations of the U.S. Securities and Exchange Commission (SEC). These statements are based on management’s current expectations and are subject to uncertainty and changes in circumstances. These statements are not guarantees of future results or occurrences. Actual results and capital and other financial condition may differ materially from those included in these statements due to a variety of factors. These factors include, among others, macroeconomic and other challenges and uncertainties related to the COVID-19 pandemic, such as the extent and duration of the impact on public health, the U.S. and global economies, financial markets and consumer and corporate customers and clients, including economic activity and employment, as well as the various actions taken in response by governments, central banks and others, including Citi, and the precautionary statements included in this release. These factors also consist of those contained in Citigroup’s filings with the SEC, including without limitation the “Risk Factors” section of Citigroup’s Second Quarter 2020 Form 10-Q and Citigroup’s 2019 Form 10- K. Any forward-looking statements made by or on behalf of Citigroup speak only as to the date they are made, and Citi does not undertake to update forward-looking statements to reflect the impact of circumstances or events that arise after the date the forward-looking statements were made.
Contacts: |
|
|
|
|
|
Press: |
Jennifer Lowney |
(212) 793-3141 |
Investors: |
Elizabeth Lynn |
(212) 559-2718 |
|
|
|
Fixed Income Investors: |
Thomas Rogers |
(212) 559-5091 |
7
Appendix A
Citigroup |
|
3Q'20 |
|
|
Net Income |
|
$ |
3,230 |
|
Less: Preferred Dividends |
|
|
284 |
|
Net Income to Common Shareholders |
|
$ |
2,946 |
|
|
|
|
|
|
Common Share Repurchases |
|
|
- |
|
Common Dividends |
|
|
1,074 |
|
Total Capital Returned to Common Shareholders |
|
$ |
1,074 |
|
|
|
|
|
|
Payout Ratio |
|
|
36% |
|
|
|
|
|
|
Average TCE |
|
$ |
148,970 |
|
|
|
|
|
|
RoTCE |
|
|
7.9% |
|
8
Appendix B
Citigroup |
|
3Q'20 |
|
3Q'19 |
||
Reported EOP Loans |
|
$ |
667 |
|
$ |
692 |
Impact of FX Translation |
|
|
- |
|
|
1 |
EOP Loans in Constant Dollars |
|
$ |
667 |
|
$ |
693 |
|
|
|
|
|
|
|
Reported EOP Deposits |
|
$ |
1,263 |
|
$ |
1,088 |
Impact of FX Translation |
|
|
- |
|
|
3 |
EOP Deposits in Constant Dollars |
|
$ |
1,263 |
|
$ |
1,090 |
Note: Totals may not sum due to rounding. |
|
|
|
|
|
|
|
|
|
|
|
|
|
Global Consumer Banking |
|
|
3Q'20 |
|
|
3Q'19 |
Reported Revenues |
|
$ |
7,173 |
|
$ |
8,289 |
Impact of FX Translation |
|
|
- |
|
|
(113) |
Revenues in Constant Dollars |
|
$ |
7,173 |
|
$ |
8,176 |
|
|
|
|
|
|
|
Reported Expenses |
|
$ |
4,217 |
|
$ |
4,368 |
Impact of FX Translation |
|
|
- |
|
|
(62) |
Expenses in Constant Dollars |
|
$ |
4,217 |
|
$ |
4,306 |
|
|
|
|
|
|
|
Reported Cost of Credit |
|
$ |
1,560 |
|
$ |
1,950 |
Impact of FX Translation |
|
|
- |
|
|
(28) |
Cost of Credit in Constant Dollars |
|
$ |
1,560 |
|
$ |
1,922 |
|
|
|
|
|
|
|
Reported Net Income |
|
$ |
1,058 |
|
$ |
1,501 |
Impact of FX Translation |
|
|
- |
|
|
(15) |
Net Income in Constant Dollars |
|
$ |
1,058 |
|
$ |
1,486 |
Note: Totals may not sum due to rounding. |
|
|
|
|
|
|
|
|
|
|
|
|
|
|
|
|
|
|
|
|
|
Latin America Consumer Banking ($in millions) |
|
|
3Q'20 |
|
|
3Q'19 |
Reported Revenues |
|
$ |
1,027 |
|
$ |
1,269 |
Impact of FX Translation |
|
|
- |
|
|
(128) |
Revenues in Constant Dollars |
|
$ |
1,027 |
|
$ |
1,141 |
Note: Totals may not sum due to rounding. |
|
|
|
|
|
|
|
|
|
|
|
|
|
|
Asia Consumer Banking(1) ($in millions) |
|
|
3Q'20 |
|
|
3Q'19 |
Reported Revenues |
|
$ |
1,619 |
|
$ |
1,841 |
Impact of FX Translation |
|
|
- |
|
|
15 |
Revenues in Constant Dollars |
|
$ |
1,619 |
|
$ |
1,856 |
Note: Totals may not sum due to rounding. |
|
|
|
|
|
|
(1) Asia GCB includes the results of operations in EMEA GCB for all periods presented. |
|
|
|
|
|
|
|
|
|
|
|
|
|
|
Treasury and Trade Solutions ($in millions) |
|
|
3Q'20 |
|
|
3Q'19 |
Reported Revenues |
|
$ |
2,394 |
|
$ |
2,559 |
Impact of FX Translation |
|
|
- |
|
|
(59) |
Revenues in Constant Dollars |
|
$ |
2,394 |
|
$ |
2,500 |
Note: Totals may not sum due to rounding. |
|
|
|
|
|
|
|
|
|
|
|
|
|
|
Securities Services ($in millions) |
|
|
3Q'20 |
|
|
3Q'19 |
Reported Revenues |
|
$ |
631 |
|
$ |
664 |
Impact of FX Translation |
|
|
- |
|
|
(8) |
Revenues in Constant Dollars |
|
$ |
631 |
|
$ |
656 |
Note: Totals may not sum due to rounding. |
|
|
|
|
|
|
9
Appendix C
($in millions) |
|
3Q'20(1) |
|
2Q'20 |
|
3Q'19 |
|||
|
|
|
|
|
|
|
|||
Citigroup Common Stockholders' Equity(2) |
|
$ |
176,047 |
|
$ |
173,793 |
|
$ |
177,052 |
Add: Qualifying noncontrolling interests |
|
|
141 |
|
|
145 |
|
|
145 |
Regulatory Capital Adjustments and Deductions: |
|
|
|
|
|
|
|
|
|
Add: CECL transition and 25% provision deferral(3) |
|
|
5,710 |
|
|
5,606 |
|
|
- |
Less: |
|
|
|
|
|
|
|
|
|
Accumulated net unrealized gains (losses) on cash flow hedges, net of tax(4) |
|
|
1,859 |
|
|
2,094 |
|
|
328 |
Cumulative unrealized net gain (loss) related to changes in fair value of financial liabilities attributable to own creditworthiness, net of tax(5) |
|
|
29 |
|
|
393 |
|
|
181 |
Intangible Assets: |
|
|
|
|
|
|
|
|
|
Goodwill, net of related deferred tax liabilities (DTLs)(6) |
|
|
20,522 |
|
|
20,275 |
|
|
21,498 |
Identifiable intangible assets other than mortgage servicing rights (MSRs), net of related DTLs |
|
|
4,248 |
|
|
3,866 |
|
|
4,132 |
Defined benefit pension plan net assets |
|
|
949 |
|
|
960 |
|
|
990 |
Deferred tax assets (DTAs) arising from net operating loss, foreign tax credit and general business credit carry-forwards |
|
|
12,057 |
|
|
12,313 |
|
|
11,487 |
Common Equity Tier 1 Capital (CET1)(3) |
|
$ |
142,234 |
|
$ |
139,643 |
|
$ |
138,581 |
|
|
|
|
|
|
|
|
|
|
Risk-Weighted Assets (RWA)(3)(7) |
|
$ |
1,210,439 |
|
$ |
1,205,123 |
|
$ |
1,197,050 |
|
|
|
|
|
|
|
|
|
|
Common Equity Tier 1 Capital Ratio (CET1 / RWA) |
|
|
11.8% |
|
|
11.6% |
|
|
11.6% |
Note: Citi’s reportable CET1 Capital ratios were derived under the U.S. Basel III Advanced Approaches framework as of March 31, 2020 and all subsequent periods, and the U.S. Basel III Standardized Approach framework for all prior periods presented. This reflects the lower of the CET1 Capital ratios under both the Standardized Approach and the Advanced Approaches under the Collins Amendment.
| (1) | Preliminary. |
| (2) | Excludes issuance costs related to outstanding preferred stock in accordance with Federal Reserve Board regulatory reporting requirements. |
| (3) | Please refer to Footnote 3 at the end of this press release for additional information. |
| (4) | Common Equity Tier 1 Capital is adjusted for accumulated net unrealized gains (losses) on cash flow hedges included in accumulated other comprehensive income that relate to the hedging of items not recognized at fair value on the balance sheet. |
| (5) | The cumulative impact of changes in Citigroup’s own creditworthiness in valuing liabilities for which the fair value option has been elected, and own-credit valuation adjustments on derivatives, are excluded from Common Equity Tier 1 Capital, in accordance with the U.S. Basel III rules. |
| (6) | Includes goodwill “embedded” in the valuation of significant common stock investments in unconsolidated financial institutions. |
| (7) | RWA excludes assets acquired pursuant to a non-recourse loan provided under the Money Market Mutual Fund Liquidity Facility. Additionally, loans originated under the Paycheck Protection Program receive a 0% risk weight. |
Appendix D
($ in millions) |
|
3Q'20(1) |
|
2Q'20 |
|
3Q'19 |
|||
|
|
|
|
|
|
|
|||
Common Equity Tier 1 Capital (CET1)(2) |
|
$ |
142,234 |
|
$ |
139,643 |
|
$ |
138,581 |
|
|
|
|
|
|
|
|
|
|
Additional Tier 1 Capital (AT1)(3) |
|
|
18,155 |
|
|
17,988 |
|
|
19,452 |
|
|
|
|
|
|
|
|
|
|
Total Tier 1 Capital (T1C) (CET1 + AT1) |
|
$ |
160,389 |
|
$ |
157,631 |
|
$ |
158,033 |
|
|
|
|
|
|
|
|
|
|
Total Leverage Exposure (TLE)(2)(4) |
|
$ |
2, 356,351 |
|
$ |
2,367,578 |
|
$ |
2,520,352 |
|
|
|
|
|
|
|
|
|
|
Supplementary Leverage Ratio (T1C / TLE) |
|
|
6.8% |
|
|
6.7% |
|
|
6.3% |
| (1) | Preliminary. |
| (2) | Please refer to Footnote 3 at the end of this press release for additional information. |
| (3) | Additional Tier 1 Capital primarily includes qualifying noncumulative perpetual preferred stock and qualifying trust preferred securities. |
| (4) | Commencing with the second quarter of 2020, Citigroup's TLE reflects the benefit of the temporary exclusion of U.S. Treasuries and deposits at Federal Reserve banks under the FRB interim final rule. Additionally, TLE excludes assets acquired pursuant to a non-recourse loan provided under the Money Market Mutual Fund Liquidity Facility, as well as exposures pledged as collateral pursuant to a non-recourse loan that is provided as part of the Paycheck Protection Program Lending Facility. |
10
Appendix E
($ and shares in millions, except per share amounts) |
|
3Q'20(1) |
|
2Q'20 |
|
3Q'19 |
|||
|
|
|
|
|
|
||||
Common Stockholders' Equity |
|
$ |
175,896 |
|
$ |
173,642 |
|
$ |
176,893 |
Less: |
|
|
|
|
|
|
|||
Goodwill |
|
|
21,624 |
|
|
21,399 |
|
|
21,822 |
Intangible Assets (other than MSRs) |
|
|
4,470 |
|
|
4,106 |
|
|
4,372 |
Tangible Common Equity (TCE) |
|
$ |
149,802 |
|
$ |
148,137 |
|
$ |
150,699 |
|
|
|
|
|
|
|
|||
Common Shares Outstanding (CSO) |
|
|
2,082 |
|
|
2,082 |
|
|
2,183 |
|
|
|
|
|
|
|
|||
Tangible Book Value Per Share (TCE / CSO) |
|
$ |
71.95 |
|
$ |
71.15 |
|
$ |
69.03 |
(1) Preliminary.
11
1 Citigroup’s total expenses divided by total revenues.
2 Preliminary. Citigroup’s return on average tangible common equity (RoTCE) is a non-GAAP financial measure. RoTCE represents annualized net income available to common shareholders as a percentage of average tangible common equity (TCE). For the components of the calculation, see Appendix A.
3 Ratios as of September 30, 2020 are preliminary. Commencing January 1, 2020, Citigroup’s Common Equity Tier 1 (CET1) Capital ratio and Supplementary Leverage ratio (SLR) reflect certain deferrals based on the modified regulatory capital transition provision related to the Current Expected Credit Loss (CECL) standard. Excluding the deferrals based on the modified CECL transition provision, Citigroup’s CET1 Capital ratio and SLR as of September 30, 2020 would be 11.3% and 6.6%, respectively, on a fully reflected basis.
Citigroup has elected to apply the modified transition provision related to the impact of the CECL accounting standard on regulatory capital, as provided by the US banking agencies’ September 2020 final rule (which is substantively unchanged from the March 2020 interim final rule). Under the modified CECL transition provision, the allowance for credit losses (after-tax) upon the January 1, 2020 CECL adoption date has been deferred and will phase in to regulatory capital at 25% per year commencing January 1, 2022. For the ongoing impact of CECL, Citigroup is allowed to adjust the allowance for credit losses in an amount equal to 25% of the change in the allowance for credit losses (pre-tax) recognized through earnings for each period between January 1, 2020 and December 31, 2021. The cumulative adjustments to the allowance for credit losses between January 1, 2020 and December 31, 2021 will also phase in to regulatory capital at 25% per year commencing January 1, 2022, along with the deferred impacts related to the January 1, 2020 CECL adoption date. The corresponding adjustments on average on-balance sheet assets are also reflected in Total Leverage Exposure. Additionally, the increase in deferred tax assets (DTA) arising from temporary differences upon the January 1, 2020 adoption date has been deducted from risk-weighted assets (RWA) and will phase in to RWA at 25% per year commencing January 1, 2022.
For the composition of Citigroup’s CET1 Capital and ratio, see Appendix C. For the composition of Citigroup’s SLR, see Appendix D.
4 Citigroup’s payout ratio is the sum of common dividends and common share repurchases divided by net income available to common shareholders. For the components of the calculation, see Appendix A.
5 Citigroup’s tangible book value per share is a non-GAAP financial measure. For a reconciliation of this measure to reported results, see Appendix E.
6 Results of operations excluding the impact of foreign exchange translation (constant dollar basis) are non-GAAP financial measures. For a reconciliation of these measures to reported results, see Appendix B.
7 Credit derivatives are used to economically hedge a portion of the private bank and corporate loan portfolio that includes both accrual loans and loans at fair value. Gains / (losses) on loan hedges includes the mark-to-market on the credit derivatives and the mark-to-market on the loans in the portfolio that are at fair value. In the third quarter 2020, gains / (losses) on loan hedges included $(117) million related to Corporate Lending and $(8) million related to the Private Bank, compared to losses of $(33) million related to Corporate Lending in the prior-year period. The fixed premium costs of these hedges are netted against the Private Bank and Corporate Lending revenues to reflect the cost of credit protection. Citigroup’s results of operations excluding the impact of gains / (losses) on loan hedges are non-GAAP financial measures.
12