Exhibit
Exhibit 99.1
July 17, 2019
Fellow shareholders,
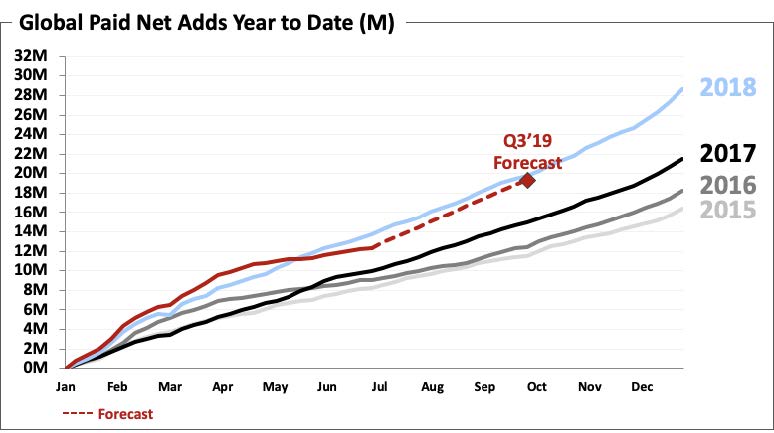
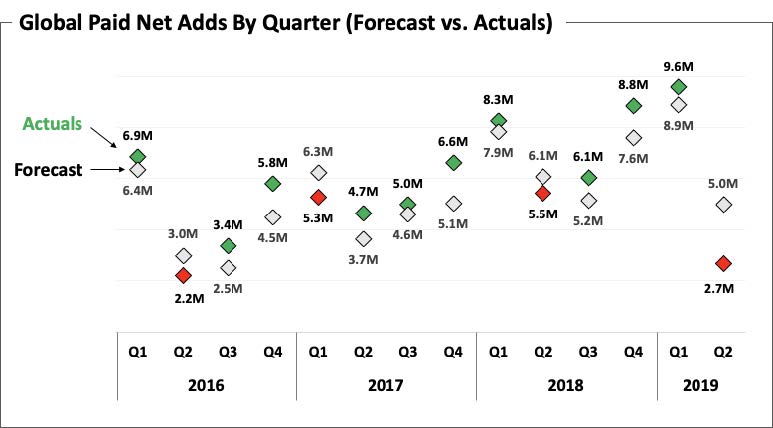
As expected, revenue growth accelerated 400 basis points to 26%, and operating income increased 53% year over year in Q2. Paid membership grew by 2.7m, less than the 5.5m in Q2 a year ago and our 5.0m forecast. In Q3, we expect to grow by 7m paid memberships, more than the 6.1m in Q3 a year ago. Consumers around the world continue to move from linear television to internet entertainment at a remarkable rate.
|
|
|
|
|
|
|
|
|
|
|
|
|
|
|
|
|
|
|
|
(in millions except per share data and Streaming Content Obligations) |
Q2'18 |
Q3'18 |
Q4'18 |
Q1'19 |
Q2'19 |
Q3'19 Forecast |
Revenue |
$ |
3,907 |
|
$ |
3,999 |
|
$ |
4,187 |
|
$ |
4,521 |
|
$ |
4,923 |
|
$ |
5,250 |
|
Y/Y % Growth |
40.3 |
% |
34.0 |
% |
27.4 |
% |
22.2 |
% |
26.0 |
% |
31.3 |
% |
Operating Income |
$ |
462 |
|
$ |
481 |
|
$ |
216 |
|
$ |
459 |
|
$ |
706 |
|
$ |
833 |
|
Operating Margin |
11.8 |
% |
12.0 |
% |
5.2 |
% |
10.2 |
% |
14.3 |
% |
15.9 |
% |
Net Income |
$ |
384 |
|
$ |
403 |
|
$ |
134 |
|
$ |
344 |
|
$ |
271 |
|
$ |
470 |
|
Diluted EPS |
$ |
0.85 |
|
$ |
0.89 |
|
$ |
0.30 |
|
$ |
0.76 |
|
$ |
0.60 |
|
$ |
1.04 |
|
|
|
|
|
|
|
|
Global Streaming Paid Memberships |
124.35 |
|
130.42 |
|
139.26 |
|
148.86 |
|
151.56 |
|
158.56 |
|
Y/Y % Growth |
25.6 |
% |
25.4 |
% |
25.9 |
% |
25.2 |
% |
21.9 |
% |
21.6 |
% |
Global Streaming Paid Net Additions |
5.45 |
|
6.07 |
|
8.84 |
|
9.60 |
|
2.70 |
|
7.00 |
|
|
|
|
|
|
|
|
Net cash (used in) operating activities |
$ |
(518 |
) |
$ |
(690 |
) |
$ |
(1,235 |
) |
$ |
(380 |
) |
$ |
(544 |
) |
|
Free Cash Flow* |
$ |
(559 |
) |
$ |
(859 |
) |
$ |
(1,315 |
) |
$ |
(460 |
) |
$ |
(594 |
) |
|
Adjusted EBITDA** |
$ |
563 |
|
$ |
584 |
|
$ |
328 |
|
$ |
584 |
|
$ |
836 |
|
|
Shares (FD) |
451.6 |
|
451.9 |
|
451.1 |
|
451.9 |
|
452.2 |
|
|
Streaming Content Obligations*** ($B) |
18.4 |
|
18.6 |
|
19.3 |
|
18.9 |
|
18.5 |
|
|
Note: Figures are consolidated, including DVD. |
|
|
|
|
|
|
* Free cash flow represents Net Cash (used in) operating activities adjusted for acquisition of DVD content assets, purchases of property and equipment and change in other assets |
** Adjusted EBITDA represents net income before interest expense and other income/expense, income taxes, depreciation and amortization of property and equipment and further adjusted to exclude other non-cash charges or non-recurring items |
*** Corresponds to our total known streaming content obligations as defined in our financial statements and related notes in our most recently filed SEC Form 10-K |
Q2 Results and Q3 Forecast
Average streaming paid memberships increased 24% year over year, while ARPU increased 3% year over year on a reported basis. Excluding the year over year foreign exchange (F/X) impact on revenue of -$265 million, global streaming ARPU grew 9%, with 12% and 7% ARPU growth in the US and international segments, respectively. Operating margin of 14.3% (up 250 bps year over year) was higher than our beginning-of-quarter forecast as some marketing spend was shifted into the second half of the year. EPS amounted to $0.60 vs. $0.85 and included a $61 million non-cash unrealized loss from F/X remeasurement on our Euro denominated debt. Streaming content obligations decreased 2% sequentially, reflecting our shift to more owned (vs. licensed) content.
As a reminder, the quarterly guidance we provide is our actual internal forecast at the time we report. We strive for accuracy (not conservatism), which means that in some quarters we will be high and other quarters low relative to our guidance. In Q2’19, our membership growth forecast was high.
Our missed forecast was across all regions, but slightly more so in regions with price increases. We don’t believe competition was a factor since there wasn’t a material change in the competitive landscape during Q2, and competitive intensity and our penetration is varied across regions (while our over-forecast was in every region). Rather, we think Q2’s content slate drove less growth in paid net adds than we anticipated. Additionally, Q1 was so large for us (9.6m net adds), there may have been more pull-forward effect than we realized. In prior quarters with over-forecasts, we’ve found that the underlying long-term growth was not affected and staying focused on the fundamentals of our business served us well.
Q3 has started with Stranger Things season 3, and the first two weeks of Q3 are strong. In addition to the recently released season 3 of Stranger Things, our second half content slate includes new seasons of La Casa de Papel (Money Heist), The Crown, and the final season of the iconic Orange is the New Black as well as big films like The Irishman from Martin Scorsese and action movie 6 Underground (directed by Michael Bay and starring Ryan Reynolds).
While our US paid membership was essentially flat in Q2, we expect it to return to more typical growth in Q3, and are seeing that in these early weeks of Q3. We forecast Q3 global paid net adds of 7.0m, up vs. 6.1m in Q3’18, with 0.8m in the US and 6.2m internationally. Our internal forecast still currently calls for annual global paid net adds to be up year over year. There’s no change to our 13% operating margin target for FY19, up 300 basis points year over year.
Content
Our Q2 content slate featured several highly watched titles. We launched Dead to Me, a dramedy starring 2019 Emmy nominated Best Actress Christina Applegate, which was watched by 30m households in its first four weeks. We’ve renewed this half hour comedy for a second season. We’re also proud of When They See Us1, a moving limited series based on the Central Park Five case, from Ava DuVernay. This powerful story was watched by 25m households in its first four weeks and has stirred a global conversation about race, identity, and criminal justice. When They See Us was also just nominated for 16 Emmy Awards, including Outstanding Limited Series. Our Planet was our most ambitious undertaking in the documentary category to date and it’s also our highest-watched original docu-series through its first four weeks (33m households) and was just nominated for 10 Emmy Awards.
We are making good progress with our original films portfolio with more and more of our films creating larger audiences than our pay 1 licensed movies. At the end of June, we premiered our latest Adam Sandler movie Murder Mystery (also starring Jennifer Aniston), which is the most watched Adam Sandler Netflix original film to date; over 73m households watched this film in its first four weeks. In Q2, the young adult romantic comedy movie The Perfect Date (featuring Noah Centineo from our big film To All The Boys I’ve Loved Before) was a global hit with 48m households in its first four weeks. Similarly, Ali Wong co-starred with Randall Park in Always Be My Maybe (directed by Nahnatchka Khan), which was viewed by 32m households in its first four weeks.
___________________________________
1 https://www.youtube.com/watch?v=u3F9n_smGWY&feature=youtu.be
Season 2 of The Rain was among the largest returning seasons for one of our non-English language originals, while Swedish series Quicksand was a new show that was highly watched both locally and globally. We also debuted several local-language titles that were very popular in their home territories like the first two installments of the Historia de un Crimen franchise (Historia de un Crimen: Colosio and Historia de un Crimen: Colmenares) in Latin America, while Family Business was a breakthrough hit for us in France.
We’ve been moving our content from semi-exclusive catalog and 2nd-window unbranded content to branded exclusive 1st window original content for many years. Much of our domestic, and eventually global, Disney catalog, as well as Friends, The Office, and some other licensed content will wind down over the coming years, freeing up budget for more original content. We don’t have material viewing concentration as even our largest titles (that are watched by millions of members) account for only a low single digit percentage of streaming hours. From what we’ve seen in the past when we drop strong catalog content (Starz and Epix with Sony, Disney, and Paramount films, or 2nd run series from Fox, for example) our members shift over to enjoying our other great content.
Forty of our original series, films and specials were nominated for 117 Emmy Awards, including Outstanding Comedy and Drama Series, Limited Series, Animated Series and Reality Series, as well as Variety, Children’s, short form and interactive programs. We are incredibly proud to offer best in class original programming in so many different forms.
Marketing
As Netflix has shifted to original content, our marketing has evolved to increasingly focus on launching our key titles to build excitement amongst existing and non-members. We’re continuing to invest in owned and earned media, where we can have strong, direct relationships with fans. We’re very excited to welcome Jackie Lee-Joe2 as our new CMO to help us take our marketing to the next level.
We’re also building out our licensing and brand partnerships effort, which is optimizing for fan and viewer engagement over revenue maximization. For example, for the launch of Stranger Things season 3, we partnered with best-in-class brands like Coke3, Nike4, Burger King5, and Baskin Robbins6 to build deep connections with our fans.
At E3, the largest video gaming event of the year, we announced a new Stranger Things mobile game, a game based on our upcoming new show Dark Crystal: Age of Resistance (a prequel to the 1982 film), and a partnership with Epic Games, the developers of Fortnite7. Like our other merchandising initiatives, these games are designed to build fandom for our titles and don’t signal a push into gaming as a new business for Netflix.
___________________________________
2 https://www.netflixinvestor.com/investor-news-and-events/financial-releases/press-release-details/2019/Jackie-Lee-Joe-named-Netflix-Chief-Marketing-Officer/default.aspx
3 https://www.youtube.com/watch?v=uCCg5AjwmvE&feature=youtu.be
4 https://www.bizjournals.com/atlanta/news/2019/06/13/nike-partners-with-netflix-and-stranger-things-to.html
5 https://www.cnn.com/2019/06/13/business/burger-king-stranger-things/index.html
6 https://www.usatoday.com/story/money/2019/05/30/stranger-things-ice-cream-coming-baskin-robbins/1287027001/
7 https://www.gamesradar.com/stranger-things-fortnite-crossover-e3-2019/
Product and Partnerships
We recently entered into a new partnership with AT&T in the US to integrate Netflix into their new set-top box. In the US, we now partner with a wide range of ISPs and MVPDs, including Comcast, DISH, Verizon, T-Mobile, Charter, and Altice, in addition to AT&T.
After several months of testing, we’ve decided to roll out a lower-priced mobile-screen plan in India to complement our existing plans. We believe this plan, which will launch in Q3, will be an effective way to introduce a larger number of people in India to Netflix and to further expand our business in a market where Pay TV ARPU is low (below $5). We will continue to learn more after launch of this plan.
Competition
Over the next 12 months, Disney, Apple, WarnerMedia, NBCU and others are joining Hulu, Amazon, BBC, Hotstar, YouTube, Netflix, and many others in offering streaming entertainment. The competition for winning consumers’ relaxation time is fierce for all companies and great for consumers. The innovation of streaming services is also drawing consumers to shift more and more from linear television to streaming entertainment. If you watch Our Planet on a new TV with Dolby Vision or HDR10, you will see why: the quality of streaming television is spectacular. In the US, our most developed market, we still only earn about 10% of consumers’ television time, and less of their mobile screen time, so we have much room for growth.
We, like HBO, are advertising free. That remains a deep part of our brand proposition; when you read speculation that we are moving into selling advertising, be confident that this is false. We believe we will have a more valuable business in the long term by staying out of competing for ad revenue and instead entirely focusing on competing for viewer satisfaction.
Cash Flow and Capital Structure
Net cash used in operating activities in Q2’19 was -$544 million vs. -$518 million in the prior year period. Free cash flow (FCF)8 totaled -$594 million vs. -$559 million in Q2’18. We’re still forecasting FCF of approximately -$3.5 billion for the full year 2019 and expect improvement in 2020. From there, we’ll continue to reduce our free cash flow deficit as we intend to continue growing our member base, revenues, and operating margin, which provides a clear path towards positive FCF. In the meantime, our plan is still to use high yield debt to fund our content investments as we did in April. In our most recent round, we raised 10.5 year senior notes of €1.2 billion (3.875% coupon) and $900 million (5.375% coupon).
___________________________________
8 For a reconciliation of free cash flow to net cash (used in) operating activities, please refer to the reconciliation in tabular form on the attached unaudited financial statements and the footnotes thereto.
Reference
For quick reference, our eight most recent investor letters are: April 2019,9 January 2019,10 October 2018,11 July 2018,12 April 2018,13 January 2018,14 October 2017,15 July 2017.16
Appendix
|
|
|
|
|
|
|
|
|
|
|
|
|
|
|
|
|
|
|
|
(in millions) |
Q2'18 |
Q3'18 |
Q4'18 |
Q1'19 |
Q2'19 |
Q3'19 Forecast |
US Streaming: |
|
|
|
|
|
|
Revenue |
$ |
1,893 |
|
$ |
1,937 |
|
$ |
1,996 |
|
$ |
2,074 |
|
$ |
2,299 |
|
$ |
2,400 |
|
Contribution Profit* |
$ |
672 |
|
$ |
688 |
|
$ |
590 |
|
$ |
713 |
|
$ |
852 |
|
$ |
923 |
|
Contribution Margin* |
35.5 |
% |
35.5 |
% |
29.6 |
% |
34.4 |
% |
37.1 |
% |
38.5 |
% |
Paid Memberships |
55.96 |
|
56.96 |
|
58.49 |
|
60.23 |
|
60.10 |
|
60.90 |
|
Paid Net Additions |
0.87 |
|
1.00 |
|
1.53 |
|
1.74 |
|
(0.13 |
) |
0.80 |
|
Free Trials |
1.42 |
|
1.51 |
|
2.07 |
|
1.56 |
|
1.58 |
|
|
|
|
|
|
|
|
|
International Streaming: |
|
|
|
|
|
|
Revenue |
$ |
1,921 |
|
$ |
1,973 |
|
$ |
2,106 |
|
$ |
2,367 |
|
$ |
2,548 |
|
$ |
2,778 |
|
Contribution Profit* |
$ |
188 |
|
$ |
218 |
|
$ |
82 |
|
$ |
274 |
|
$ |
416 |
|
$ |
503 |
|
Contribution Margin* |
9.8 |
% |
11.0 |
% |
3.9 |
% |
11.6 |
% |
16.3 |
% |
18.1 |
% |
Paid Memberships |
68.39 |
|
73.46 |
|
80.77 |
|
88.63 |
|
91.46 |
|
97.66 |
|
Paid Net Additions |
4.58 |
|
5.07 |
|
7.31 |
|
7.86 |
|
2.83 |
|
6.20 |
|
Free Trials |
4.37 |
|
5.17 |
|
7.13 |
|
5.00 |
|
4.48 |
|
|
|
|
|
|
|
|
|
*Certain prior period amounts have been reclassified from G&A to Cost of revenues and Marketing and from Tech & Dev to Cost of revenues to conform to current period presentation |
Note: As announced in our Q3'18 investor letter, we will cease reporting end-of-quarter free trial count in January of 2020. |
___________________________________
9 https://s22.q4cdn.com/959853165/files/doc_financials/quarterly_reports/2019/q1/FINAL-Q1-19-Shareholder-Letter.pdf
10 https://s22.q4cdn.com/959853165/files/doc_financials/quarterly_reports/2018/q4/01/FINAL-Q4-18-Shareholder-Letter.pdf
11 https://s22.q4cdn.com/959853165/files/doc_financials/quarterly_reports/2018/q3/FINAL-Q3-18-Shareholder-Letter.pdf
12 https://s22.q4cdn.com/959853165/files/doc_financials/quarterly_reports/2018/q2/FINAL-Q2-18-Shareholder-Letter.pdf
13 https://s22.q4cdn.com/959853165/files/doc_financials/quarterly_reports/2018/q1/FINAL-Q1-18-Shareholder-Letter.pdf
14 https://s22.q4cdn.com/959853165/files/doc_financials/quarterly_reports/2017/q4/COMBINED-Q4-17-Shareholder-Letter-FINAL.pdf
15 https://s22.q4cdn.com/959853165/files/doc_financials/quarterly_reports/2017/q3/Q3_17_Shareholder_Letter_COMBINED.pdf
16 https://s22.q4cdn.com/959853165/files/doc_financials/quarterly_reports/2017/q2/Q2_17_Shareholder_Letter.pdf
July 17, 2019 Earnings Interview, 3pm PST
Our video interview with Michael Morris of Guggenheim Securities will be on youtube/netflixir at 3pm PST today. Questions that investors would like to see asked should be sent to michael.morris@guggenheimpartners.com. Reed Hastings, CEO, Spence Neumann, CFO, Ted Sarandos, Chief Content Officer, Greg Peters, Chief Product Officer and Spencer Wang, VP of IR/Corporate Development will all be on the video to answer Michael’s questions.
|
|
|
IR Contact:
|
PR Contact:
|
Spencer Wang |
Richard Siklos |
VP, Finance/IR & Corporate Development |
VP, Corporate Communications |
408 809-5360 |
408 540-2629 |
Use of Non-GAAP Measures
This shareholder letter and its attachments include reference to the non-GAAP financial measure of free cash flow and EBITDA. Management believes that free cash flow and EBITDA are important liquidity metrics because they measure, during a given period, the amount of cash generated that is available to repay debt obligations, make investments and for certain other activities or the amount of cash used in operations, including investments in global streaming content. However, these non-GAAP measures should be considered in addition to, not as a substitute for or superior to, net income, operating income, diluted earnings per share and net cash provided by operating activities, or other financial measures prepared in accordance with GAAP. Reconciliation to the GAAP equivalent of these non-GAAP measures are contained in tabular form on the attached unaudited financial statements.
Forward-Looking Statements
This shareholder letter contains certain forward-looking statements within the meaning of the federal
securities laws, including statements regarding future content offerings; variability of content obligations; product tests; impact of competition; future capital raises; ARPU; global streaming membership growth; tax rate; impact of the change in corporate structure; U.S. and international streaming paid memberships, paid net additions, revenue, contribution profit (loss) and contribution margin; consolidated revenue, revenue growth, operating income, operating margin, net income, and earnings per share; and free cash flow. The forward-looking statements in this letter are subject to risks and uncertainties that could cause actual results and events to differ, including, without limitation: our ability to attract new members and retain existing members; our ability to compete effectively; maintenance and expansion of device platforms for streaming; fluctuations in consumer usage of our service; service disruptions; production risks; actions of Internet Service Providers; and, competition, including consumer adoption of different modes of viewing in-home filmed entertainment. A detailed discussion of these and other risks and uncertainties that could cause actual results and events to differ materially from such forward-looking statements is included in our filings with the Securities and Exchange Commission, including our Annual Report on Form 10-K, filed with the Securities and Exchange Commission (“SEC”) on January 29, 2019, as amended by Form 10-K/A, filed with the SEC on February 8, 2019. The Company provides internal forecast numbers. Investors should anticipate that actual performance will vary from these forecast numbers based on risks and uncertainties discussed above and in our Annual Report on Form 10-K, as amended by Form 10-K/A. We undertake no obligation to update forward-looking statements to reflect events or circumstances occurring after the date of this shareholder letter.
Netflix, Inc.
Consolidated Statements of Operations
(unaudited)
(in thousands, except per share data)
|
|
|
|
|
|
|
|
|
|
|
|
|
|
|
|
|
|
|
|
|
|
Three Months Ended |
|
Six Months Ended |
|
June 30,
2019 |
|
March 31,
2019 |
|
June 30,
2018 |
|
June 30,
2019 |
|
June 30,
2018 |
Revenues |
$ |
4,923,116 |
|
|
$ |
4,520,992 |
|
|
$ |
3,907,270 |
|
|
$ |
9,444,108 |
|
|
$ |
7,608,126 |
|
Cost of revenues |
3,005,657 |
|
|
2,870,614 |
|
|
2,402,431 |
|
|
5,876,271 |
|
|
4,703,010 |
|
Marketing |
603,150 |
|
|
616,578 |
|
|
592,007 |
|
|
1,219,728 |
|
|
1,128,784 |
|
Technology and development |
383,233 |
|
|
372,764 |
|
|
299,095 |
|
|
755,997 |
|
|
581,405 |
|
General and administrative |
224,657 |
|
|
201,952 |
|
|
151,524 |
|
|
426,609 |
|
|
286,136 |
|
Operating income |
706,419 |
|
|
459,084 |
|
|
462,213 |
|
|
1,165,503 |
|
|
908,791 |
|
Other income (expense): |
|
|
|
|
|
|
|
|
|
Interest expense |
(152,033 |
) |
|
(135,529 |
) |
|
(101,605 |
) |
|
(287,562 |
) |
|
(182,824 |
) |
Interest and other income (expense) |
(53,470 |
) |
|
76,104 |
|
|
68,028 |
|
|
22,634 |
|
|
2,285 |
|
Income before income taxes |
500,916 |
|
|
399,659 |
|
|
428,636 |
|
|
900,575 |
|
|
728,252 |
|
Provision for income taxes |
230,266 |
|
|
55,607 |
|
|
44,287 |
|
|
285,873 |
|
|
53,779 |
|
Net income |
$ |
270,650 |
|
|
$ |
344,052 |
|
|
$ |
384,349 |
|
|
$ |
614,702 |
|
|
$ |
674,473 |
|
Earnings per share: |
|
|
|
|
|
|
|
|
|
Basic |
$ |
0.62 |
|
|
$ |
0.79 |
|
|
$ |
0.88 |
|
|
$ |
1.41 |
|
|
$ |
1.55 |
|
Diluted |
$ |
0.60 |
|
|
$ |
0.76 |
|
|
$ |
0.85 |
|
|
$ |
1.36 |
|
|
$ |
1.50 |
|
Weighted-average common shares outstanding: |
|
|
|
|
|
|
|
|
|
Basic |
437,587 |
|
|
436,947 |
|
|
435,097 |
|
|
437,271 |
|
|
434,638 |
|
Diluted |
452,195 |
|
|
451,922 |
|
|
451,552 |
|
|
452,063 |
|
|
450,958 |
|
Netflix, Inc.
Consolidated Balance Sheets
(unaudited)
(in thousands)
|
|
|
|
|
|
|
|
|
|
As of |
|
June 30,
2019 |
|
December 31,
2018 |
Assets |
|
|
|
Current assets: |
|
|
|
Cash and cash equivalents |
$ |
5,004,247 |
|
|
$ |
3,794,483 |
|
Current content assets, net |
— |
|
|
5,151,186 |
|
Other current assets |
872,910 |
|
|
748,466 |
|
Total current assets |
5,877,157 |
|
|
9,694,135 |
|
Non-current content assets, net |
21,945,740 |
|
|
14,960,954 |
|
Property and equipment, net |
452,399 |
|
|
418,281 |
|
Other non-current assets |
1,896,043 |
|
|
901,030 |
|
Total assets |
$ |
30,171,339 |
|
|
$ |
25,974,400 |
|
Liabilities and Stockholders' Equity |
|
|
|
Current liabilities: |
|
|
|
Current content liabilities |
$ |
4,848,201 |
|
|
$ |
4,686,019 |
|
Accounts payable |
442,194 |
|
|
562,985 |
|
Accrued expenses and other liabilities |
750,812 |
|
|
477,417 |
|
Deferred revenue |
892,777 |
|
|
760,899 |
|
Total current liabilities |
6,933,984 |
|
|
6,487,320 |
|
Non-current content liabilities |
3,564,440 |
|
|
3,759,026 |
|
Long-term debt |
12,594,135 |
|
|
10,360,058 |
|
Other non-current liabilities |
973,232 |
|
|
129,231 |
|
Total liabilities |
24,065,791 |
|
|
20,735,635 |
|
Stockholders' equity: |
|
|
|
Common stock |
2,566,365 |
|
|
2,315,988 |
|
Accumulated other comprehensive loss |
(20,352 |
) |
|
(19,582 |
) |
Retained earnings |
3,559,535 |
|
|
2,942,359 |
|
Total stockholders' equity |
6,105,548 |
|
|
5,238,765 |
|
Total liabilities and stockholders' equity |
$ |
30,171,339 |
|
|
$ |
25,974,400 |
|
Netflix, Inc.
Consolidated Statements of Cash Flows
(unaudited)
(in thousands)
|
|
|
|
|
|
|
|
|
|
|
|
|
|
|
|
|
|
|
|
|
|
Three Months Ended |
|
Six Months Ended |
|
June 30,
2019 |
|
March 31,
2019 |
|
June 30,
2018 |
|
June 30,
2019 |
|
June 30,
2018 |
Cash flows from operating activities: |
|
|
|
|
|
|
|
|
|
Net income |
$ |
270,650 |
|
|
$ |
344,052 |
|
|
$ |
384,349 |
|
|
$ |
614,702 |
|
|
$ |
674,473 |
|
Adjustments to reconcile net income to net cash used in operating activities: |
|
|
|
|
|
|
|
|
|
Additions to streaming content assets |
(3,325,103 |
) |
|
(2,997,746 |
) |
|
(3,033,721 |
) |
|
(6,322,849 |
) |
|
(6,020,468 |
) |
Change in streaming content liabilities |
(12,414 |
) |
|
(14,698 |
) |
|
288,474 |
|
|
(27,112 |
) |
|
667,359 |
|
Amortization of streaming content assets |
2,231,915 |
|
|
2,124,686 |
|
|
1,817,817 |
|
|
4,356,601 |
|
|
3,566,661 |
|
Amortization of DVD content assets |
7,656 |
|
|
8,509 |
|
|
11,154 |
|
|
16,165 |
|
|
22,288 |
|
Depreciation and amortization of property, equipment and intangibles |
25,496 |
|
|
23,561 |
|
|
19,736 |
|
|
49,057 |
|
|
38,777 |
|
Stock-based compensation expense |
103,848 |
|
|
101,200 |
|
|
81,232 |
|
|
205,048 |
|
|
149,627 |
|
Other non-cash items |
53,039 |
|
|
37,199 |
|
|
13,921 |
|
|
90,238 |
|
|
22,130 |
|
Foreign currency remeasurement loss (gain) on long-term debt |
61,284 |
|
|
(57,600 |
) |
|
(85,410 |
) |
|
3,684 |
|
|
(44,330 |
) |
Deferred taxes |
35,519 |
|
|
6,627 |
|
|
(9,539 |
) |
|
42,146 |
|
|
(31,588 |
) |
Changes in operating assets and liabilities: |
|
|
|
|
|
|
|
|
|
Other current assets |
(24,231 |
) |
|
(32,076 |
) |
|
(25,564 |
) |
|
(56,307 |
) |
|
(81,469 |
) |
Accounts payable |
(2,674 |
) |
|
(124,467 |
) |
|
7,733 |
|
|
(127,141 |
) |
|
81,816 |
|
Accrued expenses and other liabilities |
(26,705 |
) |
|
157,647 |
|
|
(52,851 |
) |
|
130,942 |
|
|
66,198 |
|
Deferred revenue |
84,085 |
|
|
47,793 |
|
|
23,848 |
|
|
131,878 |
|
|
79,118 |
|
Other non-current assets and liabilities |
(26,119 |
) |
|
(4,486 |
) |
|
40,582 |
|
|
(30,605 |
) |
|
54,412 |
|
Net cash used in operating activities |
(543,754 |
) |
|
(379,799 |
) |
|
(518,239 |
) |
|
(923,553 |
) |
|
(754,996 |
) |
Cash flows from investing activities: |
|
|
|
|
|
|
|
|
|
Acquisition of DVD content assets |
(7,798 |
) |
|
(9,170 |
) |
|
(12,552 |
) |
|
(16,968 |
) |
|
(23,348 |
) |
Purchases of property and equipment |
(39,584 |
) |
|
(60,381 |
) |
|
(27,323 |
) |
|
(99,965 |
) |
|
(64,493 |
) |
Change in other assets |
(2,654 |
) |
|
(10,552 |
) |
|
(441 |
) |
|
(13,206 |
) |
|
(2,227 |
) |
Net cash used in investing activities |
(50,036 |
) |
|
(80,103 |
) |
|
(40,316 |
) |
|
(130,139 |
) |
|
(90,068 |
) |
Cash flows from financing activities: |
|
|
|
|
|
|
|
|
|
Proceeds from issuance of debt |
2,243,196 |
|
|
— |
|
|
1,900,000 |
|
|
2,243,196 |
|
|
1,900,000 |
|
Debt issuance costs |
(18,192 |
) |
|
— |
|
|
(16,992 |
) |
|
(18,192 |
) |
|
(16,992 |
) |
Proceeds from issuance of common stock |
21,896 |
|
|
22,972 |
|
|
26,936 |
|
|
44,868 |
|
|
83,271 |
|
Other financing activities |
— |
|
|
— |
|
|
(532 |
) |
|
— |
|
|
(853 |
) |
Net cash provided by financing activities |
2,246,900 |
|
|
22,972 |
|
|
1,909,412 |
|
|
2,269,872 |
|
|
1,965,426 |
|
Effect of exchange rate changes on cash, cash equivalents, and restricted cash |
4,998 |
|
|
(5,014 |
) |
|
(36,340 |
) |
|
(16 |
) |
|
(29,163 |
) |
Net increase (decrease) in cash, cash equivalents, and restricted cash |
1,658,108 |
|
|
(441,944 |
) |
|
1,314,517 |
|
|
1,216,164 |
|
|
1,091,199 |
|
Cash, cash equivalents and restricted cash at beginning of period |
3,370,097 |
|
|
3,812,041 |
|
|
2,599,477 |
|
|
3,812,041 |
|
|
2,822,795 |
|
Cash, cash equivalents and restricted cash at end of period |
$ |
5,028,205 |
|
|
$ |
3,370,097 |
|
|
$ |
3,913,994 |
|
|
$ |
5,028,205 |
|
|
$ |
3,913,994 |
|
|
|
|
|
|
|
|
|
|
|
|
Three Months Ended |
|
Six Months Ended |
|
June 30,
2019 |
|
March 31,
2019 |
|
June 30,
2018 |
|
June 30,
2019 |
|
June 30,
2018 |
Non-GAAP free cash flow reconciliation: |
|
|
|
|
|
|
|
|
|
Net cash used in operating activities |
$ |
(543,754 |
) |
|
$ |
(379,799 |
) |
|
$ |
(518,239 |
) |
|
$ |
(923,553 |
) |
|
$ |
(754,996 |
) |
Acquisition of DVD content assets |
(7,798 |
) |
|
(9,170 |
) |
|
(12,552 |
) |
|
(16,968 |
) |
|
(23,348 |
) |
Purchases of property and equipment |
(39,584 |
) |
|
(60,381 |
) |
|
(27,323 |
) |
|
(99,965 |
) |
|
(64,493 |
) |
Change in other assets |
(2,654 |
) |
|
(10,552 |
) |
|
(441 |
) |
|
(13,206 |
) |
|
(2,227 |
) |
Non-GAAP free cash flow |
$ |
(593,790 |
) |
|
$ |
(459,902 |
) |
|
$ |
(558,555 |
) |
|
$ |
(1,053,692 |
) |
|
$ |
(845,064 |
) |
Netflix, Inc.
Segment Information
(unaudited)
(in thousands)
|
|
|
|
|
|
|
|
|
|
|
|
|
|
|
|
|
|
|
|
|
|
As of / Three Months Ended |
|
As of/ Six Months Ended |
|
June 30,
2019 |
|
March 31,
2019 |
|
June 30,
2018 |
|
June 30,
2019 |
|
June 30,
2018 |
Domestic Streaming |
|
|
|
|
|
|
|
|
|
Paid memberships at end of period |
60,103 |
|
|
60,229 |
|
|
55,959 |
|
|
60,103 |
|
|
55,959 |
|
Paid net membership additions (losses) |
(126 |
) |
|
1,743 |
|
|
872 |
|
|
1,617 |
|
|
3,149 |
|
Free trials |
1,575 |
|
|
1,563 |
|
|
1,420 |
|
|
1,575 |
|
|
1,420 |
|
|
|
|
|
|
|
|
|
|
|
Revenues |
$ |
2,299,189 |
|
|
$ |
2,073,555 |
|
|
$ |
1,893,222 |
|
|
$ |
4,372,744 |
|
|
$ |
3,713,241 |
|
Cost of revenues |
1,196,420 |
|
|
1,139,535 |
|
|
969,995 |
|
|
2,335,955 |
|
|
1,906,475 |
|
Marketing |
250,606 |
|
|
221,046 |
|
|
251,298 |
|
|
471,652 |
|
|
502,017 |
|
Contribution profit |
852,163 |
|
|
712,974 |
|
|
671,929 |
|
|
1,565,137 |
|
|
1,304,749 |
|
|
|
|
|
|
|
|
|
|
|
International Streaming |
|
|
|
|
|
|
|
|
|
Paid memberships at end of period |
91,459 |
|
|
88,634 |
|
|
68,395 |
|
|
91,459 |
|
|
68,395 |
|
Paid net membership additions |
2,825 |
|
|
7,861 |
|
|
4,580 |
|
|
10,686 |
|
|
10,561 |
|
Free trials |
4,481 |
|
|
5,003 |
|
|
4,367 |
|
|
4,481 |
|
|
4,367 |
|
|
|
|
|
|
|
|
|
|
|
Revenues |
$ |
2,547,727 |
|
|
$ |
2,366,749 |
|
|
$ |
1,921,144 |
|
|
$ |
4,914,476 |
|
|
$ |
3,703,230 |
|
Cost of revenues |
1,778,890 |
|
|
1,697,121 |
|
|
1,392,512 |
|
|
3,476,011 |
|
|
2,714,218 |
|
Marketing |
352,544 |
|
|
395,532 |
|
|
340,709 |
|
|
748,076 |
|
|
626,767 |
|
Contribution profit |
416,293 |
|
|
274,096 |
|
|
187,923 |
|
|
690,389 |
|
|
362,245 |
|
|
|
|
|
|
|
|
|
|
|
Domestic DVD |
|
|
|
|
|
|
|
|
|
Paid memberships at end of period |
2,411 |
|
|
2,565 |
|
|
2,971 |
|
|
2,411 |
|
|
2,971 |
|
Free trials |
17 |
|
|
22 |
|
|
28 |
|
|
17 |
|
|
28 |
|
|
|
|
|
|
|
|
|
|
|
Revenues |
$ |
76,200 |
|
|
$ |
80,688 |
|
|
$ |
92,904 |
|
|
$ |
156,888 |
|
|
$ |
191,655 |
|
Cost of revenues |
30,347 |
|
|
33,958 |
|
|
39,924 |
|
|
64,305 |
|
|
82,317 |
|
Contribution profit |
45,853 |
|
|
46,730 |
|
|
52,980 |
|
|
92,583 |
|
|
109,338 |
|
|
|
|
|
|
|
|
|
|
|
Consolidated |
|
|
|
|
|
|
|
|
|
|
|
|
|
|
|
|
|
|
|
Revenues |
$ |
4,923,116 |
|
|
$ |
4,520,992 |
|
|
$ |
3,907,270 |
|
|
$ |
9,444,108 |
|
|
$ |
7,608,126 |
|
Cost of revenues |
3,005,657 |
|
|
2,870,614 |
|
|
2,402,431 |
|
|
5,876,271 |
|
|
4,703,010 |
|
Marketing |
603,150 |
|
|
616,578 |
|
|
592,007 |
|
|
1,219,728 |
|
|
1,128,784 |
|
Contribution profit |
1,314,309 |
|
|
1,033,800 |
|
|
912,832 |
|
|
2,348,109 |
|
|
1,776,332 |
|
Other operating expenses |
607,890 |
|
|
574,716 |
|
|
450,619 |
|
|
1,182,606 |
|
|
867,541 |
|
Operating income |
706,419 |
|
|
459,084 |
|
|
462,213 |
|
|
1,165,503 |
|
|
908,791 |
|
Other expense |
(205,503 |
) |
|
(59,425 |
) |
|
(33,577 |
) |
|
(264,928 |
) |
|
(180,539 |
) |
Provision for income taxes |
230,266 |
|
|
55,607 |
|
|
44,287 |
|
|
285,873 |
|
|
53,779 |
|
Net income |
$ |
270,650 |
|
|
$ |
344,052 |
|
|
$ |
384,349 |
|
|
$ |
614,702 |
|
|
$ |
674,473 |
|
Netflix, Inc.
Non-GAAP Information
(unaudited)
(in thousands)
|
|
|
|
|
|
|
|
|
|
|
|
|
|
|
|
|
|
|
|
|
|
|
|
June 30,
2018 |
|
September 30,
2018 |
|
December 31,
2018 |
|
March 31,
2019 |
|
June 30,
2019 |
Non-GAAP Adjusted EBITDA reconciliation: |
|
|
|
|
|
|
|
|
|
GAAP net income |
$ |
384,349 |
|
|
$ |
402,835 |
|
|
$ |
133,934 |
|
|
$ |
344,052 |
|
|
$ |
270,650 |
|
Add: |
|
|
|
|
|
|
|
|
|
Other expense |
33,577 |
|
|
101,858 |
|
|
96,371 |
|
|
59,425 |
|
|
205,503 |
|
Provision for (benefit from) income taxes |
44,287 |
|
|
(24,025 |
) |
|
(14,538 |
) |
|
55,607 |
|
|
230,266 |
|
Depreciation and amortization of property, equipment and intangibles |
19,736 |
|
|
21,161 |
|
|
23,219 |
|
|
23,561 |
|
|
25,496 |
|
Stock-based compensation expense |
81,232 |
|
|
82,316 |
|
|
88,714 |
|
|
101,200 |
|
|
103,848 |
|
Adjusted EBITDA |
$ |
563,181 |
|
|
$ |
584,145 |
|
|
$ |
327,700 |
|
|
$ |
583,845 |
|
|
$ |
835,763 |
|