Document
Exhibit 99.1
January 21, 2020
Fellow shareholders,
We had a strong finish to 2019, with Q4 revenue growing 31% year over year, bringing full year 2019 revenue to over $20 billion, while FY19 operating income rose 62% to $2.6 billion. During the quarter, we surpassed 100 million paid memberships outside of the US. Streaming entertainment is a global phenomenon and we’re working hard to build on our early progress.
|
|
|
|
|
|
|
|
|
|
|
|
|
|
|
|
|
|
|
|
|
| (in millions except per share data and Streaming Content Obligations) |
Q4'18 |
Q1'19 |
Q2'19 |
Q3'19 |
Q4'19 |
Q1'20 Forecast |
| Revenue |
$ |
4,187 |
|
$ |
4,521 |
|
$ |
4,923 |
|
$ |
5,245 |
|
$ |
5,467 |
|
$ |
5,731 |
|
| Y/Y % Growth |
27.4 |
% |
22.2 |
% |
26.0 |
% |
31.1 |
% |
30.6 |
% |
26.8 |
% |
| Operating Income |
$ |
216 |
|
$ |
459 |
|
$ |
706 |
|
$ |
980 |
|
$ |
459 |
|
$ |
1,033 |
|
| Operating Margin |
5.2 |
% |
10.2 |
% |
14.3 |
% |
18.7 |
% |
8.4 |
% |
18.0 |
% |
| Net Income |
$ |
134 |
|
$ |
344 |
|
$ |
271 |
|
$ |
665 |
|
$ |
587 |
|
$ |
750 |
|
| Diluted EPS |
$ |
0.30 |
|
$ |
0.76 |
|
$ |
0.60 |
|
$ |
1.47 |
|
$ |
1.30 |
|
$ |
1.66 |
|
|
|
|
|
|
|
|
| Global Streaming Paid Memberships |
139.26 |
|
148.86 |
|
151.56 |
|
158.33 |
|
167.09 |
|
174.09 |
|
| Y/Y % Growth |
25.9 |
% |
25.2 |
% |
21.9 |
% |
21.4 |
% |
20.0 |
% |
16.9 |
% |
| Global Streaming Paid Net Additions |
8.84 |
|
9.60 |
|
2.70 |
|
6.77 |
|
8.76 |
|
7.00 |
|
|
|
|
|
|
|
|
| Net cash (used in) operating activities |
$ |
(1,235) |
|
$ |
(380) |
|
$ |
(544) |
|
$ |
(502) |
|
$ |
(1,462) |
|
|
| Free Cash Flow* |
$ |
(1,315) |
|
$ |
(460) |
|
$ |
(594) |
|
$ |
(551) |
|
$ |
(1,670) |
|
|
| Adjusted EBITDA** |
$ |
328 |
|
$ |
584 |
|
$ |
836 |
|
$ |
1,107 |
|
$ |
586 |
|
|
| Shares (FD) |
451.1 |
|
451.9 |
|
452.2 |
|
451.6 |
|
451.4 |
|
|
| Streaming Content Obligations*** ($B) |
19.3 |
|
18.9 |
|
18.5 |
|
19.1 |
|
19.5 |
|
|
| Note: Figures are consolidated, including DVD. |
|
|
|
|
|
|
| * Free cash flow represents Net Cash (used in) operating activities adjusted for purchases of property and equipment and change in other assets |
|
|
|
|
|
|
| ** Adjusted EBITDA represents net income before interest expense and other income/expense, income taxes, depreciation and amortization of property and equipment and further adjusted to exclude other non-cash charges or non-recurring items |
|
|
|
|
|
|
| *** Corresponds to our total known streaming content obligations as defined in our financial statements and related notes in our most recently filed SEC Form 10-K |
|
|
|
|
|
|
Q4 Results and Q1 Forecast
In Q4, average streaming paid memberships grew 21% year over year while streaming ARPU increased 9% year over year. Excluding a -$133 million impact from foreign currency, streaming ARPU rose 12% year over year. Operating income in Q4 amounted to $459m (vs. $216m last year). While this was slightly lower than our beginning-of-quarter forecast of $475m, we’re primarily managing by our full year operating margin target, which we met (13% in FY19 vs. 10% in FY18).
EPS for Q4 amounted to $1.30 vs. $0.30 a year ago. During Q4, the US Treasury issued final regulations on certain aspects of the 2017 US tax reform. As a result, we had over-accrued in the first three quarters of 2019 for tax, which was adjusted in Q4, resulting in our net income being higher than operating income this quarter. We paid US corporate taxes for the full year inclusive of this Q4 adjustment.
Global paid net additions totaled 8.8m in Q4, on par with the 8.8m in the prior year period and ahead of our forecast of 7.6m, fueled by our broad slate of original programming and the worldwide adoption of streaming video. We generated Q4-record paid net adds in each of the EMEA, LATAM and APAC regions, while UCAN paid net adds totaled 0.55m (with 0.42m in the US) vs. 1.75m in the year ago quarter. Our low membership growth in UCAN is probably due to our recent price changes and to US competitive launches. We have seen more muted impact from competitive launches outside the US (NL, CA, AU). As always, we are working hard to improve our service to combat these factors and push net adds higher over time.
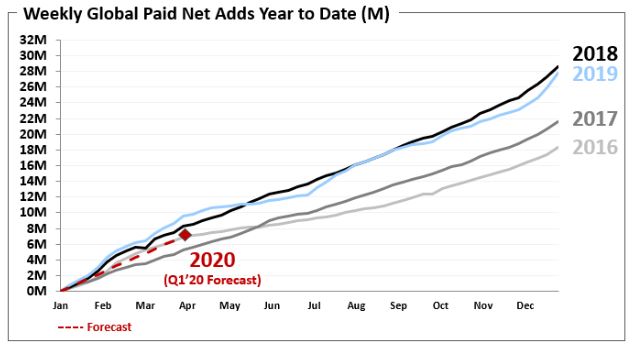
As a reminder, the quarterly guidance we provide is our actual internal forecast at the time we report. For Q1’20, we forecast global paid net adds of 7.0m vs. 9.6m in Q1’19, which was an all-time high in quarterly paid net adds. Our Q1’20 forecast reflects the continued, slightly elevated churn levels we are seeing in the US plus an expectation for more balanced paid net adds across Q1 and Q2 this year, with seasonality more similar to 2018 than 2019. This is due in part to the timing of last year’s price changes and a strong upcoming Q2 content slate, where we’ll have some of our bigger titles like La Casa De Papel (aka Money Heist) season 4.
We’re targeting a 16% operating margin in 2020 (up 300 basis points year over year). As a reminder, large swings in foreign exchange (F/X) could lead to some temporary variations from our annual margin progression, partially because we don’t spend on derivatives to hedge our F/X exposure and about half of our revenue is not in US dollars.
Content
Great content grows engagement among our members, which we believe drives word-of-mouth, improves retention and grows paid memberships. We have many exciting releases for Q1’20 including returning seasons of Sex Education, Altered Carbon, Narcos: Mexico, the Spanish series Elite and Korean historical zombie thriller Kingdom, as well as action film Spenser Confidential (starring Mark Wahlberg) and the movie sequel To All the Boys: P.S. I Still Love You. New original series include the recently released Messiah and the buzzy docu-series Killer Inside: The Mind of Aaron Hernandez and the upcoming I Am Not Okay with This.
These titles build off of a highly successful Q4 content slate, which included new seasons of The Crown, Big Mouth and You and new series and films like Rhythm & Flow, American Son, Turkish series The Gift and French film Banlieusards (aka Street Flow). The psychological thriller You, which originated on US linear TV with a modest audience, has evolved into a global phenomenon on Netflix; we estimate, based on the first few weeks, 54m member households will choose to watch season 2 in its first 4 weeks. In its first four weeks, over 21m member households have chosen to watch season 3 of The Crown (up over 40% from Season 2 over the same time period) and in total, over 73m households worldwide have chosen The Crown since the series launched. The Crown and the all new Season 3 cast just won the Screen Actors Guild Award for Best Ensemble in a Drama series and star Olivia Colman won the Golden Globe for Best Actress in a Drama Series.
During December, we also launched The Witcher, which is tracking to be our biggest season one TV series ever. Through its first four weeks of release, 76m member households chose to watch this action-packed fantasy, starring Henry Cavill. As a testament to how our hit content can penetrate the global zeitgeist and influence popular culture, the show’s launch drove up sales of The Witcher books1 and games2 around the world, and spawned a viral musical hit3.
Our Q4 movie slate set a new bar for the variety and high quality of films we produce to appeal to our members’ many different tastes. We released 6 Underground, from director Michael Bay and starring Ryan Reynolds, and 83m member households chose this crowd-pleasing action film through its first four weeks. The exceptional breadth and quality of our film slate was recognized as we led all studios with 24 Academy Award nominations across eight different films. The nominated feature films produced by the Netflix studio like The Irishman, Marriage Story and The Two Popes were also very popular with our members. Having launched our original film initiative just under five years ago, this is a proud achievement and a testament to the creative talent with whom we partner.
Across both film and TV, we were also recognized for being the home for storytellers and creators from many diverse backgrounds. We’re honored to lead the industry in nominations at both the NAACP Image Awards4 (42 nominations) and the GLAAD Media Awards5 (15 nominations).
___________________________________
1 https://www.forbes.com/sites/paultassi/2020/01/05/netflixs-the-witcher-has-sold-out-physical-copies-of-the-books-on-amazon-in-stores/#623dadb3102a
2 https://www.techspot.com/news/83362-witcher-3-has-more-steam-players-now-than.html
3 https://nypost.com/2020/01/09/the-viral-hit-toss-a-coin-to-your-witcher-was-almost-a-rap-song/
4 https://www.nydailynews.com/news/national/ny-netflix-leads-pack-for-naacp-image-awards-20200110-e6eyep4vdvfyfmqexfhqfgo3wa-story.html
5 https://www.chicagotribune.com/entertainment/ct-ent-glaad-media-awards-nominations-20200108-3bodmd553nf3fdocyllo7kqjra-story.html
We know that local audiences love local stories. In fact, local originals were the most popular 2019 titles in many countries, including India, Korea, Japan, Turkey, Thailand, Sweden and the UK. In addition, we've seen how members all around the world also love these stories with La Casa de Papel/Money Heist appearing on our top ten lists in more than 70 countries. K-content is also popular globally, and we're investing heavily in Korean stories. In this past quarter, we inked a TV output deal with JTBC, a leading Korean media company, and a strategic partnership with CJ ENM’s Studio Dragon, Korea’s largest TV studio. These deals will enable us to bring more K-dramas to fans all over the world.
Over the past several years, we’ve been developing an animation studio within Netflix to produce a wide array of animated content for kids, adults and families. We have amazing creators with pedigree from Disney Animation, Pixar, DreamWorks Animation and Illumination now working at Netflix on their next big projects. In Q4, we debuted filmmaker Sergio Pablos’ Klaus6, our first original feature-length animated film that was also nominated for an Academy Award. In its first 28 days, 40m members chose to watch this heartwarming Santa Claus origin story. Later in 2020, we’ll premiere the ambitious Over The Moon7, from legendary animator Glen Keane, followed by a schedule that builds to several big animated feature films per year.
As we’ve expanded our original content, we’ve been working on how to best share content highlights that demonstrate popularity. Given that we now have titles with widely varying lengths - from short episodes (e.g. Special at around 15 minutes) to long films (e.g. The Highwaymen at 132 minutes), we believe that reporting households viewing a title based on 70% of a single episode of a series or of an entire film, which we have been doing, makes less sense. We are now reporting on households (accounts) that chose to watch a given title8. Our new methodology is similar to the BBC iPlayer in their rankings9 based on “requests” for the title, “most popular” articles on the New York Times which include those who opened the articles, and YouTube view counts. This way, short and long titles are treated equally, leveling the playing field for all types of our content including interactive content, which has no fixed length. The new metric is about 35% higher on average than the prior metric. For example, 45m member households chose to watch Our Planet under the new metric vs. 33m under the prior metric.
Product and Partnerships
In Product, we are investing our resources to grow engagement and our storytelling capabilities (like the branching narratives in Black Mirror: Bandersnatch), deepen our penetration in key markets and help our members find great content through better suggestions. To do this, we try many approaches; in 2019 alone, we conducted hundreds of product tests to try to improve our member experience from sign up to billing and payments to content discovery. About 30% of these led to a gain in retention, engagement or revenue, up from 20% in the prior year. It’s a humbling exercise as so many of our ideas do not “win” with members, but this helps tune our judgment and innovation priorities for the future.
___________________________________
6 https://www.salon.com/2019/11/16/klaus-review-christmas-netflix/
7 https://variety.com/2018/film/awards/glen-keane-direct-animated-movie-over-the-moon-1202689347/
8 Chose to watch and did watch for at least 2 minutes -- long enough to indicate the choice was intentional -- is the precise definition
9 https://www.bbc.co.uk/mediacentre/latestnews/2019/iplayer-2018-stats
In Q4, we launched a mobile-only plan in Malaysia and Indonesia (which we introduced to India in Q3 last year). We’ve seen similar results with this plan driving incremental subscriber growth and improving retention. We expect the mobile-only plan to be revenue-positive which will allow us to further invest in content to be enjoyed by our members and continue to feed the virtuous cycle. We plan to continue to test adding this plan, as well as additional ideas in other countries around the world.
Competition
Many media companies and tech giants are launching streaming services, reinforcing the major trend of the transition from linear to streaming entertainment. This is happening all over the world and is still in its early stages, leaving ample room for many services to grow as linear TV wanes. We have a big headstart in streaming and will work to build on that by focusing on the same thing we have focused on for the past 22 years - pleasing members. We believe if we do that well, Netflix will continue to prosper. As an example, in Q4, despite the big debut of Disney+ and the launch of Apple TV+, our viewing per membership grew both globally and in the US on a year over year basis, consistent with recent quarters. Below is a comparison of Google search trends10 for The Witcher, Disney’s The Mandalorian, Amazon’s Jack Ryan and Apple’s The Morning Show.
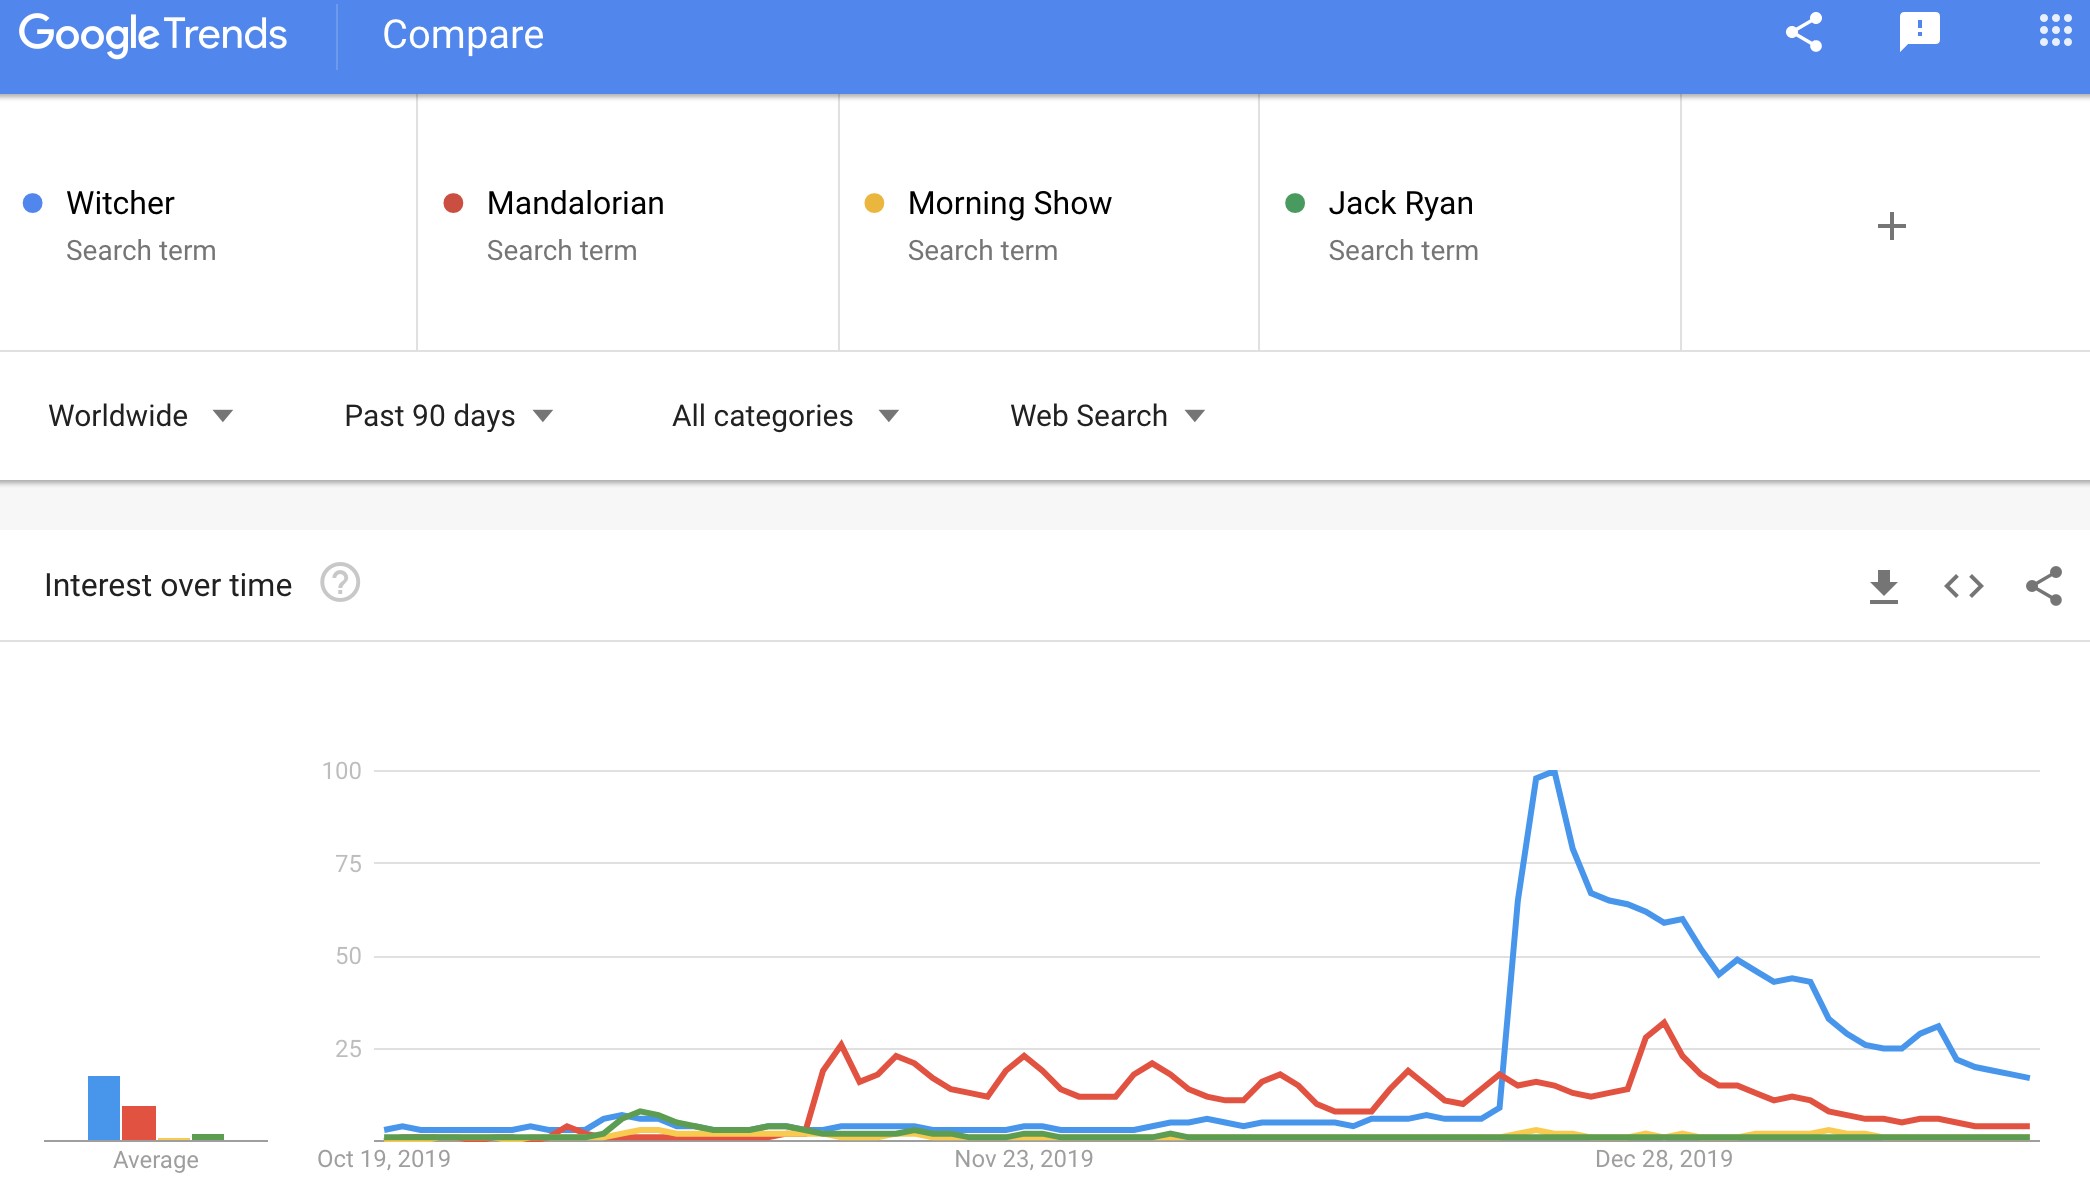
Source: Google Trends. Note: Netflix, Amazon Prime Video and Apple TV+ are global x-China, while Disney+ is only in NL, US, CA, and AU. If Disney+ were global we don’t think the picture would be much different, to judge from the NL results11 where Disney+ first launched.
___________________________________
10 https://trends.google.com/trends/explore?date=today%203-m&q=Witcher,Mandalorian,Morning%20Show,jack%20ryan
11 https://trends.google.com/trends/explore?date=today%203-m&geo=NL&q=Witcher,Mandalorian,Morning%20Show,jack%20ryan
Cash Flow and Capital Structure
In Q4, net cash used in operating activities was -$1.5 billion vs. -$1.2 billion in the prior year period. Free cash flow (FCF)12 in Q4 totaled -$1.7 billion vs. -$1.3 billion in Q4’18. For the full year, FCF was -$3.3 billion which we believe is the peak in our annual FCF deficit.
Our plan is to continually improve FCF each year and to move slowly toward FCF positive. For 2020, we currently forecast FCF of approximately -$2.5 billion. Along the way, we’ll continue to use the debt market to finance our investment needs as we did in Q4’19, when we raised $1.0 billion 4.875% senior notes and €1.1 billion 3.625% senior notes, both due in 2030. With our FCF profile improving, this means that over time we’ll be less reliant on public markets and will be able to fund more of our investment needs organically through our growing operating profits.
___________________________________
12 For a reconciliation of free cash flow to net cash (used in) operating activities, please refer to the reconciliation in tabular form on the attached unaudited financial statements and the footnotes thereto.
Reference
For quick reference, our eight most recent investor letters are: October 2019,13 July 2019,14 April 2019,15 January 2019,16 October 2018,17 July 2018,18 April 2018,19 January 2018.20
Appendix
Table 1
|
|
|
|
|
|
|
|
|
|
|
|
|
|
|
|
|
|
| (in millions) |
Q4'18 |
Q1'19 |
Q2'19 |
Q3'19 |
Q4'19 |
| UCAN Streaming: |
|
|
|
|
|
| Revenue |
$ |
2,161 |
|
$ |
2,257 |
|
$ |
2,501 |
|
$ |
2,621 |
|
$ |
2,672 |
|
| Paid Memberships |
64.76 |
|
66.63 |
|
66.50 |
|
67.11 |
|
67.66 |
|
| Paid Net Additions |
1.75 |
|
1.88 |
|
(0.13) |
|
0.61 |
|
0.55 |
|
| ARPU |
$ |
11.28 |
|
$ |
11.45 |
|
$ |
12.52 |
|
$ |
13.08 |
|
$ |
13.22 |
|
| Y/Y % Growth |
10 |
% |
4 |
% |
12 |
% |
17 |
% |
17 |
% |
| F/X Neutral Y/Y % ARPU Growth |
10 |
% |
4 |
% |
13 |
% |
17 |
% |
17 |
% |
|
|
|
|
|
|
| EMEA: |
|
|
|
|
|
| Revenue |
$ |
1,097 |
|
$ |
1,233 |
|
$ |
1,319 |
|
$ |
1,428 |
|
$ |
1,563 |
|
| Paid Memberships |
37.82 |
|
42.54 |
|
44.23 |
|
47.36 |
|
51.78 |
|
| Paid Net Additions |
3.98 |
|
4.72 |
|
1.69 |
|
3.13 |
|
4.42 |
|
| ARPU |
$ |
10.20 |
|
$ |
10.23 |
|
$ |
10.13 |
|
$ |
10.40 |
|
$ |
10.51 |
|
| Y/Y % Growth |
3 |
% |
(4) |
% |
(6) |
% |
1 |
% |
3 |
% |
| F/X Neutral Y/Y % ARPU Growth |
6 |
% |
2 |
% |
3 |
% |
6 |
% |
7 |
% |
|
|
|
|
|
|
| LATAM: |
|
|
|
|
|
| Revenue |
$ |
567 |
|
$ |
630 |
|
$ |
677 |
|
$ |
741 |
|
$ |
746 |
|
| Paid Memberships |
26.08 |
|
27.55 |
|
27.89 |
|
29.38 |
|
31.42 |
|
| Paid Net Additions |
1.96 |
|
1.47 |
|
0.34 |
|
1.49 |
|
2.04 |
|
| ARPU |
$ |
7.53 |
|
$ |
7.84 |
|
$ |
8.14 |
|
$ |
8.63 |
|
$ |
8.18 |
|
| Y/Y % Growth |
(13) |
% |
(11) |
% |
(5) |
% |
8 |
% |
9 |
% |
| F/X Neutral Y/Y % ARPU Growth |
6 |
% |
7 |
% |
12 |
% |
17 |
% |
18 |
% |
|
|
|
|
|
|
| APAC: |
|
|
|
|
|
| Revenue |
$ |
277 |
|
$ |
320 |
|
$ |
349 |
|
$ |
382 |
|
$ |
418 |
|
| Paid Memberships |
10.61 |
|
12.14 |
|
12.94 |
|
14.49 |
|
16.23 |
|
| Paid Net Additions |
1.15 |
|
1.53 |
|
0.80 |
|
1.54 |
|
1.75 |
|
| ARPU |
$ |
9.19 |
|
$ |
9.37 |
|
$ |
9.29 |
|
$ |
9.29 |
|
$ |
9.07 |
|
| Y/Y % Growth |
(4) |
% |
(2) |
% |
(1) |
% |
— |
% |
(1) |
% |
| F/X Neutral Y/Y % ARPU Growth |
2 |
% |
3 |
% |
5 |
% |
3 |
% |
— |
% |
___________________________________
13 https://s22.q4cdn.com/959853165/files/doc_financials/quarterly_reports/2019/q3/FINAL-Q3-19-Shareholder-Letter.pdf
14 https://s22.q4cdn.com/959853165/files/doc_financials/quarterly_reports/2019/q2/Q2-19-Shareholder-Letter-FINAL.pdf
15 https://s22.q4cdn.com/959853165/files/doc_financials/quarterly_reports/2019/q1/FINAL-Q1-19-Shareholder-Letter.pdf
16 https://s22.q4cdn.com/959853165/files/doc_financials/quarterly_reports/2018/q4/01/FINAL-Q4-18-Shareholder-Letter.pdf
17 https://s22.q4cdn.com/959853165/files/doc_financials/quarterly_reports/2018/q3/FINAL-Q3-18-Shareholder-Letter.pdf
18 https://s22.q4cdn.com/959853165/files/doc_financials/quarterly_reports/2018/q2/FINAL-Q2-18-Shareholder-Letter.pdf
19 https://s22.q4cdn.com/959853165/files/doc_financials/quarterly_reports/2018/q1/FINAL-Q1-18-Shareholder-Letter.pdf
20 https://s22.q4cdn.com/959853165/files/doc_financials/quarterly_reports/2017/q4/COMBINED-Q4-17-Shareholder-Letter-FINAL.pdf
Table 2 (Final letter for this table)
|
|
|
|
|
|
|
|
|
|
|
|
|
|
|
|
|
|
| (in millions) |
Q4'18 |
Q1'19 |
Q2'19 |
Q3'19 |
Q4'19 |
| US Streaming: |
|
|
|
|
|
| Revenue |
$ |
1,996 |
|
$ |
2,074 |
|
$ |
2,299 |
|
$ |
2,413 |
|
$ |
2,458 |
|
| Contribution Profit* |
$ |
590 |
|
$ |
713 |
|
$ |
852 |
|
$ |
991 |
|
$ |
757 |
|
| Contribution Margin* |
29.6 |
% |
34.4 |
% |
37.1 |
% |
41.1 |
% |
30.8 |
% |
| Paid Memberships |
58.49 |
|
60.23 |
|
60.10 |
|
60.62 |
|
61.04 |
|
| Paid Net Additions |
1.53 |
|
1.74 |
|
(0.13) |
|
0.52 |
|
0.42 |
|
|
|
|
|
|
|
| International Streaming: |
|
|
|
|
|
| Revenue |
$ |
2,106 |
|
$ |
2,367 |
|
$ |
2,548 |
|
$ |
2,760 |
|
$ |
2,941 |
|
| Contribution Profit* |
$ |
82 |
|
$ |
274 |
|
$ |
416 |
|
$ |
558 |
|
$ |
328 |
|
| Contribution Margin* |
3.9 |
% |
11.6 |
% |
16.3 |
% |
20.2 |
% |
11.2 |
% |
| Paid Memberships |
80.77 |
|
88.63 |
|
91.46 |
|
97.71 |
|
106.05 |
|
| Paid Net Additions |
7.31 |
|
7.86 |
|
2.83 |
|
6.26 |
|
8.33 |
|
|
|
|
|
|
|
| *Certain prior period amounts have been reclassified from G&A to Cost of revenues and Marketing and from Tech & Dev. to Cost of revenues to conform to current period presentation |
|
|
|
|
|
January 21, 2020 Earnings Interview, 3pm PST
Our video interview with Michael Morris of Guggenheim Securities will be on youtube/netflixir at 3pm PST today. Questions that investors would like to see asked should be sent to michael.morris@guggenheimpartners.com. Reed Hastings, CEO, Spence Neumann, CFO, Ted Sarandos, Chief Content Officer, Greg Peters, Chief Product Officer and Spencer Wang, VP of IR/Corporate Development will all be on the video to answer Michael’s questions.
|
|
|
|
|
|
IR Contact:
|
PR Contact:
|
Spencer Wang |
Richard Siklos |
VP, Finance/IR & Corporate Development |
VP, Communications |
408 809-5360 |
408 540-2629 |
Use of Non-GAAP Measures
This shareholder letter and its attachments include reference to the non-GAAP financial measure of free cash flow and adjusted EBITDA. Management believes that free cash flow and adjusted EBITDA are important liquidity metrics because they measure, during a given period, the amount of cash generated that is available to repay debt obligations, make investments and for certain other activities or the amount of cash used in operations, including investments in global streaming content. However, these non-GAAP measures should be considered in addition to, not as a substitute for or superior to, net income, operating income, diluted earnings per share and net cash provided by operating activities, or other financial measures prepared in accordance with GAAP. Reconciliation to the GAAP equivalent of these non-GAAP measures are contained in tabular form on the attached unaudited financial statements.
Forward-Looking Statements
This shareholder letter contains certain forward-looking statements within the meaning of the federal
securities laws, including statements regarding global paid net additions; churn; seasonality; distribution of net adds across quarters; full-year operating margin target; future content offerings; product tests; revenue impact of product changes; future capital raises; reliance on public markets for cash needs; impact of competition; global streaming paid memberships and growth; consolidated revenue, revenue growth, operating income, operating margin, net income, and earnings per share; and peak free cash flow. The forward-looking statements in this letter are subject to risks and uncertainties that could cause actual results and events to differ, including, without limitation: our ability to attract new members and retain existing members; our ability to compete effectively; maintenance and expansion of device platforms for streaming; fluctuations in consumer usage of our service; service disruptions; production risks; actions of Internet Service Providers; and, competition, including consumer adoption of different modes of viewing in-home filmed entertainment. A detailed discussion of these and other risks and uncertainties that could cause actual results and events to differ materially from such forward-looking statements is included in our filings with the Securities and Exchange Commission, including our Annual Report on Form 10-K, filed with the Securities and Exchange Commission (“SEC”) on January 29, 2019, as amended by Form 10-K/A, filed with the SEC on February 8, 2019. The Company provides internal forecast numbers. Investors should anticipate that actual performance will vary from these forecast numbers based on risks and uncertainties discussed above and in our Annual Report on Form 10-K, as amended by Form 10-K/A. We undertake no obligation to update forward-looking statements to reflect events or circumstances occurring after the date of this shareholder letter.
Netflix, Inc.
Consolidated Statements of Operations
(unaudited)
(in thousands, except per share data)
|
|
|
|
|
|
|
|
|
|
|
|
|
|
|
|
|
|
|
|
|
|
|
|
|
|
|
|
|
|
|
Three Months Ended |
|
|
|
|
|
Twelve Months Ended |
|
|
|
December 31,
2019 |
|
September 30,
2019 |
|
December 31,
2018 |
|
December 31,
2019 |
|
December 31,
2018 |
| Revenues |
$ |
5,467,434 |
|
|
$ |
5,244,905 |
|
|
$ |
4,186,841 |
|
|
$ |
20,156,447 |
|
|
$ |
15,794,341 |
|
Cost of revenues |
3,466,023 |
|
|
3,097,919 |
|
|
2,733,400 |
|
|
12,440,213 |
|
|
9,967,538 |
|
Marketing |
878,937 |
|
|
553,797 |
|
|
730,355 |
|
|
2,652,462 |
|
|
2,369,469 |
|
Technology and development |
409,376 |
|
|
379,776 |
|
|
331,789 |
|
|
1,545,149 |
|
|
1,221,814 |
|
General and administrative |
254,586 |
|
|
233,174 |
|
|
175,530 |
|
|
914,369 |
|
|
630,294 |
|
| Operating income |
458,512 |
|
|
980,239 |
|
|
215,767 |
|
|
2,604,254 |
|
|
1,605,226 |
|
| Other income (expense): |
|
|
|
|
|
|
|
|
|
| Interest expense |
(177,801) |
|
|
(160,660) |
|
|
(128,807) |
|
|
(626,023) |
|
|
(420,493) |
|
| Interest and other income (expense) |
(131,378) |
|
|
192,744 |
|
|
32,436 |
|
|
84,000 |
|
|
41,725 |
|
| Income before income taxes |
149,333 |
|
|
1,012,323 |
|
|
119,396 |
|
|
2,062,231 |
|
|
1,226,458 |
|
| Provision for (benefit from) income taxes |
(437,637) |
|
|
347,079 |
|
|
(14,538) |
|
|
195,315 |
|
|
15,216 |
|
| Net income |
$ |
586,970 |
|
|
$ |
665,244 |
|
|
$ |
133,934 |
|
|
$ |
1,866,916 |
|
|
$ |
1,211,242 |
|
| Earnings per share: |
|
|
|
|
|
|
|
|
|
| Basic |
$ |
1.34 |
|
|
$ |
1.52 |
|
|
$ |
0.31 |
|
|
$ |
4.26 |
|
|
$ |
2.78 |
|
| Diluted |
$ |
1.30 |
|
|
$ |
1.47 |
|
|
$ |
0.30 |
|
|
$ |
4.13 |
|
|
$ |
2.68 |
|
| Weighted-average common shares outstanding: |
|
|
|
|
|
|
|
|
|
| Basic |
438,547 |
|
|
438,090 |
|
|
436,385 |
|
|
437,799 |
|
|
435,374 |
|
| Diluted |
451,367 |
|
|
451,552 |
|
|
451,116 |
|
|
451,765 |
|
|
451,244 |
|
Netflix, Inc.
Consolidated Balance Sheets
(unaudited)
(in thousands)
|
|
|
|
|
|
|
|
|
|
|
|
|
|
|
As of |
|
|
|
|
December 31,
2019 |
|
December 31,
2018 |
| Assets |
|
|
|
|
| Current assets: |
|
|
|
|
| Cash and cash equivalents |
|
$ |
5,018,437 |
|
|
$ |
3,794,483 |
|
|
|
|
|
|
| Current content assets, net |
|
— |
|
|
5,151,186 |
|
| Other current assets |
|
1,160,067 |
|
|
748,466 |
|
| Total current assets |
|
6,178,504 |
|
|
9,694,135 |
|
| Non-current content assets, net* |
|
24,504,567 |
|
|
14,951,141 |
|
| Property and equipment, net |
|
565,221 |
|
|
418,281 |
|
| Other non-current assets* |
|
2,727,420 |
|
|
910,843 |
|
| Total assets |
|
$ |
33,975,712 |
|
|
$ |
25,974,400 |
|
| Liabilities and Stockholders' Equity |
|
|
|
|
| Current liabilities: |
|
|
|
|
| Current content liabilities* |
|
$ |
4,413,561 |
|
|
$ |
4,681,562 |
|
| Accounts payable |
|
674,347 |
|
|
562,985 |
|
| Accrued expenses and other liabilities* |
|
843,043 |
|
|
481,874 |
|
| Deferred revenue |
|
924,745 |
|
|
760,899 |
|
| Total current liabilities |
|
6,855,696 |
|
|
6,487,320 |
|
| Non-current content liabilities |
|
3,334,323 |
|
|
3,759,026 |
|
| Long-term debt |
|
14,759,260 |
|
|
10,360,058 |
|
| Other non-current liabilities |
|
1,444,276 |
|
|
129,231 |
|
| Total liabilities |
|
26,393,555 |
|
|
20,735,635 |
|
| Stockholders' equity: |
|
|
|
|
| Common stock |
|
2,793,929 |
|
|
2,315,988 |
|
| Accumulated other comprehensive loss |
|
(23,521) |
|
|
(19,582) |
|
| Retained earnings |
|
4,811,749 |
|
|
2,942,359 |
|
| Total stockholders' equity |
|
7,582,157 |
|
|
5,238,765 |
|
| Total liabilities and stockholders' equity |
|
$ |
33,975,712 |
|
|
$ |
25,974,400 |
|
|
|
|
|
|
| *Certain prior period amounts have been reclassified to conform to the current period presentation. DVD content assets have been reclassified from "Non-current content assets, net" to "Other non-current assets" and DVD content liabilities have been reclassified from "Current content liabilities" to "Accrued expenses and other liabilities". |
|
|
|
|
Netflix, Inc.
Consolidated Statements of Cash Flows
(unaudited)
(in thousands)
|
|
|
|
|
|
|
|
|
|
|
|
|
|
|
|
|
|
|
|
|
|
|
|
|
|
|
|
|
|
|
Three Months Ended |
|
|
|
|
|
Twelve Months Ended |
|
|
|
December 31,
2019 |
|
September 30,
2019 |
|
December 31,
2018 |
|
December 31,
2019 |
|
December 31,
2018 |
| Cash flows from operating activities: |
|
|
|
|
|
|
|
|
|
| Net income |
$ |
586,970 |
|
|
$ |
665,244 |
|
|
$ |
133,934 |
|
|
$ |
1,866,916 |
|
|
$ |
1,211,242 |
|
| Adjustments to reconcile net income to net cash used in operating activities: |
|
|
|
|
|
|
|
|
|
| Additions to streaming content assets |
(3,945,542) |
|
|
(3,648,292) |
|
|
(3,784,252) |
|
|
(13,916,683) |
|
|
(13,043,437) |
|
| Change in streaming content liabilities |
(571,351) |
|
|
(95,548) |
|
|
266,653 |
|
|
(694,011) |
|
|
999,880 |
|
| Amortization of streaming content assets |
2,579,669 |
|
|
2,279,977 |
|
|
2,053,660 |
|
|
9,216,247 |
|
|
7,532,088 |
|
| Depreciation and amortization of property, equipment and intangibles |
27,818 |
|
|
26,704 |
|
|
23,219 |
|
|
103,579 |
|
|
83,157 |
|
| Stock-based compensation expense |
100,066 |
|
|
100,262 |
|
|
88,714 |
|
|
405,376 |
|
|
320,657 |
|
|
|
|
|
|
|
|
|
|
|
| Other non-cash items* |
63,893 |
|
|
57,934 |
|
|
18,301 |
|
|
228,230 |
|
|
81,640 |
|
| Foreign currency remeasurement loss (gain) on long-term debt |
122,100 |
|
|
(171,360) |
|
|
(21,953) |
|
|
(45,576) |
|
|
(73,953) |
|
| Deferred taxes |
(188,694) |
|
|
52,105 |
|
|
(14,479) |
|
|
(94,443) |
|
|
(85,520) |
|
| Changes in operating assets and liabilities: |
|
|
|
|
|
|
|
|
|
| Other current assets |
(195,951) |
|
|
145 |
|
|
(88,359) |
|
|
(252,113) |
|
|
(200,192) |
|
| Accounts payable |
230,847 |
|
|
(7,643) |
|
|
121,831 |
|
|
96,063 |
|
|
199,198 |
|
| Accrued expenses and other liabilities |
(234,036) |
|
|
260,872 |
|
|
(49,776) |
|
|
157,778 |
|
|
150,422 |
|
| Deferred revenue |
9,239 |
|
|
22,729 |
|
|
44,176 |
|
|
163,846 |
|
|
142,277 |
|
| Other non-current assets and liabilities |
(47,003) |
|
|
(44,923) |
|
|
(26,741) |
|
|
(122,531) |
|
|
2,062 |
|
| Net cash used in operating activities |
(1,461,975) |
|
|
(501,794) |
|
|
(1,235,072) |
|
|
(2,887,322) |
|
|
(2,680,479) |
|
| Cash flows from investing activities: |
|
|
|
|
|
|
|
|
|
| Purchases of property and equipment |
(107,737) |
|
|
(45,333) |
|
|
(70,120) |
|
|
(253,035) |
|
|
(173,946) |
|
| Change in other assets* |
(99,834) |
|
|
(4,021) |
|
|
(10,238) |
|
|
(134,029) |
|
|
(165,174) |
|
|
|
|
|
|
|
|
|
|
|
|
|
|
|
|
|
|
|
|
|
|
|
|
|
|
|
|
|
|
|
| Net cash used in investing activities |
(207,571) |
|
|
(49,354) |
|
|
(80,358) |
|
|
(387,064) |
|
|
(339,120) |
|
| Cash flows from financing activities: |
|
|
|
|
|
|
|
|
|
| Proceeds from issuance of debt |
2,226,110 |
|
|
— |
|
|
2,061,852 |
|
|
4,469,306 |
|
|
3,961,852 |
|
| Debt issuance costs |
(17,942) |
|
|
— |
|
|
(18,879) |
|
|
(36,134) |
|
|
(35,871) |
|
| Proceeds from issuance of common stock |
15,633 |
|
|
11,989 |
|
|
11,450 |
|
|
72,490 |
|
|
124,502 |
|
|
|
|
|
|
|
|
|
|
|
| Other financing activities |
— |
|
|
— |
|
|
(559) |
|
|
— |
|
|
(1,956) |
|
| Net cash provided by financing activities |
2,223,801 |
|
|
11,989 |
|
|
2,053,864 |
|
|
4,505,662 |
|
|
4,048,527 |
|
| Effect of exchange rate changes on cash, cash equivalents, and restricted cash |
29,810 |
|
|
(29,325) |
|
|
(4,957) |
|
|
469 |
|
|
(39,682) |
|
| Net increase (decrease) in cash, cash equivalents, and restricted cash |
584,065 |
|
|
(568,484) |
|
|
733,477 |
|
|
1,231,745 |
|
|
989,246 |
|
| Cash, cash equivalents, and restricted cash at beginning of period |
4,459,721 |
|
|
5,028,205 |
|
|
3,078,564 |
|
|
3,812,041 |
|
|
2,822,795 |
|
| Cash, cash equivalents, and restricted cash at end of period |
$ |
5,043,786 |
|
|
$ |
4,459,721 |
|
|
$ |
3,812,041 |
|
|
$ |
5,043,786 |
|
|
$ |
3,812,041 |
|
|
|
|
|
|
|
|
|
|
|
|
Three Months Ended |
|
|
|
|
|
Twelve Months Ended |
|
|
|
December 31,
2019 |
|
September 30,
2019 |
|
December 31,
2018 |
|
December 31,
2019 |
|
December 31,
2018 |
| Non-GAAP free cash flow reconciliation: |
|
|
|
|
|
|
|
|
|
| Net cash used in operating activities |
$ |
(1,461,975) |
|
|
$ |
(501,794) |
|
|
$ |
(1,235,072) |
|
|
$ |
(2,887,322) |
|
|
$ |
(2,680,479) |
|
| Purchases of property and equipment |
(107,737) |
|
|
(45,333) |
|
|
(70,120) |
|
|
(253,035) |
|
|
(173,946) |
|
| Change in other assets |
(99,834) |
|
|
(4,021) |
|
|
(10,238) |
|
|
(134,029) |
|
|
(165,174) |
|
| Non-GAAP free cash flow |
$ |
(1,669,546) |
|
|
$ |
(551,148) |
|
|
$ |
(1,315,430) |
|
|
$ |
(3,274,386) |
|
|
$ |
(3,019,599) |
|
|
|
|
|
|
|
|
|
|
|
| *Certain prior period amounts have been reclassified to conform to the current period presentation. The amortization of DVD content assets has been reclassified into "Other non-cash items" within "Cash flows from operating activities". In addition, cash flows from the acquisition of DVD content assets have been reclassified into "Change in other assets" within "Cash flows from investing activities". |
|
|
|
|
|
|
|
|
|
Netflix, Inc.
Regional Information
(unaudited)
(in thousands)
|
|
|
|
|
|
|
|
|
|
|
|
|
|
|
|
|
|
|
|
|
|
|
|
|
|
|
|
|
|
|
As of / Three Months Ended |
|
|
|
|
|
As of/ Twelve Months Ended |
|
|
|
December 31,
2019 |
|
September 30,
2019 |
|
December 31,
2018 |
|
December 31,
2019 |
|
December 31,
2018 |
| UCAN Streaming |
|
|
|
|
|
|
|
|
|
| Revenues |
$ |
2,671,908 |
|
|
$ |
2,621,250 |
|
|
$ |
2,160,979 |
|
|
$ |
10,051,208 |
|
|
$ |
8,281,532 |
|
| Paid memberships at end of period |
67,662 |
|
|
67,114 |
|
|
64,757 |
|
|
67,662 |
|
|
64,757 |
|
| Paid net membership additions |
548 |
|
|
613 |
|
|
1,747 |
|
|
2,905 |
|
|
6,335 |
|
| Average number of paying memberships |
67,388 |
|
|
66,808 |
|
|
63,884 |
|
|
66,615 |
|
|
61,845 |
|
| Average monthly revenue per paying streaming membership |
$ |
13.22 |
|
|
$ |
13.08 |
|
|
$ |
11.28 |
|
|
$ |
12.57 |
|
|
$ |
11.16 |
|
|
|
|
|
|
|
|
|
|
|
| EMEA Streaming |
|
|
|
|
|
|
|
|
|
| Revenues |
$ |
1,562,561 |
|
|
$ |
1,428,040 |
|
|
$ |
1,096,812 |
|
|
$ |
5,543,067 |
|
|
$ |
3,963,707 |
|
| Paid memberships at end of period |
51,778 |
|
|
47,355 |
|
|
37,818 |
|
|
51,778 |
|
|
37,818 |
|
| Paid net membership additions |
4,423 |
|
|
3,126 |
|
|
3,982 |
|
|
13,960 |
|
|
11,814 |
|
| Average number of paying memberships |
49,567 |
|
|
45,792 |
|
|
35,827 |
|
|
44,731 |
|
|
31,601 |
|
| Average monthly revenue per paying streaming membership |
$ |
10.51 |
|
|
$ |
10.40 |
|
|
$ |
10.20 |
|
|
$ |
10.33 |
|
|
$ |
10.45 |
|
|
|
|
|
|
|
|
|
|
|
| LATAM Streaming |
|
|
|
|
|
|
|
|
|
| Revenues |
$ |
746,392 |
|
|
$ |
741,434 |
|
|
$ |
567,137 |
|
|
$ |
2,795,434 |
|
|
$ |
2,237,697 |
|
| Paid memberships at end of period |
31,417 |
|
|
29,380 |
|
|
26,077 |
|
|
31,417 |
|
|
26,077 |
|
| Paid net membership additions |
2,037 |
|
|
1,490 |
|
|
1,962 |
|
|
5,340 |
|
|
6,360 |
|
| Average number of paying memberships |
30,399 |
|
|
28,635 |
|
|
25,096 |
|
|
28,391 |
|
|
22,767 |
|
| Average monthly revenue per paying streaming membership |
$ |
8.18 |
|
|
$ |
8.63 |
|
|
$ |
7.53 |
|
|
$ |
8.21 |
|
|
$ |
8.19 |
|
|
|
|
|
|
|
|
|
|
|
| APAC Streaming |
|
|
|
|
|
|
|
|
|
| Revenues |
$ |
418,121 |
|
|
$ |
382,304 |
|
|
$ |
276,756 |
|
|
$ |
1,469,521 |
|
|
$ |
945,816 |
|
| Paid memberships at end of period |
16,233 |
|
|
14,485 |
|
|
10,607 |
|
|
16,233 |
|
|
10,607 |
|
| Paid net membership additions |
1,748 |
|
|
1,543 |
|
|
1,146 |
|
|
5,626 |
|
|
4,106 |
|
| Average number of paying memberships |
15,359 |
|
|
13,714 |
|
|
10,034 |
|
|
13,247 |
|
|
8,446 |
|
| Average monthly revenue per paying streaming membership |
$ |
9.07 |
|
|
$ |
9.29 |
|
|
$ |
9.19 |
|
|
$ |
9.24 |
|
|
$ |
9.33 |
|
|
|
|
|
|
|
|
|
|
|
| Total Streaming |
|
|
|
|
|
|
|
|
|
| Revenues |
$ |
5,398,982 |
|
|
$ |
5,173,028 |
|
|
$ |
4,101,684 |
|
|
$ |
19,859,230 |
|
|
$ |
15,428,752 |
|
| Paid memberships at end of period |
167,090 |
|
|
158,334 |
|
|
139,259 |
|
|
167,090 |
|
|
139,259 |
|
| Paid net membership additions |
8,756 |
|
|
6,772 |
|
|
8,837 |
|
|
27,831 |
|
|
28,615 |
|
| Average number of paying memberships |
162,712 |
|
|
154,948 |
|
|
134,841 |
|
|
152,984 |
|
|
124,658 |
|
| Average monthly revenue per paying streaming membership |
$ |
11.06 |
|
|
$ |
11.13 |
|
|
$ |
10.14 |
|
|
$ |
10.82 |
|
|
$ |
10.31 |
|
Netflix, Inc.
Non-GAAP Information
(unaudited)
(in thousands)
|
|
|
|
|
|
|
|
|
|
|
|
|
|
|
|
|
|
|
|
|
|
|
|
|
|
|
|
|
|
|
|
|
|
|
|
|
|
|
|
|
December 31,
2018 |
|
March 31,
2019 |
|
June 30,
2019 |
|
September 30,
2019 |
|
December 31,
2019 |
| Non-GAAP Adjusted EBITDA reconciliation: |
|
|
|
|
|
|
|
|
|
| GAAP net income |
$ |
133,934 |
|
|
$ |
344,052 |
|
|
$ |
270,650 |
|
|
$ |
665,244 |
|
|
$ |
586,970 |
|
| Add: |
|
|
|
|
|
|
|
|
|
| Other expense (income) |
96,371 |
|
|
59,425 |
|
|
205,503 |
|
|
(32,084) |
|
|
309,179 |
|
| Provision for (benefit from) income taxes |
(14,538) |
|
|
55,607 |
|
|
230,266 |
|
|
347,079 |
|
|
(437,637) |
|
| Depreciation and amortization of property, equipment and intangibles |
23,219 |
|
|
23,561 |
|
|
25,496 |
|
|
26,704 |
|
|
27,818 |
|
| Stock-based compensation expense |
88,714 |
|
|
101,200 |
|
|
103,848 |
|
|
100,262 |
|
|
100,066 |
|
| Adjusted EBITDA |
$ |
327,700 |
|
|
$ |
583,845 |
|
|
$ |
835,763 |
|
|
$ |
1,107,205 |
|
|
$ |
586,396 |
|
Netflix, Inc.
Appendix:
Domestic Streaming, International Streaming and DVD Information
(unaudited)
(in thousands)
|
|
|
|
|
|
|
|
|
|
|
|
|
|
|
|
|
|
|
|
|
|
|
|
|
|
|
|
|
|
|
As of / Three Months Ended |
|
|
|
|
|
As of/ Twelve Months Ended |
|
|
|
December 31,
2019 |
|
September 30,
2019 |
|
December 31,
2018 |
|
December 31,
2019 |
|
December 31,
2018 |
| Domestic Streaming |
|
|
|
|
|
|
|
|
|
| Paid memberships at end of period |
61,043 |
|
|
60,620 |
|
|
58,486 |
|
|
61,043 |
|
|
58,486 |
|
| Paid net membership additions |
423 |
|
|
517 |
|
|
1,529 |
|
|
2,557 |
|
|
5,676 |
|
|
|
|
|
|
|
|
|
|
|
| Revenues |
$ |
2,457,663 |
|
|
$ |
2,412,598 |
|
|
$ |
1,996,092 |
|
|
$ |
9,243,005 |
|
|
$ |
7,646,647 |
|
| Cost of revenues |
1,321,283 |
|
|
1,210,105 |
|
|
1,093,446 |
|
|
4,867,343 |
|
|
4,038,394 |
|
| Marketing |
379,597 |
|
|
211,793 |
|
|
312,739 |
|
|
1,063,042 |
|
|
1,025,351 |
|
| Contribution profit |
756,783 |
|
|
990,700 |
|
|
589,907 |
|
|
3,312,620 |
|
|
2,582,902 |
|
|
|
|
|
|
|
|
|
|
|
| International Streaming |
|
|
|
|
|
|
|
|
|
| Paid memberships at end of period |
106,047 |
|
|
97,714 |
|
|
80,773 |
|
|
106,047 |
|
|
80,773 |
|
| Paid net membership additions |
8,333 |
|
|
6,255 |
|
|
7,308 |
|
|
25,274 |
|
|
22,939 |
|
|
|
|
|
|
|
|
|
|
|
| Revenues |
$ |
2,941,319 |
|
|
$ |
2,760,430 |
|
|
$ |
2,105,592 |
|
|
$ |
10,616,225 |
|
|
$ |
7,782,105 |
|
| Cost of revenues |
2,113,631 |
|
|
1,860,021 |
|
|
1,606,275 |
|
|
7,449,663 |
|
|
5,776,047 |
|
| Marketing |
499,340 |
|
|
342,004 |
|
|
417,616 |
|
|
1,589,420 |
|
|
1,344,118 |
|
| Contribution profit |
328,348 |
|
|
558,405 |
|
|
81,701 |
|
|
1,577,142 |
|
|
661,940 |
|
|
|
|
|
|
|
|
|
|
|
| Domestic DVD |
|
|
|
|
|
|
|
|
|
| Paid memberships at end of period |
2,153 |
|
|
2,276 |
|
|
2,706 |
|
|
2,153 |
|
|
2,706 |
|
|
|
|
|
|
|
|
|
|
|
| Revenues |
$ |
68,452 |
|
|
$ |
71,877 |
|
|
$ |
85,157 |
|
|
$ |
297,217 |
|
|
$ |
365,589 |
|
| Cost of revenues |
31,109 |
|
|
27,793 |
|
|
33,679 |
|
|
123,207 |
|
|
153,097 |
|
| Contribution profit |
37,343 |
|
|
44,084 |
|
|
51,478 |
|
|
174,010 |
|
|
212,492 |
|
|
|
|
|
|
|
|
|
|
|
| Consolidated |
|
|
|
|
|
|
|
|
|
| Revenues |
$ |
5,467,434 |
|
|
$ |
5,244,905 |
|
|
$ |
4,186,841 |
|
|
$ |
20,156,447 |
|
|
$ |
15,794,341 |
|
| Cost of revenues |
3,466,023 |
|
|
3,097,919 |
|
|
2,733,400 |
|
|
12,440,213 |
|
|
9,967,538 |
|
| Marketing |
878,937 |
|
|
553,797 |
|
|
730,355 |
|
|
2,652,462 |
|
|
2,369,469 |
|
| Contribution profit |
1,122,474 |
|
|
1,593,189 |
|
|
723,086 |
|
|
5,063,772 |
|
|
3,457,334 |
|
| Other operating expenses |
663,962 |
|
|
612,950 |
|
|
507,319 |
|
|
2,459,518 |
|
|
1,852,108 |
|
| Operating income |
458,512 |
|
|
980,239 |
|
|
215,767 |
|
|
2,604,254 |
|
|
1,605,226 |
|
| Other income (expense) |
(309,179) |
|
|
32,084 |
|
|
(96,371) |
|
|
(542,023) |
|
|
(378,768) |
|
| Provision for (benefit from) income taxes |
(437,637) |
|
|
347,079 |
|
|
(14,538) |
|
|
195,315 |
|
|
15,216 |
|
| Net income |
$ |
586,970 |
|
|
$ |
665,244 |
|
|
$ |
133,934 |
|
|
$ |
1,866,916 |
|
|
$ |
1,211,242 |
|
|
|
|
|
|
|
|
|
|
|