Tesla Motors Inc 8-K 2013-05-08
Sign in or join
Add a note by highlighting text or Replying to an existing note.
Add a note by highlighting text or Replying to an existing note.
Exhibit 99.1

|
Tesla Motors, Inc. First Quarter 2013 Shareholder Letter
GAAP profitable even without the benefit of a one-time gain
Cash balance increased, despite making DOE loan payment
Record sales of $562 million, up 83% from last quarter
4,900 vehicles delivered
Gross margin doubled from last quarter to 17%
U.S. demand expected to exceed 15,000/year; global demand likely above 30,000/year |
May 8, 2013
Dear Fellow Shareholders:
Tesla reached profitability in the first quarter of 2013 for the first time in our ten year history. We exceeded our own targets for deliveries, significantly expanded gross margin, and improved execution throughout the company. Excluding non-cash warrant and stock option items, we generated a profit of $15 million. Including those factors, our GAAP profit was $11 million. Importantly, we achieved profitability despite the benefit of a one-time accounting gain related to the DOE warrant.
Production & Deliveries Up Over 80%, Exceeding Targets
During Q1, we consistently produced 400 or more Model S vehicles per week, for a total of over 5,000 during the quarter. We recognized 4,900 vehicles as revenue, exceeding our initial Q1 guidance of 4,500, despite physically delivering a higher number of vehicles, as the standard for revenue recognition was extremely high. Even if a car was received, fully paid for and signed off as good by a customer, we did not recognize the revenue if the paperwork was incorrect.
| As our manufacturing processes stabilized and our supply chain continued to mature, we turned our attention to improving execution. In the process, we reduced the hours required to build a car by almost 40% from December to March.
We also improved our inventory management. During Q1, raw materials declined by almost 26%, while unit production increased 80%. Better inventory management contributed over $30 million in cash and reduced our logistics costs during the quarter. |
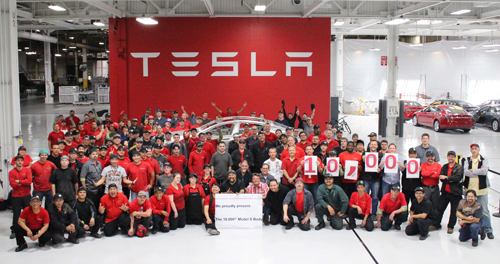
The 10,000th Model S Body |
Financing Product Expands Model S Market
Our goal has always been to make electric vehicles affordable to the mass market. The Model S is priced substantially lower than the Roadster and our third generation vehicle will again be priced much lower than the
Model S. However, in the near term, we believe that the right financing product can make a significant difference to the affordability of the Model S.
Working with US Bank and Wells Fargo, we are able to offer many customers the ability to buy a Model S with no money down (net of reimbursement from federal & state incentives) and an effective cost as low as $580 per month, taking into account savings from not using gasoline. When purchased for business use, the depreciation benefit reduces the effective monthly cost even further to as low as $350.
Moreover, Tesla guarantees a resale price in three years that is the highest of any premium sedan brand made in volume. We believe that this has the potential to make the Model S accessible to a much larger customer base.
Growing Rate of Worldwide Orders
We are pleased with the strong global demand for Model S and are currently receiving orders at a rate greater than 20,000 per year worldwide. Importantly, we are seeing orders in a particular region increase proportionate to the number of deliveries, which means that customers are selling other customers on the car. Given that we have not yet delivered any customer cars outside of North America, there would appear to be significant upside potential in Europe and Asia.
|
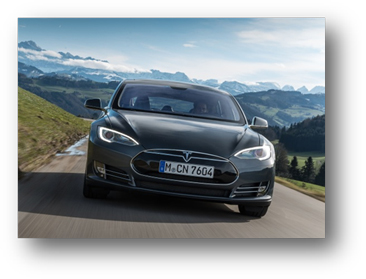
Model S in the Alps |
We continue to modify our sales processes to simplify and enhance the customer experience. As vehicle production became more reliable during Q1, we realized that the reservation process was cumbersome and therefore eliminated it. Customers in North America now order their customized Model S online in a simple three step process, rather than placing a generic reservation in a queue. As a result, quarter-end reservation data is no longer a meaningful metric, nor is it comparable to prior quarters. Going forward, we believe that the accepted automotive industry approach of focusing on margin improvement, profitability and deliveries are the more meaningful metrics for measuring progress. |
|
Building the Best Ownership Experience
The ideal service experience is, of course, never to need service, but when necessary, we now offer top of the line Tesla vehicles as loaner cars. Through our valet service, which will be rolled out over the next three months, we deliver another Model S to the customer at their choice of location and pick up their car. Since we also plan to offer these loaner cars for sale at a discount according to age and miles driven, the loaner fleet is constantly refreshed, resulting in the loaner cars usually being newer and with more options than the customer car in service. For some additional fun, customers in most markets can opt to receive a Tesla Roadster while their Model S is in for service.
Also, while we do recommend an annual checkup for optimal performance, Model S will also now no longer require an annual service contract to maintain the vehicle warranty. Moreover, for customer peace of mind, the battery pack now comes with a no fault warranty. Even if a customer never reads or follows the manual, the Model S battery pack is always covered by Tesla.
Finally, to support the growing fleet of customer cars, in Q1 we opened 12 new service locations, bringing our total network to 41 locations. We remain on plan to add approximately 30 service locations in total in 2013.
| The expansion of our store and gallery network is also continuing on plan. At quarter end, we had 34 stores and galleries around the world, and plan to open about 15 more stores and galleries this year with about half the openings in Europe and Asia. This year we have already opened a gallery in Austin, Texas, and stores in Century City, California, and Frankfurt, Germany. We also moved our location at Santana Row, California to a new, larger store to accommodate stronger than expected visitor traffic levels. Global store and gallery visitor traffic has remained very strong.
We have been hard at work on improving our Supercharger technology and in building out new Supercharger stations, with a major announcement expected within the next few weeks. As always, Tesla Supercharging is fast, convenient and free forever. |
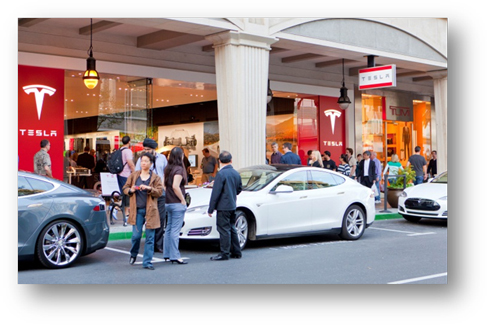
New Store at Santana Row, California |
Improving the Car of the Year
Like we did with the Roadster, we continue to improve Model S for both new and existing customers. We recently introduced a lower cost, 60 kWh battery pack for Model S. This Model S has outstanding 0-60 mph acceleration and an EPA certified range of 208 miles on a single charge. We also introduced a Performance Plus option for our 85 kWh cars. Using a combination of wider tires and enhanced suspension components, we were able to improve dynamic handling and ride quality while extending range by about ten miles.
|
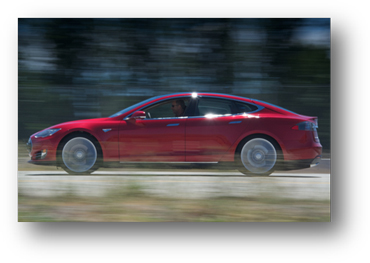
During Q1, we also started delivery of cars with standard coil suspension (in addition to active air suspension), and in April, we introduced a new, red paint. We remotely pushed software updates to our customer fleet, adding incremental functionality such as voice activation of the infotainment system. By holding down the voice button and saying Play XX song by YY artist, you can play almost any song in the world on demand. |
|
| New Red |
Quarterly Results
Total revenues for Q1 rose 83% from Q4 to $562 million, a new record for Tesla. In addition to record Model S deliveries in Q1, we continued to supply full electric powertrains and battery packs at a steady pace to Toyota for their RAV4 EV program. We also completed various deliverables under the Mercedes Benz B-Class EV program which contributed to total development services revenue of almost $7 million.
From Q4 to Q1, total gross margin rose from 8% to 17%, as a result of a higher Model S production rate, manufacturing efficiencies, part cost reductions and regulatory credit sales. Zero emission vehicle (ZEV) credits sold to other automakers amounted to approximately $68 million or 12% of revenues. We expect this to decline
significantly in future quarters, as ZEV credits will only apply to about 1/6 of worldwide deliveries, versus roughly half of US deliveries, and the price per credit has declined.
However, an important point for investors to note is that we are reaffirming our prior guidance of a gross margin of 25% in Q4 2013, assuming zero ZEV credit revenue. This may turn out to be greater than zero, but we are not counting on it. What really matters is improving fundamental automotive gross margin, excluding regulatory credits. On this front, Tesla improved nine percentage points from the prior quarter and continues to improve every month.
Research and development (R&D) expenses were $47 million on a non-GAAP basis and $55 million on a GAAP basis. R&D spending declined by 23% from Q4 on a non-GAAP basis, as very high expenses associated with the Model S launch declined substantially. Increasing production by over 3000% from Roadster to Model S was extremely difficult and many mistakes were made, but now we are starting to get the hang of things.
Selling, general and administrative (SG&A) expenses were $41 million on a non-GAAP basis and $47 million on a GAAP basis, up slightly from Q4. The increase was driven primarily by additional selling expenses related to the expansion of our store network and service infrastructure, and by increased information technology costs.
Q1 non-GAAP net income was $15 million, and $11.2 million on a GAAP basis. Non-GAAP basic EPS was $0.13 and $0.10 on a GAAP basis, using 114.7 million weighted shares outstanding. On a fully diluted basis, non-GAAP EPS was $0.12. GAAP diluted EPS was $0.00, as net income has been adjusted to exclude the one-time non-cash gain of $10.7 million from the elimination of our Department of Energy (DoE) warrant liability as required under GAAP.
Our total cash was $231 million at quarter end, an increase of $10 million from last quarter, despite making the second quarterly principal repayment of almost $13 million on our DoE loan. Total cash includes short term restricted cash set aside primarily for the next DoE loan payment due in June 2013, and excludes noncurrent restricted cash.
Outlook
While we expect to build about 5,000 Model S vehicles in Q2, some cars will be in transit to Europe for start of deliveries in Q3. As a result, we expect to deliver slightly over 4,500 vehicles during Q2, all in North America. For the full year of 2013, we expect to exceed our prior target of 20,000 worldwide deliveries and feel comfortable raising guidance to about 21,000 deliveries.
Obviously, there is a huge amount of work ahead to improve the gross margin of Model S, but we have a clear roadmap to achieve component cost reductions, as well as achieve additional manufacturing and logistics efficiencies. As a result, we expect to achieve gross margin in the high teens in Q2. Importantly, this expectation includes the impact from lower ZEV credit sales, a lower average selling price due to a higher mix of 60 kWh cars, as well as limited sales of the now discontinued 40 kWh cars, which will have a range-limited 60 kWh battery pack. As mentioned above, we expect that our gross margin will continue to rise into the second half of the year to our target of 25%, assuming no contribution from ZEV credits.
The lease accounting treatment for cars sold through our new financing plan will have no impact on our cash flows, and we expect to be roughly breakeven on cash flow from operations in Q2, despite launch costs in Europe and a huge increase in service centers, stores and Supercharger stations. However, the deferred revenue recognition required by GAAP for lease accounting will lead to a net loss on paper in Q2. We plan to provide information so that investors can evaluate our results both with and without the impact of lease accounting, as we believe the actual effect on Tesla is positive.
Operating expenses are expected to increase moderately in Q2. R&D expenses are expected to increase slightly from Q1 as the pace of product development starts to pick up. SG&A expenses will continue to rise moderately, primarily due to the growth in our stores and service centers.
We plan to spend about $200 million on capital expenditures in 2013, as we conclude the majority of our investment in the Tesla Factory and Model S tooling. Capital spending also includes the expansion of our service, store and Supercharger networks and new product development.
2013 is off to a strong start, and we look forward to seeing more of you on the road in a Model S this year.

|

|
|
| Elon Musk, Chairman & CEO | Deepak Ahuja, Chief Financial Officer | |
Webcast Information
Tesla will provide a live webcast of its first quarter 2013 financial results conference call beginning at 2:30 p.m. PT on May 8, 2013, at ir.teslamotors.com. This webcast will also be available for replay for approximately one year thereafter.
Forward-Looking Statements
Certain statements in this shareholder letter, including statements in the Outlook section of this Shareholder Letter; statements regarding profitability in Q2 2013 and cost reduction efforts; statements relating to the progress Tesla is making with respect to the development, European and Asian launch expectations, schedule for the introduction of future options and variants, quality improvements, delivery and volume expectations of Model S; the ability of our suppliers to supply quality parts at reduced costs; the ability to achieve vehicle demand, volume, revenue, gross margin, spending, profitability and cash flow targets; the expected growth rate in reservations and cancellations, and future store, service center and Tesla Supercharger expected costs, openings and expansion plans are forward-looking statements that are subject to risks and uncertainties. These forward-looking statements are based on managements current expectations, and as a result of certain risks and uncertainties actual results may differ materially from those projected. The following important factors, without limitation, could cause actual results to differ materially from those in the forward-looking statements: Teslas future success depends on its ability to design and achieve market acceptance of Model S and other new vehicle models, specifically Model X; the risk of delays in the manufacture, production and delivery ramp of Model S vehicles; the ability of suppliers to meet quality and part delivery expectations; consumers willingness to adopt electric vehicles and electric cars in particular; competition in the automotive market generally and the alternative fuel vehicle market in particular; Teslas ability to establish, maintain and strengthen the Tesla brand; the unavailability, reduction or elimination of governmental and economic incentives for electric vehicles; Teslas ability to establish, maintain and strengthen its relationships with strategic partners such as Daimler, Toyota and Panasonic; and Teslas ability to execute on its plans for its new interactive retail strategy and for new store, service center and Tesla Supercharger openings. More information on potential factors that could affect the Companys financial results is included from time to time in Teslas Securities and Exchange Commission filings and reports, including the risks identified under the section captioned Risk Factors in our quarterly report on Form 10-K filed on March 7, 2013. Tesla disclaims any obligation to update information contained in these forward-looking statements whether as a result of new information, future events, or otherwise.
| Investor Relations Contact: | Press Contact: | |||
| Jeff Evanson | Sarah Meron | |||
| VP Investor Relations Tesla Motors | VP Communications Tesla Motors | |||
| ir@teslamotors.com | smeron@teslamotors.com |
For additional information, please visit ir.teslamotors.com.
Tesla Motors, Inc.
Condensed Consolidated Statements of Operations
(Unaudited)
(In thousands, except per share data)
| Three Months Ended | ||||||||||||
| Mar 31, 2013 |
Dec 31, 2012 |
Mar 31, 2012 |
||||||||||
| Revenues |
||||||||||||
| Automotive sales |
$ | 555,203 | $ | 294,377 | $ | 19,245 | ||||||
| Development services |
6,589 | 11,955 | 10,922 | |||||||||
|
|
|
|
|
|
|
|||||||
| Total revenues |
561,792 | 306,332 | 30,167 | |||||||||
|
|
|
|
|
|
|
|||||||
| Cost of revenues |
||||||||||||
| Automotive sales |
461,818 | 278,710 | 13,932 | |||||||||
| Development services |
3,654 | 3,765 | 6,025 | |||||||||
|
|
|
|
|
|
|
|||||||
| Total cost of revenues (1) |
465,472 | 282,475 | 19,957 | |||||||||
|
|
|
|
|
|
|
|||||||
| Gross profit |
96,320 | 23,857 | 10,210 | |||||||||
| Operating expenses |
||||||||||||
| Research and development (1) |
54,859 | 68,832 | 68,391 | |||||||||
| Selling, general and administrative (1) |
47,045 | 45,908 | 30,582 | |||||||||
|
|
|
|
|
|
|
|||||||
| Total operating expenses |
101,904 | 114,740 | 98,973 | |||||||||
|
|
|
|
|
|
|
|||||||
| Loss from operations |
(5,584 | ) | (90,883 | ) | (88,763 | ) | ||||||
| Interest income |
10 | 85 | 90 | |||||||||
| Interest expense |
(118 | ) | (27 | ) | (65 | ) | ||||||
| Other income (expense), net (2) |
17,091 | 746 | (1,076 | ) | ||||||||
|
|
|
|
|
|
|
|||||||
| Income (loss) before income taxes |
11,399 | (90,079 | ) | (89,814 | ) | |||||||
| Provision for (benefit from) income taxes |
151 | (147 | ) | 59 | ||||||||
|
|
|
|
|
|
|
|||||||
| Net income (loss) |
$ | 11,248 | $ | (89,932 | ) | $ | (89,873 | ) | ||||
|
|
|
|
|
|
|
|||||||
| Net income (loss) per common share, basic (3) |
$ | 0.10 | $ | (0.79 | ) | $ | (0.86 | ) | ||||
|
|
|
|
|
|
|
|||||||
| Shares used in per share calculation, basic (3) |
114,712 | 113,763 | 104,784 | |||||||||
|
|
|
|
|
|
|
|||||||
| Net income (loss) per common share, diluted (3)(4) |
$ | 0.00 | $ | (0.79 | ) | $ | (0.86 | ) | ||||
|
|
|
|
|
|
|
|||||||
| Shares used in per share calculation, diluted (3) |
124,265 | 113,763 | 104,784 | |||||||||
|
|
|
|
|
|
|
|||||||
| Notes: |
||||||||||||
| (1) Includes stock-based compensation expense of the following for the periods presented: |
|
|||||||||||
| Cost of revenues |
$ | 1,536 | $ | 1,638 | $ | 7 | ||||||
| Research and development | 7,644 | 7,159 | 5,932 | |||||||||
| Selling, general and administrative | 5,688 | 5,619 | 4,772 | |||||||||
|
|
|
|
|
|
|
|||||||
| Total stock-based compensation expense | $ | 14,868 | $ | 14,416 | $ | 10,711 | ||||||
|
|
|
|
|
|
|
|||||||
| (2) | Other income, net, for the three months ended March 31, 2013 includes the gain from the elimination of the $10.7 million DoE common stock warrant liability and a $6.4 million favorable foreign currency exchange impact. |
| (3) | On October 3, 2012, the Company completed its follow-on public offering, pursuant to which the Company sold 7,964,601 shares of common stock. |
| (4) | For the purposes of calculating our diluted income per share for the three months ended March 31, 2013, net income has been adjusted to exclude the one-time non-cash gain of $10.7 million from the elimination of our DoE warrant liability. |
Tesla Motors, Inc.
Condensed Consolidated Balance Sheets
(Unaudited)
(In thousands)
| March 31, 2013 |
December 31, 2012 |
|||||||
| Assets |
||||||||
| Cash and cash equivalents |
$ | 214,417 | $ | 201,890 | ||||
| Restricted cash - current |
16,719 | 19,094 | ||||||
| Accounts receivable |
46,139 | 26,842 | ||||||
| Inventory |
237,618 | 268,504 | ||||||
| Prepaid expenses and other current assets |
11,100 | 8,438 | ||||||
| Operating lease vehicles, net |
9,060 | 10,071 | ||||||
| Property and equipment, net |
581,997 | 552,229 | ||||||
| Restricted cash - noncurrent |
5,044 | 5,159 | ||||||
| Other assets |
21,684 | 21,963 | ||||||
|
|
|
|
|
|||||
| Total assets |
$ | 1,143,778 | $ | 1,114,190 | ||||
|
|
|
|
|
|||||
| Liabilities and Stockholders Equity |
||||||||
| Accounts payable and accrued liabilities |
$ | 344,915 | $ | 343,180 | ||||
| Deferred revenue |
9,024 | 4,964 | ||||||
| Customer deposits |
130,714 | 138,817 | ||||||
| Common stock warrant liability |
| 10,692 | ||||||
| Capital lease obligations |
15,912 | 14,330 | ||||||
| Long-term debt |
439,626 | 452,337 | ||||||
| Other long-term liabilities |
35,004 | 25,170 | ||||||
|
|
|
|
|
|||||
| Total liabilities |
975,195 | 989,490 | ||||||
| Stockholders equity |
168,583 | 124,700 | ||||||
|
|
|
|
|
|||||
| Total liabilities and stockholders equity |
$ | 1,143,778 | $ | 1,114,190 | ||||
|
|
|
|
|
|||||
Tesla Motors, Inc.
Supplemental Consolidated Financial Information
(Unaudited)
(In thousands)
| Three Months Ended | ||||||||||||
| Mar 31, 2013 |
Dec 31, 2012 |
Mar 31, 2012 |
||||||||||
| Selected Cash Flow Information |
||||||||||||
| Cash flows provided by (used in) operating activities |
$ | 64,079 | $ | (37,489 | ) | $ | (63,300 | ) | ||||
| Cash flows used in investing activities |
(55,236 | ) | (60,758 | ) | (66,227 | ) | ||||||
| Cash flows provided by financing activities |
3,684 | 214,444 | 92,831 | |||||||||
| Other Selected Financial Information |
||||||||||||
| Cash flows provided by (used in) operating activities |
$ | 64,079 | $ | (37,489 | ) | $ | (63,300 | ) | ||||
| Capital expenditures |
(57,727 | ) | (64,053 | ) | (54,774 | ) | ||||||
|
|
|
|
|
|
|
|||||||
| Free cash flow (cash flow from operations plus capital expenditures) |
$ | 6,352 | $ | (101,542 | ) | $ | (118,074 | ) | ||||
|
|
|
|
|
|
|
|||||||
| Depreciation and amortization |
$ | 17,850 | $ | 12,793 | $ | 4,163 | ||||||
| Mar 31, 2013 |
Dec 31, 2012 |
Mar 31, 2012 |
||||||||||
| Cash and Investments |
||||||||||||
| Cash and cash equivalents |
$ | 214,417 | $ | 201,890 | $ | 218,570 | ||||||
| Restricted cash - current |
16,719 | 19,094 | 39,199 | |||||||||
| Short-term marketable securities |
| | 25,009 | |||||||||
| Restricted cash - noncurrent |
5,044 | 5,159 | 3,805 | |||||||||
Tesla Motors, Inc.
Reconciliation of GAAP to Non-GAAP Financial Information
(Unaudited)
(In thousands, except per share data)
| Three Months Ended | ||||||||||||
| Mar 31, 2013 |
Dec 31, 2012 |
Mar 31, 2012 |
||||||||||
| Research and development expenses (GAAP) |
$ | 54,859 | $ | 68,832 | $ | 68,391 | ||||||
| Stock-based compensation expense |
(7,644 | ) | (7,159 | ) | (5,932 | ) | ||||||
|
|
|
|
|
|
|
|||||||
| Research and development expenses (Non-GAAP) |
$ | 47,215 | $ | 61,673 | $ | 62,459 | ||||||
|
|
|
|
|
|
|
|||||||
| Selling, general and administrative expenses (GAAP) |
$ | 47,045 | $ | 45,908 | $ | 30,582 | ||||||
| Stock-based compensation expense |
(5,688 | ) | (5,619 | ) | (4,772 | ) | ||||||
|
|
|
|
|
|
|
|||||||
| Selling, general and administrative expenses (Non-GAAP) |
$ | 41,357 | $ | 40,289 | $ | 25,810 | ||||||
|
|
|
|
|
|
|
|||||||
| Net income (loss) (GAAP) |
$ | 11,248 | $ | (89,932 | ) | $ | (89,873 | ) | ||||
| Stock-based compensation expense |
14,868 | 14,416 | 10,711 | |||||||||
| Change in fair value of warrant liability |
(10,692 | ) | 958 | (155 | ) | |||||||
|
|
|
|
|
|
|
|||||||
| Net income (loss) (Non-GAAP) |
$ | 15,424 | $ | (74,558 | ) | $ | (79,317 | ) | ||||
|
|
|
|
|
|
|
|||||||
| Net income (loss) per common share, basic (GAAP) |
$ | 0.10 | $ | (0.79 | ) | $ | (0.86 | ) | ||||
| Stock-based compensation expense |
0.13 | 0.13 | 0.10 | |||||||||
| Change in fair value of warrant liability |
(0.09 | ) | 0.01 | (0.00 | ) | |||||||
|
|
|
|
|
|
|
|||||||
| Net income (loss) per common share, basic (Non-GAAP) |
$ | 0.13 | $ | (0.65 | ) | $ | (0.76 | ) | ||||
|
|
|
|
|
|
|
|||||||
| Shares used in per share calculation, basic (GAAP and Non-GAAP) |
114,712 | 113,763 | 104,784 | |||||||||
|
|
|
|
|
|
|
|||||||
| Net income (loss) (GAAP) |
$ | 11,248 | $ | (89,932 | ) | $ | (89,873 | ) | ||||
| Adjustment for change in fair value of warrant liability |
(10,692 | ) | | | ||||||||
|
|
|
|
|
|
|
|||||||
| Net income (loss) used in calculation of diluted income (loss) per share (GAAP) |
$ | 556 | $ | (89,932 | ) | $ | (89,873 | ) | ||||
|
|
|
|
|
|
|
|||||||
| Net income (loss) per common share, diluted (GAAP) |
$ | 0.00 | $ | (0.79 | ) | $ | (0.86 | ) | ||||
| Stock-based compensation expense |
0.12 | 0.13 | 0.10 | |||||||||
| Change in fair value of warrant liability |
| 0.01 | (0.00 | ) | ||||||||
|
|
|
|
|
|
|
|||||||
| Net income (loss) per common share, diluted (Non-GAAP) |
$ | 0.12 | $ | (0.65 | ) | $ | (0.76 | ) | ||||
|
|
|
|
|
|
|
|||||||
| Shares used in per share calculation, diluted (GAAP and Non-GAAP) |
124,265 | 113,763 | 104,784 | |||||||||
|
|
|
|
|
|
|
|||||||
Non-GAAP Financial Information
Consolidated financial information has been presented in accordance with GAAP as well as on a non-GAAP basis. On a non-GAAP basis, financial measures exclude non-cash items such as stock-based compensation as well as the change in fair value related to Teslas warrant liability. Management believes that it is useful to supplement its GAAP financial statements with this non-GAAP information because management uses such information internally for its operating, budgeting and financial planning purposes. These non-GAAP financial measures also facilitate managements internal comparisons to Teslas historical performance as well as comparisons to the operating results of other companies. Non-GAAP information is not prepared under a comprehensive set of accounting rules and therefore, should only be read in conjunction with financial information reported under U.S. GAAP when understanding Teslas operating performance. A reconciliation between GAAP and non-GAAP financial information is provided above.